




Abstract
Purpose:
Optic nerve (ON) injury causes irreversible degeneration, leading to vision loss that cannot be restored with available therapeutics. Current therapies slow further degeneration but do not promote regeneration. New regenerative factors have been discovered that are successful in vivo. However, the mechanisms of efficient long-distance regeneration are still unknown. Membrane expansion by lipid insertion is an essential regenerative process, so lipid profiles for regenerating axons can provide insight into growth mechanisms. This article's analysis aims to add to the increasingly available ON regeneration lipid profiles and relate it to membrane order/properties.
Methods:
In this study, we present an analysis of glycerophospholipids, one of the largest axonal lipid groups, from three mammalian ON regeneration lipid profiles: Wnt3a, Zymosan + CPT-cAMP, and Phosphatase/Tensin homolog knockout (PTENKO) at 7 and 14 days post crush (dpc). Significant lipid classes, species, and ontological properties were crossreferenced between treatments and analyzed using Metaboanalyst 5.0 and Lipid Ontology (LION). Membrane order changes associated with significant lipid classes were evaluated by C-Laurdan dye and exogenous lipids provided to a neuroblastoma cell line.
Results and Conclusions:
At 7 dpc, ONs show increased lysoglycerophospholipids and decreased phosphatidylethanolamines (PEs)/negative intrinsic curvature lipids. At 14 dpc, regenerative treatments show divergence: Wnt3a displays higher lysoglycerophospholipid content, while Zymosan and PTENKO decrease lysoglycerophospholipids and increase phosphatidylcholine (PC)-related species. Membrane order imaging indicates lysoglycerophospholipids decreases membrane order while PE and PC had no significant membrane order effects. Understanding these changes will allow therapeutic development targeting lipid metabolic pathways that can be used for vision loss treatments.
Introduction
The field of lipidomics has made significant advances due to improved analytical capabilities. From the 1980s and on, high-resolution mass spectrometers and improved ionization methods allowed for the exponential growth of lipidomics. 1 Lipids are highly diverse molecules that can be chemically characterized by head groups, backbones, acyl chains, and saturation levels. Each lipid has an intrinsic curvature that affects a membrane's supramolecular shape. For example, phosphatidylcholine (PC) is a cylindrical, neutral intrinsic curvature lipid organized in lamellar phase structures. Lysoglycerophospholipids, such as lysophosphatidylcholine (LPC), are inverted cones, positive intrinsic curvature lipids that organize to the hexagonal I phase. These inherent lipid characteristics affect a membrane's ability to fuse. 2 It comes as no surprise that lipids are more than just a bilayer. Lipids are involved in cellular signaling, bioenergetics, and protein activity modulation. Lipid profiles are becoming increasingly available through online databases such as Metabolomics Workbench. Further analysis of these profiles will be necessary to identify mechanistic similarities.
Axon regeneration research is an exciting up-and-coming area addressing the central nervous system's reduced intrinsic regenerative capabilities. Multiple regenerative factors have been discovered.3–6 However, we lack the full mechanistic understanding of regenerating axons. Membrane expansion by lipid insertion is an essential axonal growth process that has been well studied. 7 Most axonal lipids are synthesized in the soma and anterogradely transported as vesicles to distal growth cones. These plasmalemmal precursor vesicles accumulate in the intermediate area between the axonal end and growth cone. The vesicles fuse with the membrane and continue axonal extension. At this time, the lipid components added to the growing axon have yet to be studied. Regenerating axonal lipid profiles can provide insight into the prioritized lipid metabolic pathways. This can further ophthalmologic research in axon regeneration, leading to significant treatment improvements.
Ocular degeneration affects millions of people and significantly reduces quality of life. Current treatments slow disease progression but cannot restore lost vision. The optic nerve (ON) is an accessible cranial nerve commonly studied with in vivo models. ON crush is a mechanical degeneration model using forceps to crush the nerve for 10 s. Regenerative treatments involve an intravitreal injection of regenerative factors into the eye's posterior chamber where retinal ganglion cells (RGCs) are the first layer in contact. The RGCs extend their axons through the optic disk into the ON. Regenerative treatments result in distal changes to axons. ON regeneration is evaluated at weekly time points. Multiple lipid profiles from ON regeneration models have been published8–11 and are freely available on Metabolomics Workbench. Glycerophospholipids, make up more than 50% of an axonal lipid profile and are significant players in neuronal morphology. 12 Glycerophospholipids are characterized by a glycerol backbone and a phosphate group. Further lipid classification is based on head groups.
In this study, we provide an analysis of three published ON regeneration models: Wnt3a, Zymosan +8-(4-Chlorophenylthio) adenosine 3′,5′-cyclic monophosphate (CPT-cAMP), and Phosphatase/Tensin homolog knockout (PTENKO) focusing on their glycerophospholipid profiles at 7 and 14 days postcrush (dpc) (Fig. 1). Meta-analysis was conducted using free online software: Metaboanalyst 5.0 and Lipid Ontology (LION). 13 All significant lipid classes, species, and ontological properties will be crossreferenced to draw conclusions. To understand how lipidomic shifts can affect neuronal membrane order, we provide exogenous lipids from different curvature classes to a neuroblastoma cell line and use a lipophilic, polarity-dependent dye (C-Laurdan) with single photon excitation. This analysis combination will allow us to describe regeneration from lipidomic and biophysical perspectives.
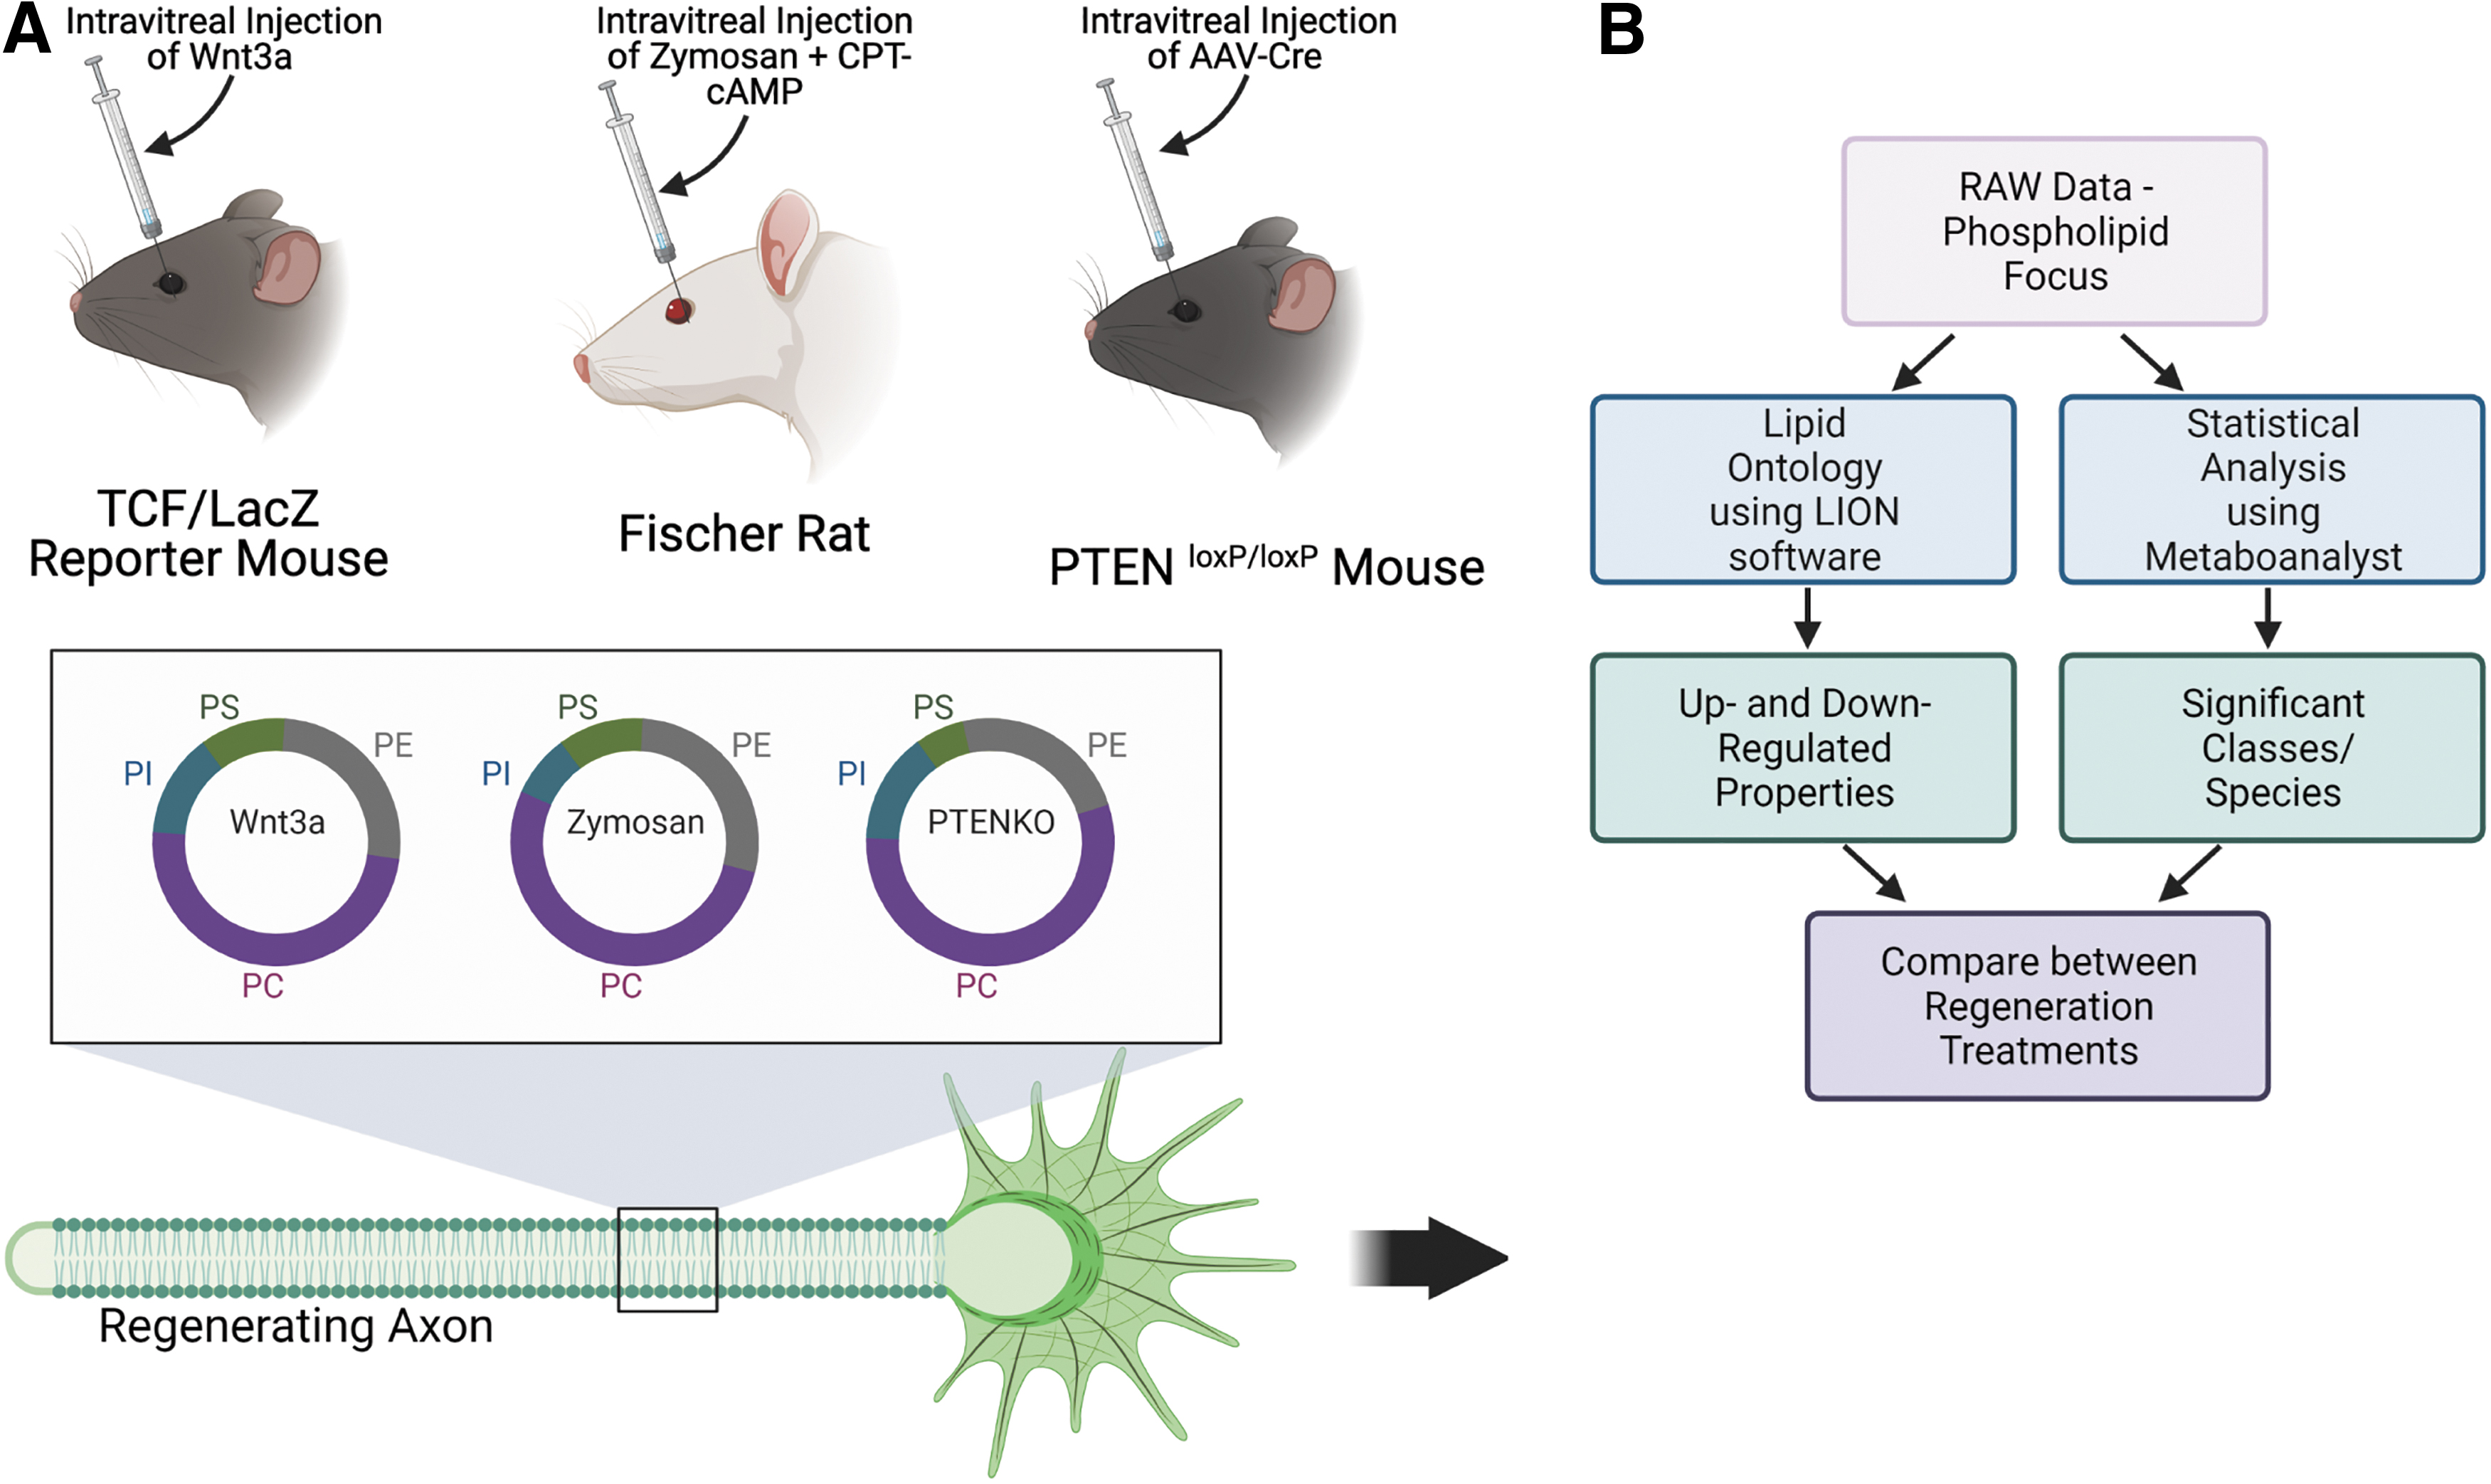
Schematic depicting ON regenerative models and analysis workflow.
Methods
ON crush and regenerative treatment methods
Lipid profiles were collected from Metabolomics Workbench (accession numbers/study ID): ST001073, ST000963, and ST001477. All published techniques used intravitreal injections as therapy delivery and ON crush as the degeneration model. ON crush is an established degenerative model involving surgical exposure of the ON and crushing 2 mm behind the eye with tweezers.14,15 Samples are excluded if vascular structures are damaged. Two ON regeneration models were pharmacologically induced, while one was a Cre-LoxP gene knockout. The Zymosan model used a Fischer rat model, while the other models were mouse (C57BL/6 and TCF/LacZ reporter mouse). The Zymosan and Wnt3a have a contralateral noncrush ON (noncrush), crush+PBS (vehicle), and crush+regenerative treatment (Zymosan/Wnt3a) ON samples. The PTENKO dataset had crush+AAV-PLAP (Vehicle) and crush+regenerative treatment (PTENKO). Rats, mice, and humans have ∼90% conservation of lipid metabolic genes. 16 Additionally, rats and mice display similar responses to regenerative treatments.4,17
Lipid extraction and data acquisition parameters
All lipid datasets were isolated and analyzed using identical methods/instrumentation. Lipids were extracted using the Bligh and Dyer technique. 18 Spectral data were obtained using a high-performance liquid chromatography system combined with a Q Exactive Orbitrap Mass Spectrometer. PTENKO used internal standards for normalization and quantitation to determine lipid concentration, while the Zymosan and Wnt3a lipid profiles used normalized peak areas.
Data processing and statistical analysis
The data were filtered by glycerophospholipids and analyzed using online software. Zymosan and Wnt3a spectral peak areas were converted to relative abundances and normalized by log transformation and data scaling to achieve normal distribution. PTENKO data were in concentrations and only required data scaling. Statistical analysis was performed using GraphPad Prism and Metaboanalyst to identify statistically significant glycerophospholipid classes and lipid species. Two-way analysis of variance (ANOVA) analysis with Sidak correction was used to identify significant lipid classes in GraphPad. Metaboanalyst uses false discovery rate and Fischer's LSD to identify significant lipid species and post hoc analysis. LION was used to identify significant physical and chemical properties within each lipid dataset. 13 The raw data were uploaded to LION, log2 transformed, and underwent two-tailed t-test analysis. Significant lipid classes, lipid species, and ontological properties were crossreferenced between each regenerative factor at 7 and 14 dpc. All associated graphs were subsequently made in GraphPad Prism 9.
Neuroblastoma cells, exogenous lipids, C-Laurdan staining
SH-SY5Y neuroblastoma cells were seeded at 10k in Nunc Glass Bottom 35-mm petri dishes and allowed to adhere for 24 h at 37°C. Lipids were obtained from Avanti Lipids and dried by speed vac. Lipids were reconstituted in ethanol at 15 mM. Lipids were sonicated for 25 min to ensure homogeneity. Lipids were added to Neuroblastoma Media (1:1 F12/Eagle's minimum essential medium, 10% fetal bovine serum) to obtain a final concentration of 10 μM and further sonicated. Neuroblastoma cells were exposed to lipid-containing media for 2 h at 37°C. Lipid-containing media were removed and replaced with C-Laurdan staining media (50 μM C-Laurdan in Neuroblastoma Media). Staining was allowed for 1 h at 37°C. Neuroblastoma cells were washed two times with PBS, fixed for 15 min using 4% paraformaldehyde at 37°C, and washed two more times.
Confocal imaging and ratiometric calculation of C-Laurdan staining
Fixed neuroblastoma cells were maintained in PBS for imaging. All confocal images were taken with a 63X oil objective on a Stellaris 5 confocal microscope. C-Laurdan imaging and ratiometric analysis are based on published methods.19–21
The 405 nm laser was used for excitation with two emission ranges: 415–455 nm and 490–530 nm. Laser power was minimized to avoid cellular photodamage. Each HyD Detector gains were adjusted to remove saturated pixels and provide equal total pixel intensities per channel. Therefore, shifts in either channel can be measured. Z stacks at 1.5 μm steps were taken per image to capture the entire cell. Images were processed by maximal projection to create a 2D image. Ratiometric or generalized polarization (GP) values were calculated using Equation 1. Hue–Saturation–Brightness (HSB) images were generated using an adapted ImageJ script
22
where the GP ratiometric image is combined with the original image to retain structural information.
Individual cells were selected using region of interest (ROI) and ∼50–60 cells were selected per condition. Only complete z-stacked imaged cells were included in the analysis. Statistical analysis of the mean GP values and GP distribution were completed with GraphPad Prism 9. Original studies pertaining to animal usage were done under appropriate IACUC approval.
Results
Pharmacologically induced ON regeneration models show significantly shifted lipid classes at 7- and 14-dpc
The first step to understanding the broad lipidomics of regenerative models is to evaluate glycerophospholipid class shifts. Classes are defined by their head groups and the number of acyl chains that result in unique chemical and physical properties. Glycerophospholipids generally have a negative charge due to the phosphor group, but the overall molecular charge can shift with head groups, such as the positively charged choline. The number of acyl chains varies from one to four total chains. Lysoglycerophospholipids are single chained. Phosphatidylcholines (PCs), phosphatidylserines (PS), phosphatidylglycerols (PGs), phosphatidylinositols (PI), phosphatidic acids (PAs), and phosphatidylethanolamines (PE) are all two acyl-chained glycerophospholipids. Cardiolipin (CL) is a unique glycerophospholipid residing within mitochondria containing four acyl chains.
Head groups and acyl chains dictate the lipid's intrinsic curvature and supramolecular structures. Glycerophospholipidomic data were collected from each mammalian ON regeneration lipid profile. Glycerophospholipid data were first condensed by generating sums per glycerophospholipid class for each sample.
Statistical analysis (ANOVA or t-test) was performed comparing identified glycerophospholipids between noncrush, vehicle, and regenerative groups. It is imperative that the directionality of lipid shifts is compared between vehicle and regenerative groups. Lipid shifts will be classified as either “Injury Response,” “Regenerative,” or “Indeterminate.” “Injury response” is defined as significant lipids in vehicle and regenerative groups similarly shifted from the noncrush group. These lipids can be used to understand injury-related lipids. Regenerative lipids are defined as lipids significantly shifted from noncrush and vehicle groups. Indeterminate is defined as significant lipids in vehicle and regenerative groups shifted in the same direction but to different extents from the noncrush group. For example, if vehicle and regenerative groups show decreased PE but have a two-fold and four-fold decrease, respectively, this would be considered indeterminate as it could be an injury response or regenerative.
At 7 dpc, only Zymosan and Wnt3a-induced regenerative models showed significantly shifted glycerophospholipid classes (Fig. 2). Zymosan (Fig. 2B) showed injury response increases in two lysoglycerophospholipids: dilysocardiolipin (DLCL) and lysophosphatidylinositol (LPI). Wnt3a and Zymosan had significant decreases of PE in the regenerative groups (Fig. 2A, B). Wnt3a's decreased PE is regenerative while Zymosan's decreased PE is indeterminate as it is significantly different from the noncrush group and only trending lower than the vehicle group. At 7 dpc, PE and lysoglycerophospholipids likely play a role in regeneration and injury response, respectively.

Significant Glycerophospholipid Classes at 7 days postcrush (dpc).
At 14 dpc, there are no shared glycerophospholipid class shifts between all three models. The Wnt3a group has significantly regenerative increase of lysophosphatidylserine. Zymosan shows decreased LPI (injury response) and increased DLCL, PA, and PI (regenerative) (Fig. 3B). PTENKO has significantly increased PC in regeneration (Fig. 3C). This lack of consensus may be due to the different regenerative treatment effects.
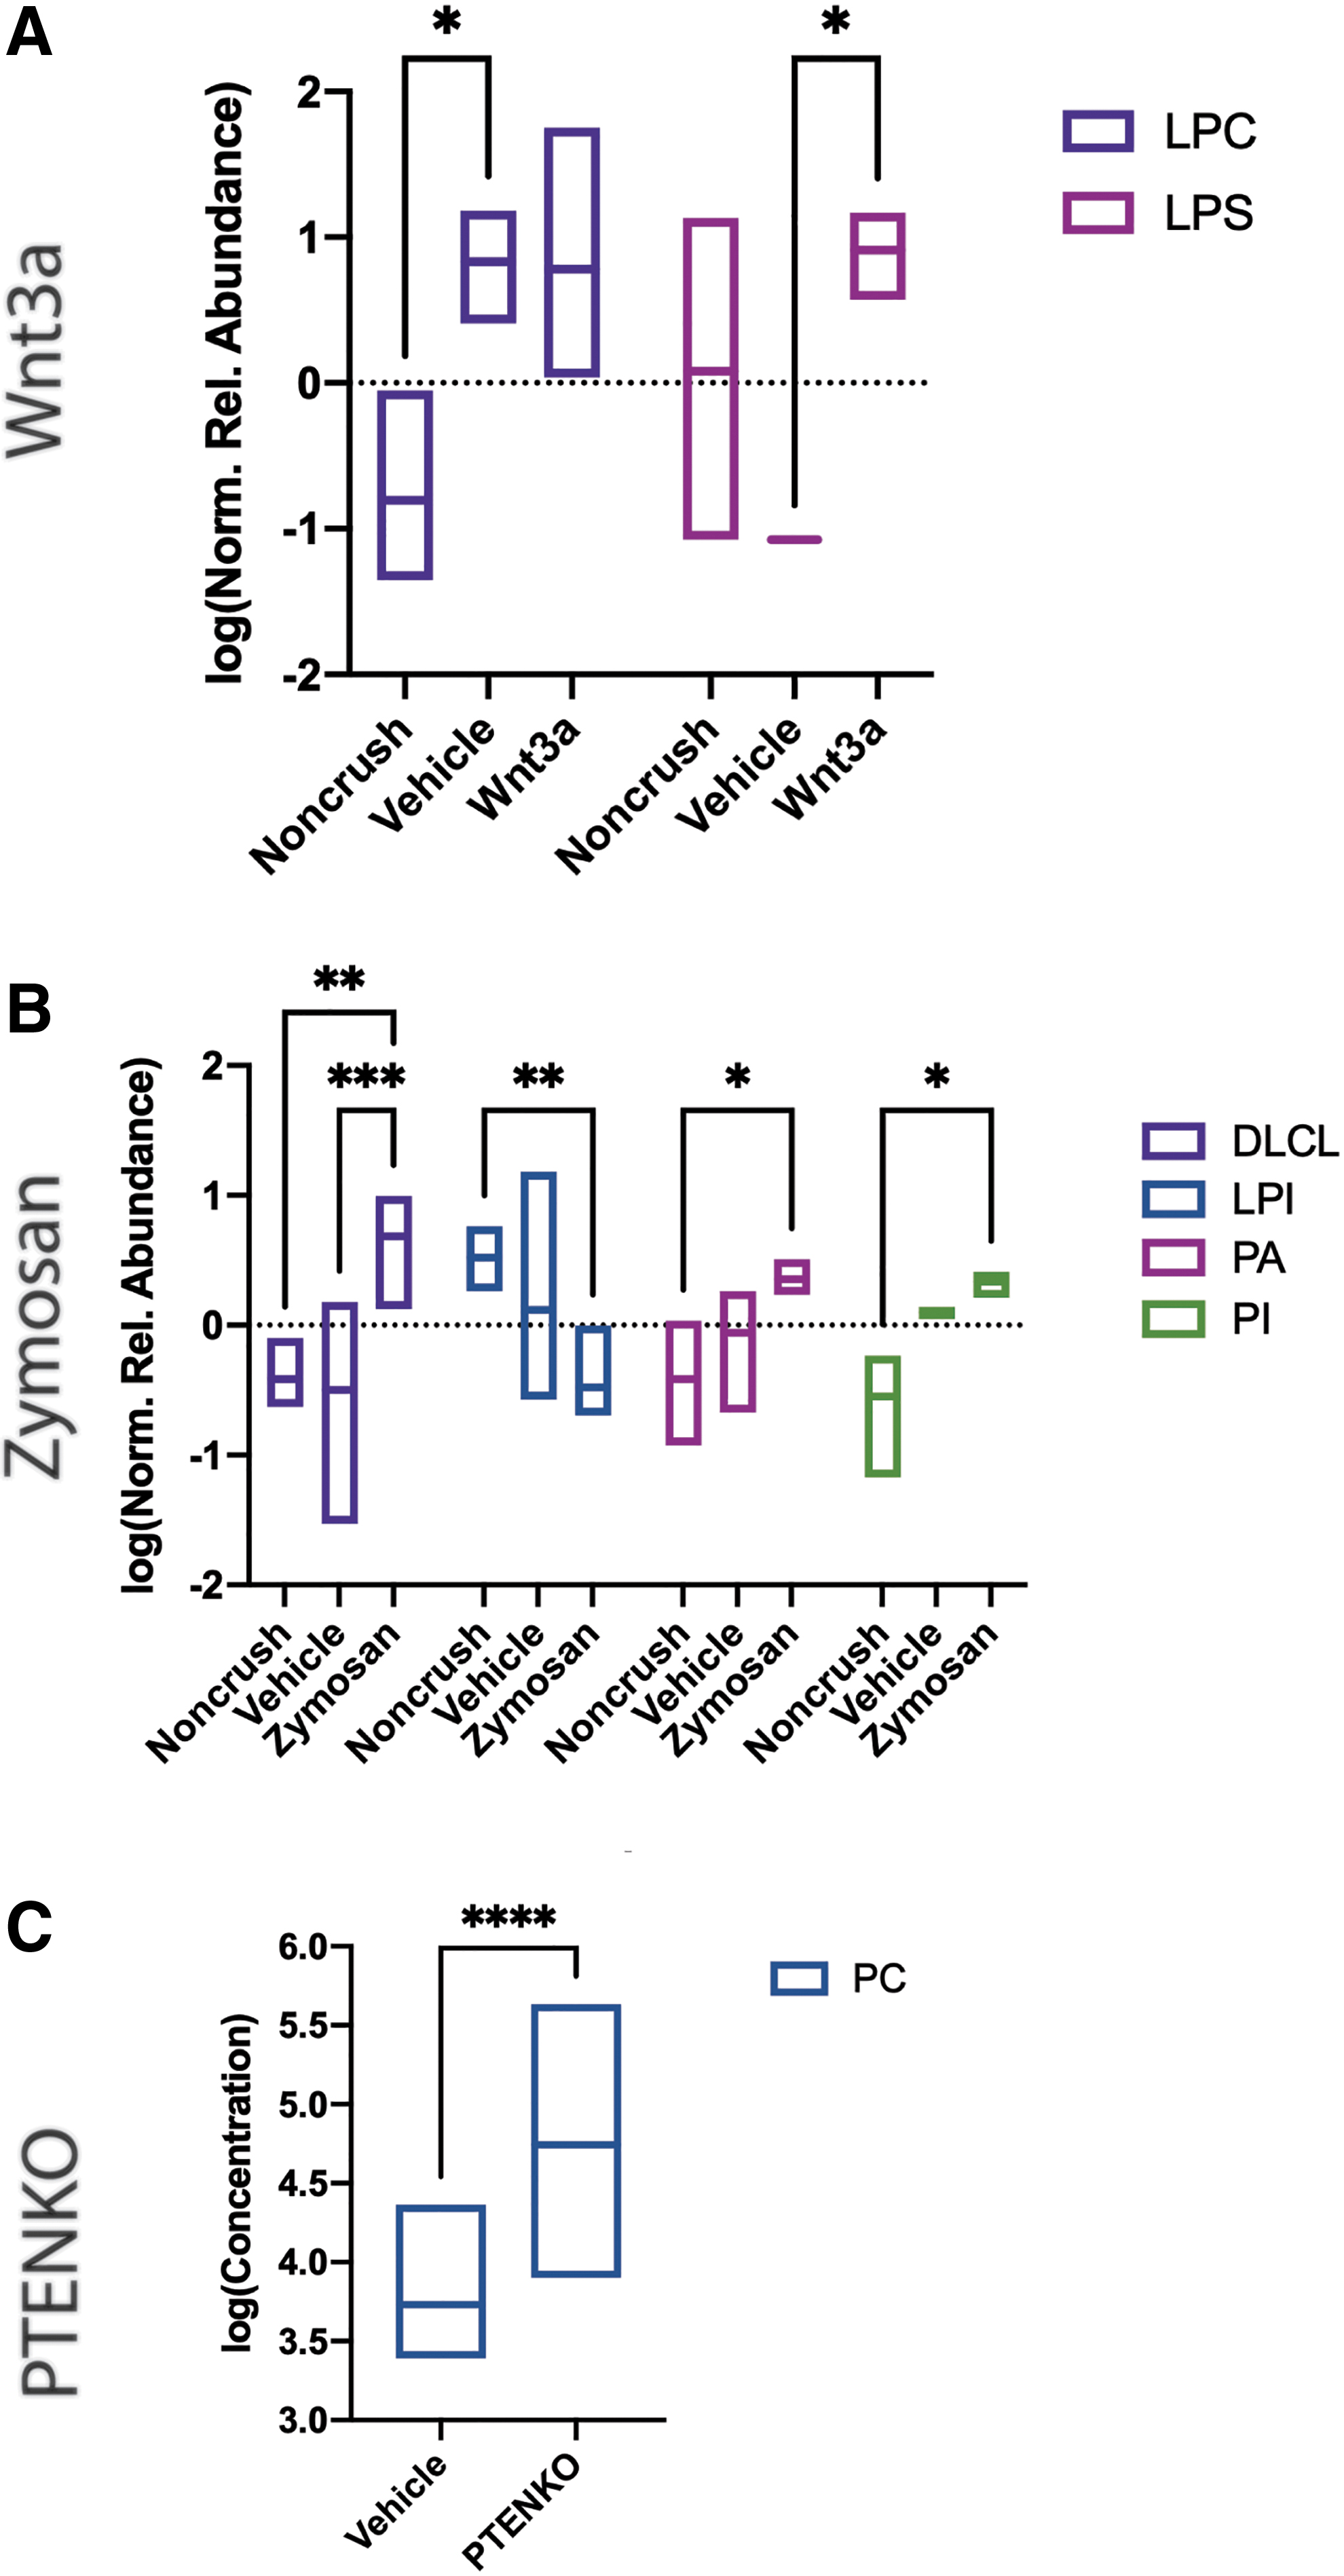
Significant Glycerophospholipid Classes at 14 dpc.
Lipid class analysis shows no consensus between all three models. At 7 dpc, Wnt3a and Zymosan share decreased PE, which is likely a regenerative response. In contrast, lysoglycerophospholipids appear to increase at 7 dpc in response to injury and may increase or decrease depending on regenerative treatments at 14 dpc. All other glycerophospholipid shifts likely attribute to their specific treatments.
Varied significant glycerophospholipid species in ON regenerative models
Evaluating glycerophospholipids at the species level will provide insights into the shifts in glycerophospholipid acyl chain lengths, saturation, and acyl-bond linkages. These characteristics play a role in membrane physical properties. Longer acyl chains increase membrane thickness and lipid packing. More unsaturation, specifically in cis positions, increases membrane disorder and fluidity. Acyl-bond linkages can be either ester or ether linkages. Ether-linked lipids can act as antioxidants and protect against lipid peroxidation.23,24 Figure 4 shows the total number of increased and decreased glycerophospholipid species per regenerative treatment. Overall, the Zymosan samples have the highest number of shifted glycerophospholipids. This could be attributed to the larger Fischer rat tissue sample compared with the mouse. PTENKO shows most significant shift lipid species at 7 dpc. No shared significant glycerophospholipid species existed between the three models. However, Zymosan and Wnt3a share significantly upregulated, injury response PG(22:6/22:6) at 14 dpc, previously identified in neuronal degeneration. 25
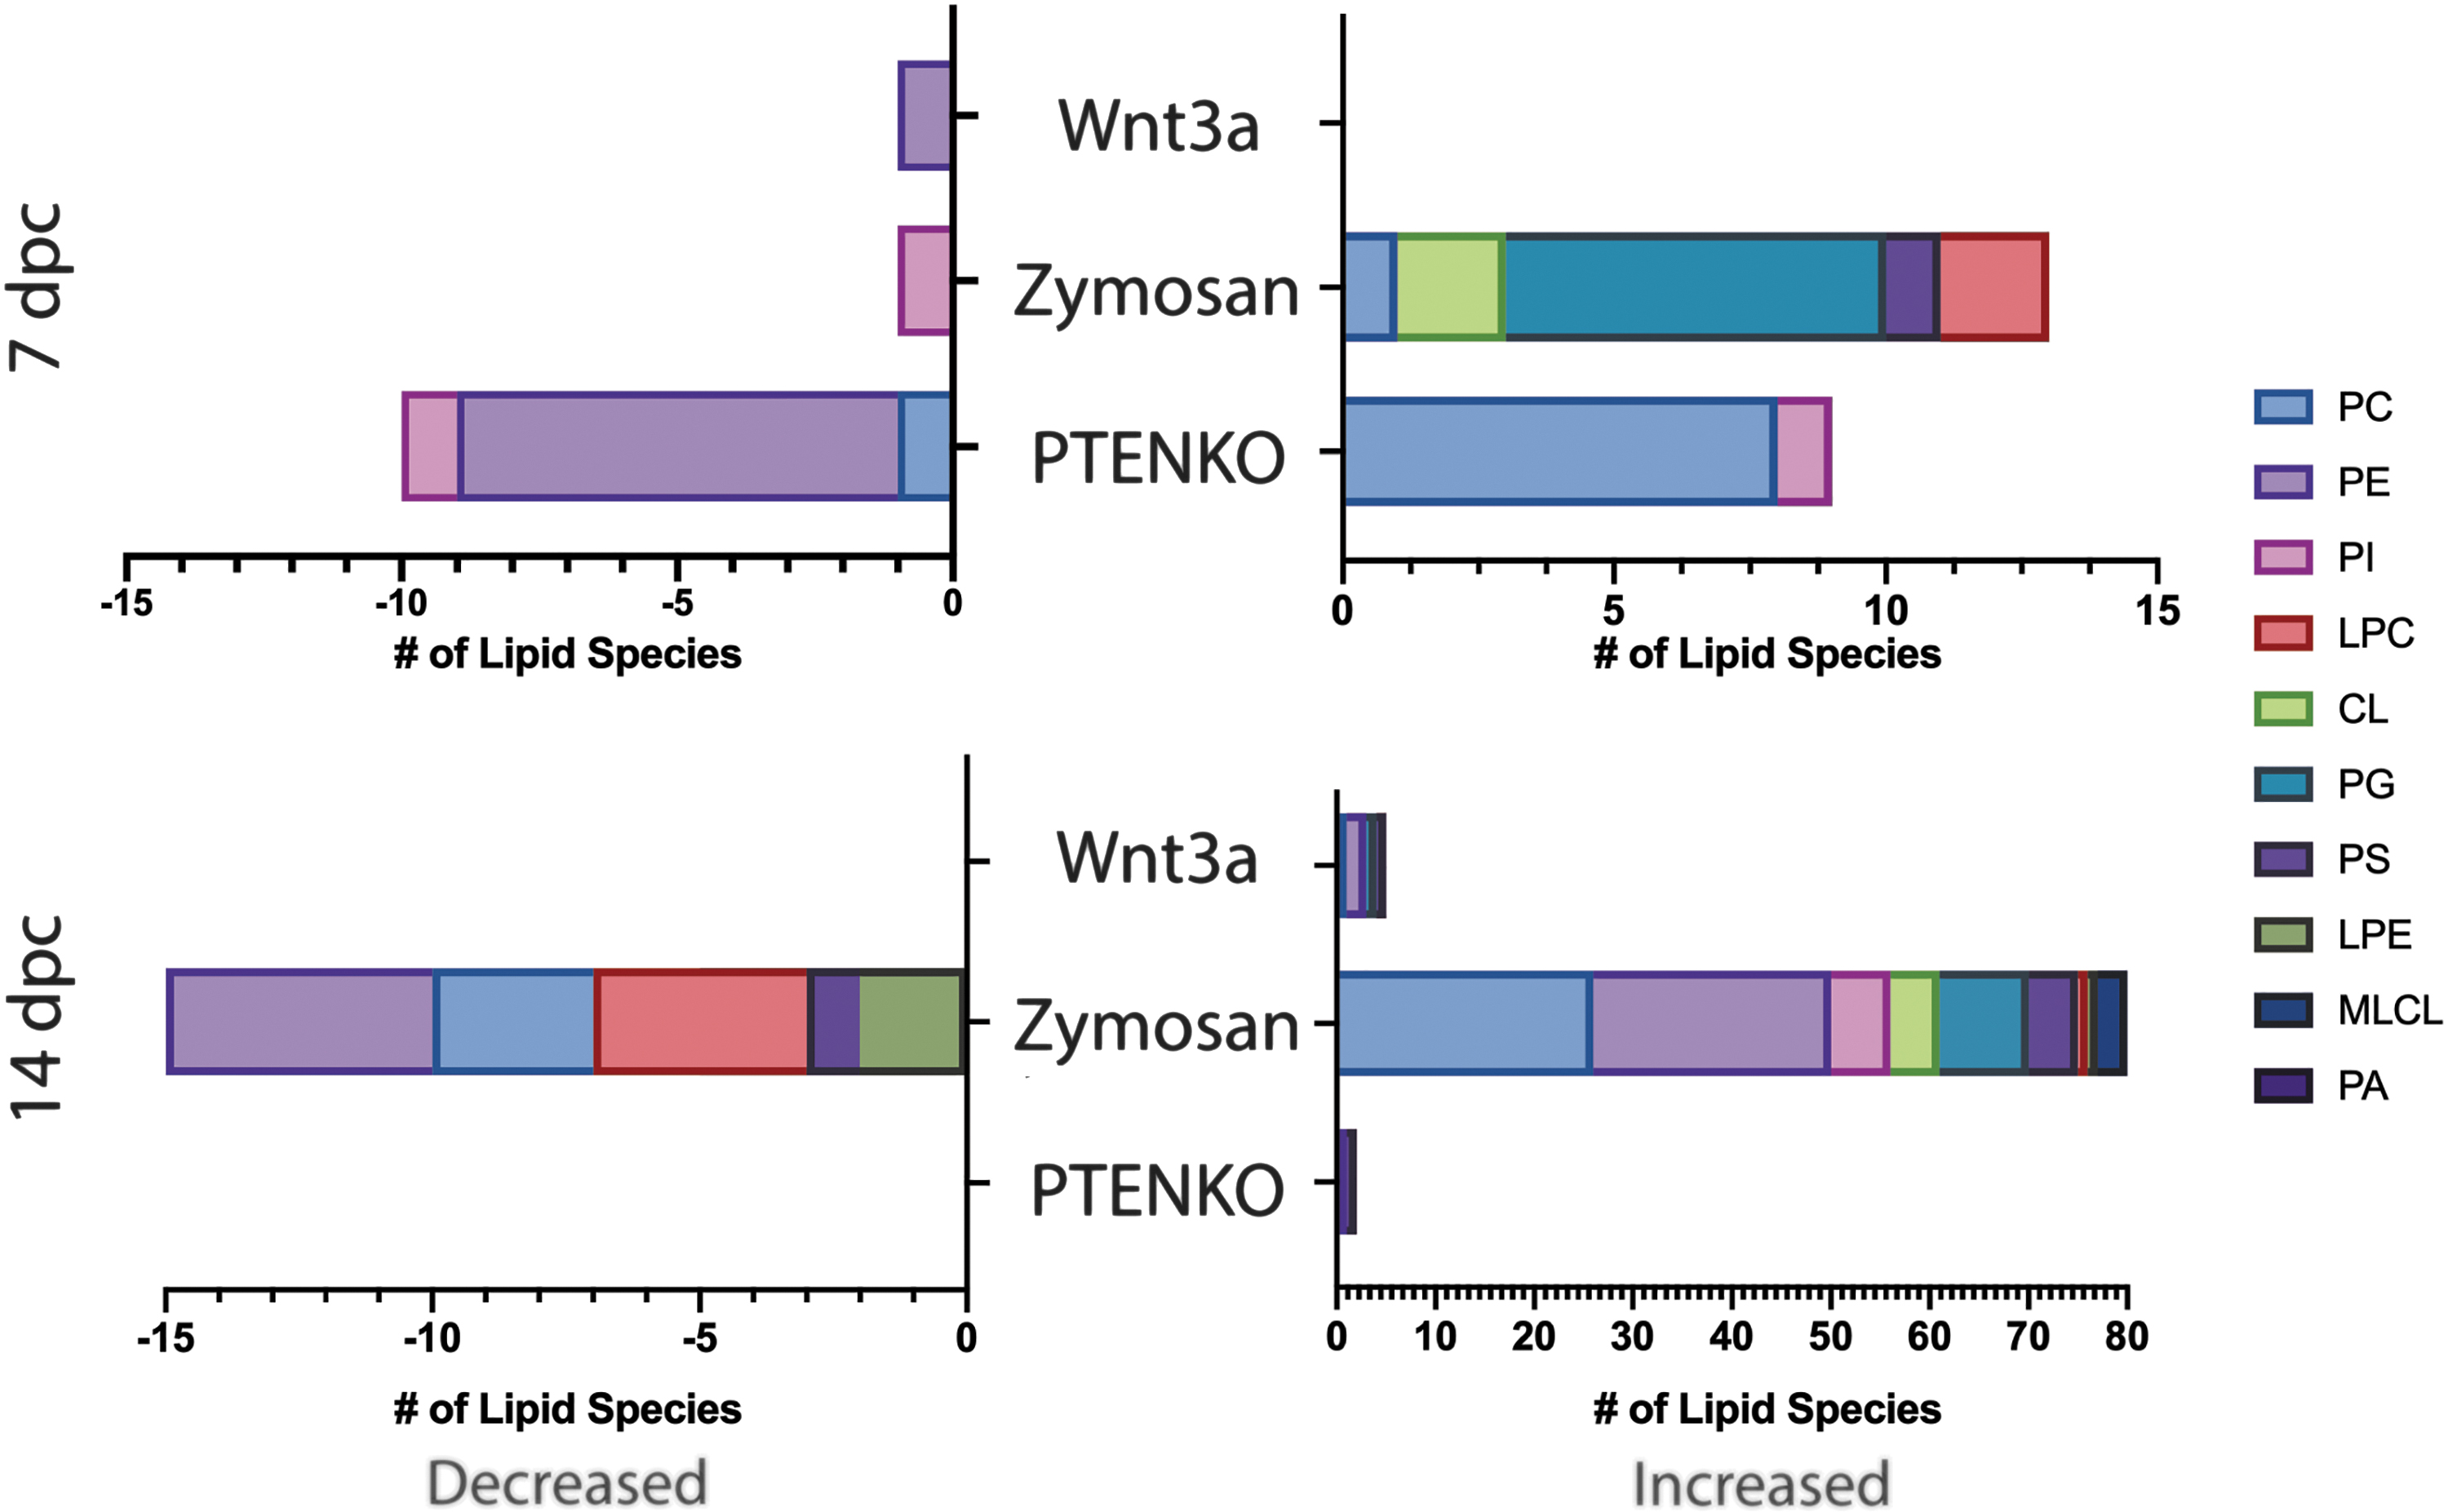
Total Significant Glycerophospholipid species at 7 dpc and 14 dpc. Bar graphs of significantly increased (right bar graphs) and decreased glycerophospholipids (left bar graphs) between regenerative treatments at 7 dpc (top) and 14 dpc (bottom). The legend displays associated colors and lipid class. All significant lipids had an FDR q value <0.05. FDR, false discovery rate.
In Figs. 5 and 6, significant lipid species are further classified as regenerative, injury response, or indeterminate based on the definitions stated above. PTENKO lipid profiles lacked a contralateral noncrush control at each time point. Nonetheless, the shifts are regenerative as they significantly differ from the vehicle treatment.
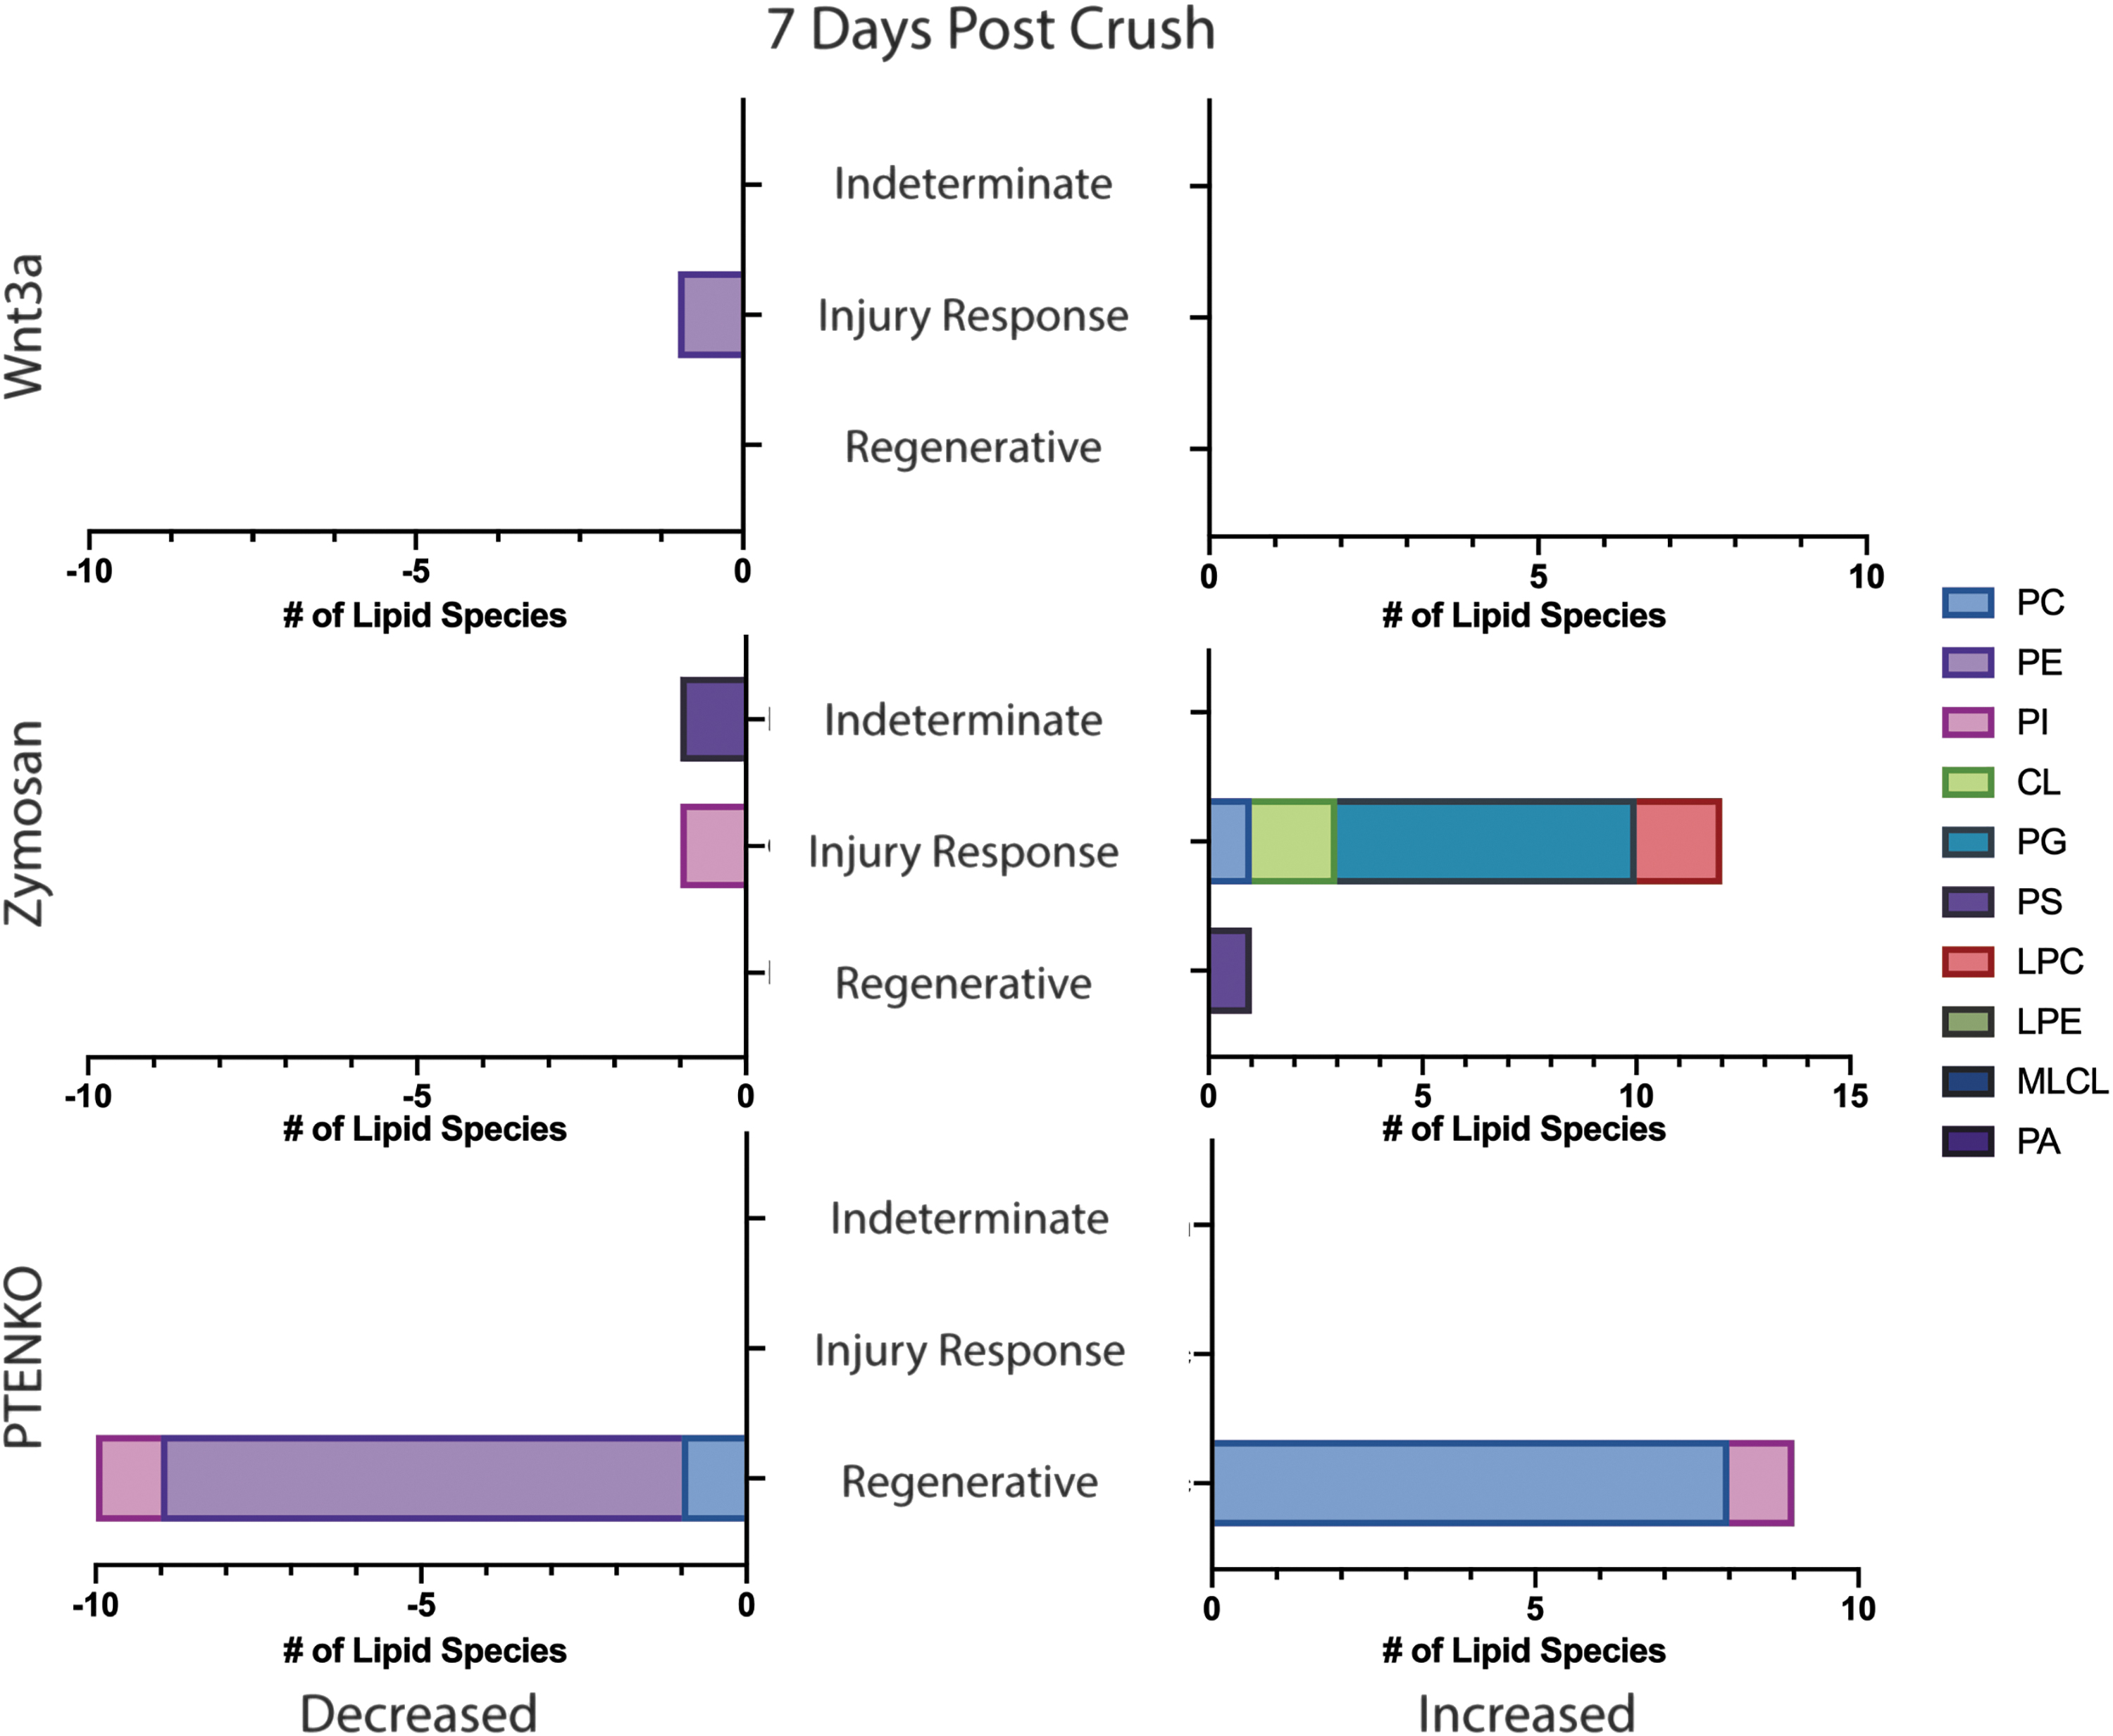
Classification of Significantly Shifted Glycerophospholipid Species at 7 dpc. Bar graphs depicting each regenerative factor (Wnt3a, Zymosan, PTENKO) and associated glycerophospholipid species shifts at 7 dpc. Increased lipids are on the right bar graph and decreased are on the left. Lipid species are categorized as “Indeterminate,” “Injury Response,” and “Regenerative.” Categories are defined in the result section's first paragraph. The legend displays lipid classes and associated colors.
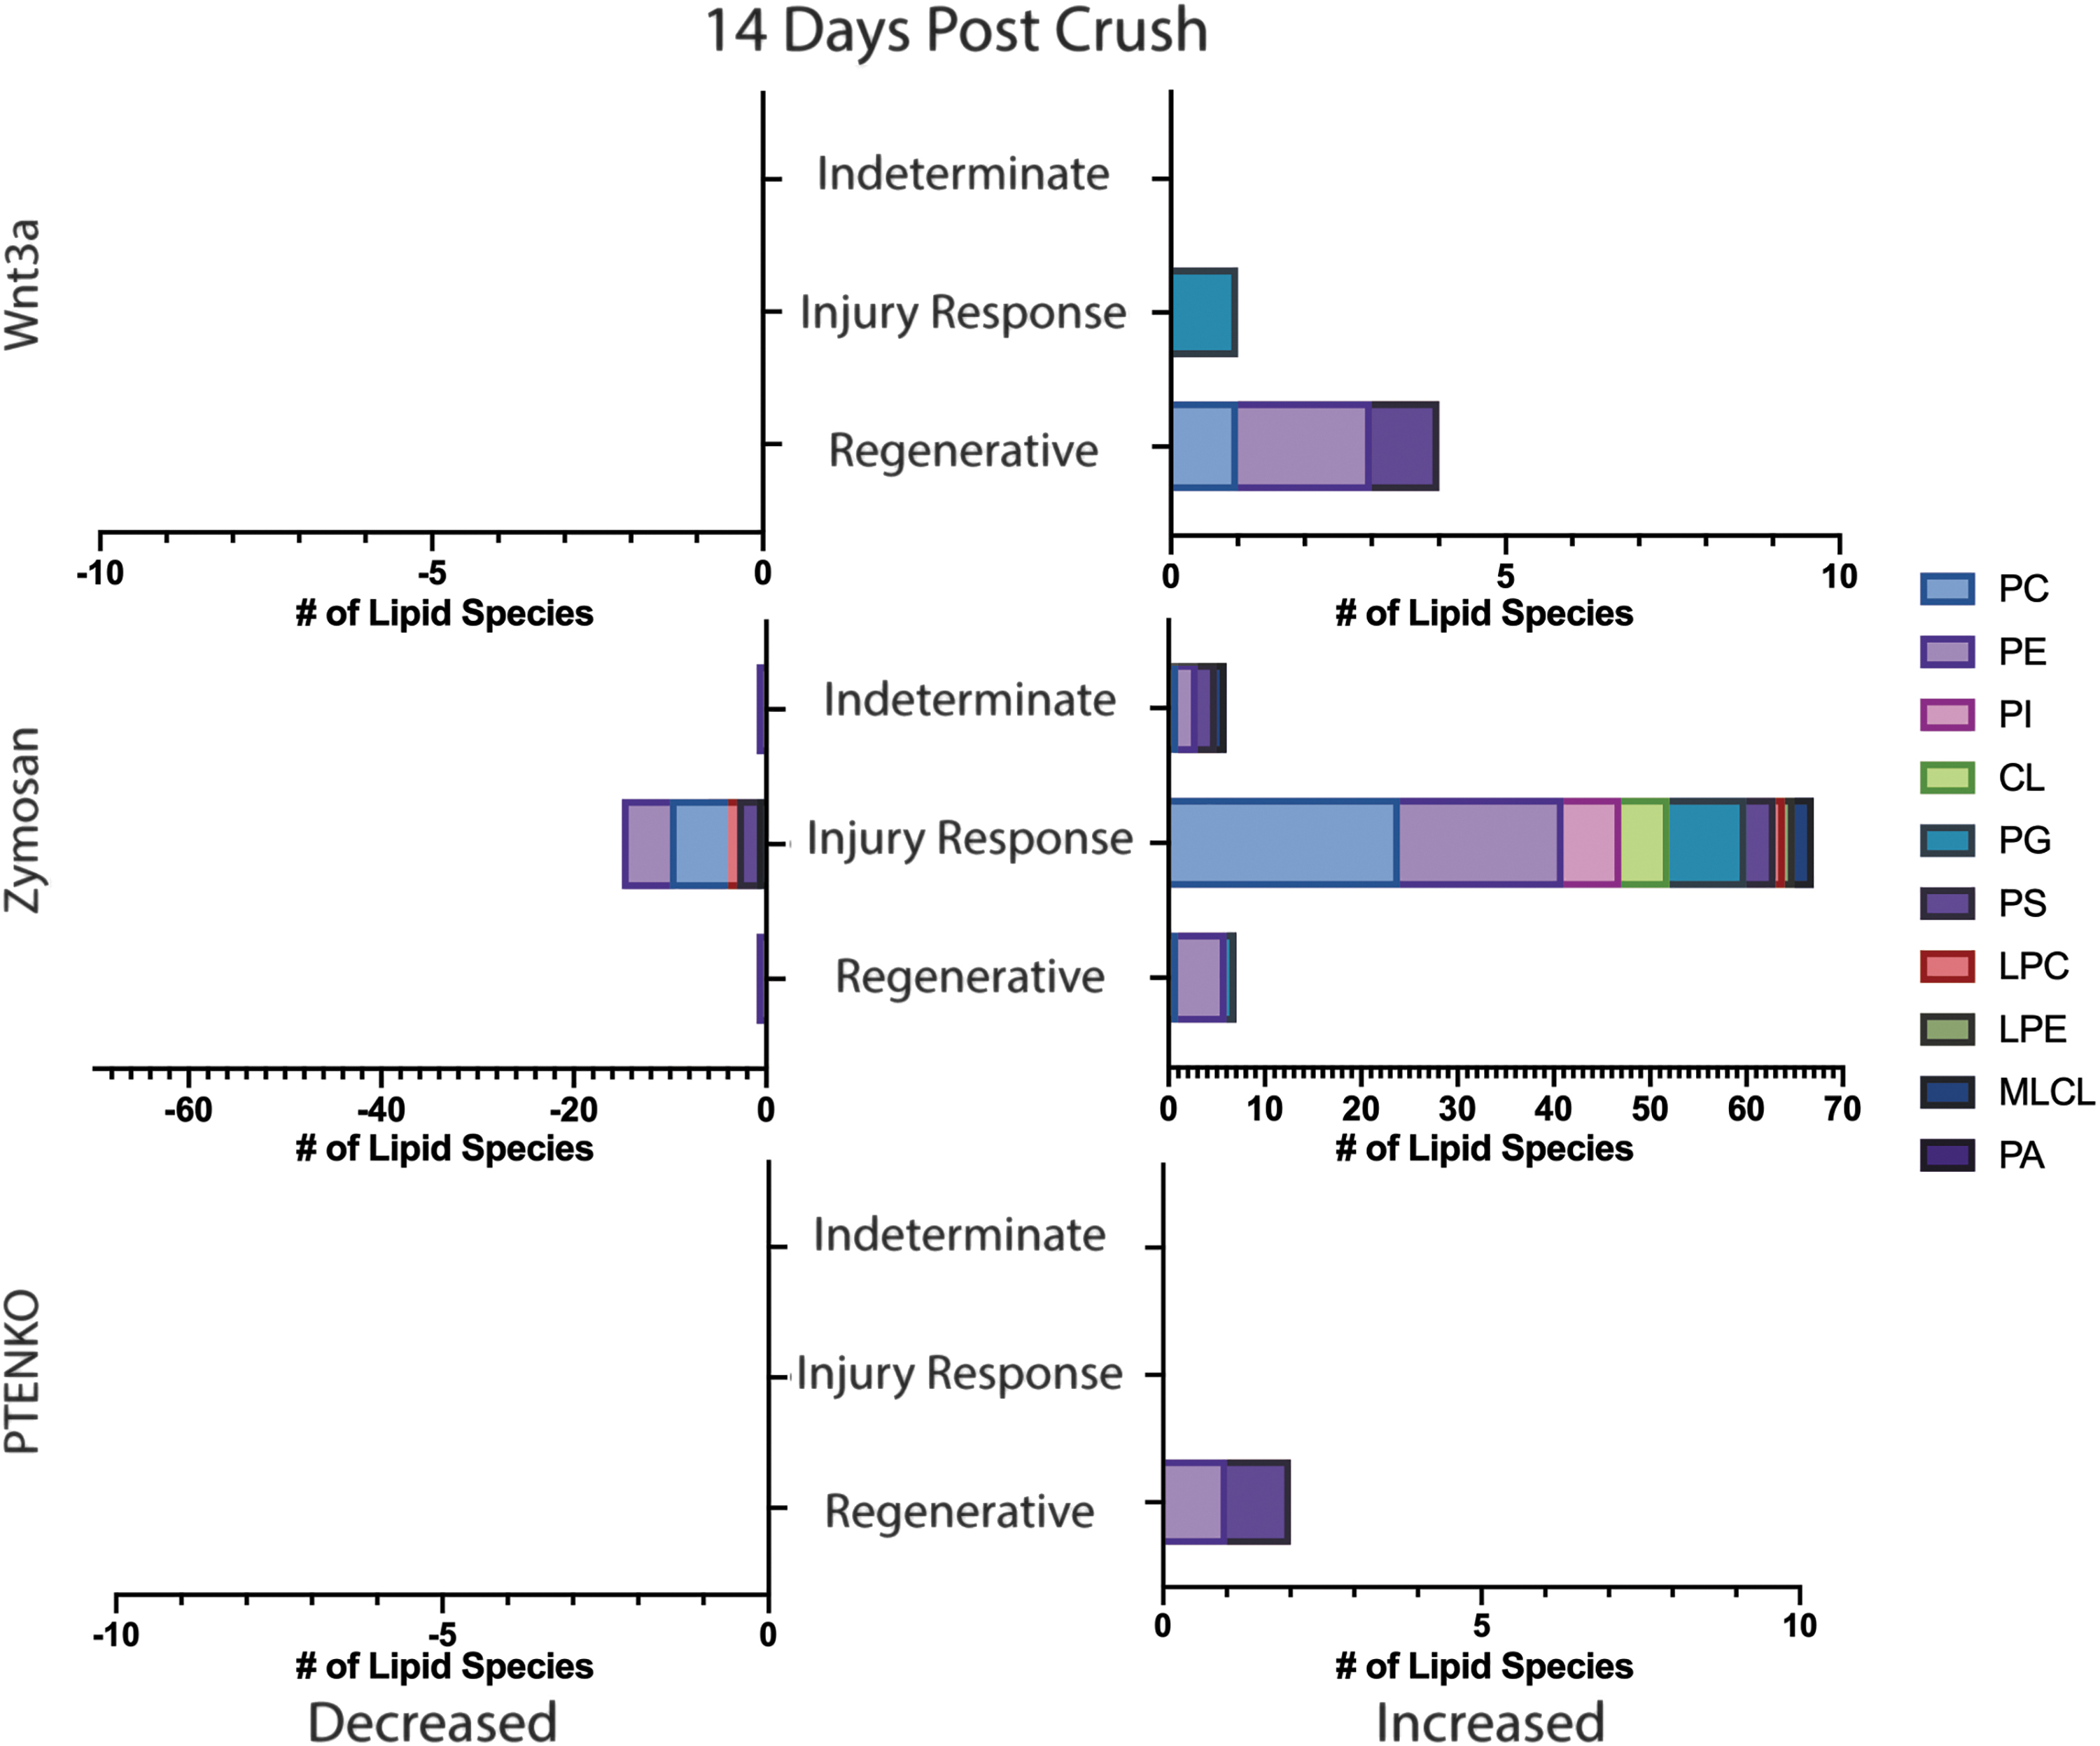
Classification of Significantly Shifted Glycerophospholipid Species at 14 dpc. Bar graphs depicting each regenerative factor (Wnt3a, Zymosan, PTENKO) and associated glycerophospholipid species shifts at 14 dpc. Increased lipids are on the right bar graph and decreased are on the left. Lipid species are categorized as “Indeterminate,” “Injury Response,” and “Regenerative.” Categories are defined in the result section's first paragraph. The legend displays lipid classes and associated colors.
At 7 dpc, Zymosan and Wnt3a provided less insight while PTENKO provided the most in terms of regenerative species. Zymosan has a single increased regenerative specie, PS(42:3), a precursor to mitochondrial PE synthesis. Wnt3a showed no regenerative species. PTENKO shows significant increases in 8 PC species [PC(14:0e/18:1); PC(16:2e/18:1); PC(17:0/20:3); PC(17:1/22:6); PC(18:1/24:1); PC(18:3e/20:1); PC(19:1/20:3); PC(26:1/18:1)]. These PC species have long (13–21 carbons) and very long (>21 carbons) acyl chains with variable saturation levels and acyl linkages. These species suggest increased neutral curvature PC species promoting membrane thickness, and lipid packing is regenerative. PTENKO display decreases in 8 PE species [PE(16:0p/22:4); PE(18:1/22:4); PE(18:1e/16:0); PE(18:1e/20:5); PE(20:0/20:0); PE(20:0e/18:1); PE(20:0p/22:6); PE(34:1/18:1)]. Interestingly, we again see that decreased PE species is regenerative at 7 dpc. PTENKO shows decreased PE species that are long and very long acyl chain lengths with variable saturation levels and acyl linkages.
PE is a negative intrinsic curvature lipid that with increasing unsaturation can induce a nonlamellar structure. PTENKO ONs prefer neutral over negative intrinsic curvature lipids for regeneration at 7 dpc.
At 14 dpc, there were no matched significant lipid species between all three treatments. PTENKO showed significantly increased PE(16:1/22:6) and PS(18:2/22:6). Zymosan has 7 increased regenerative species (PC(37:2e); PE(18:2e/24:1); PE(18:1/23:1); PE(18:1e/24:1); PE(18:2e/22:2); PE(39:2e); PG(18:0/18:1)) and 3 decreased regenerative species [PE(24:1/20:4); LPC(18:0); MLCL(49:5)]. Wnt3a had 4 increased regenerative species [PE(18:1e/22:4); PC(14:1e/20:4); PE(22:1/14:2); PS(40:2e)]. At 14 dpc, there is a consensus of multiple PE, PS, and PC species upregulated in regeneration. PTENKO and Wnt3a share increases in PE, PC, and PS species containing polyunsaturated fatty acids [docosahexaenoic acid (22:6), arachidonic acid (20:4), and adrenic acid (22:4)]. Zymosan shows increased single or two double-bond fatty acids with long or very long chain lengths. Polyunsaturation differences indicate different prioritized lipid packing and membrane fluidity. Interestingly, Zymosan and Wnt3a show increases in ether-linked species while PTENKO does not.
Ether-linked lipids are synthesized within peroxisomes while other linkages are primarily synthesized in the endoplasmic reticulum. Prioritization of ether linkages suggest different lipid metabolic pathways for Zymosan/Wnt3a and PTENKO.
Overall, shifts in PE, PS, and PC species are consistent in each regenerative group. PC species are consistently upregulated from 7 to 14 dpc, whereas PE lipids are first downregulated at 7 dpc and upregulated at 14 dpc. PTENKO and Wnt3a show preference of polyunsaturated fatty acid lipids while Zymosan shows increased saturation. The lack of shared specific species between all groups could be attributed to the differences in each regenerative treatment. Further evaluation of lipid profiles on an ontological level may provide a different insight into characteristics prioritized in regeneration.
Lipid ontological analysis finds similar properties at 7 dpc but divergence at 14 dpc
LION analysis provides a unique perspective on lipid chemical and physical properties incorporating a similar analysis as Gene Ontology. LION categorizes lipids based on acyl chain lengths, saturation, transition temperature, layer thickness, intrinsic curvature, and signaling. Lipid species and corresponding ontological properties are ranked by p-value. Each regenerative factor was compared to its corresponding vehicle group to gather a list of significantly up and downregulated properties (Supplementary Data). These properties were crossreferenced, resulting in Figs. 7 and 8. The regenerative groups shared more ontological properties at 7 dpc compared with 14 dpc. This may be due to the regenerative capacity of each treatment. PTENKO and Zymosan have shown robust regeneration and are well-established models. Based on relative axonal growth at 14 dpc, Wnt3a shows weaker overall regenerative capacity.3,4,6

Shared Up and Downregulated LION Properties at 7 dpc. Common significantly upregulated (top boxes) and downregulated (bottom boxes) LION properties between PTENKO, Zymosan, and Wnt3a. The downregulated LION properties share a common property indicated by the black arrows and the final box. All significant LION properties had an FDR q value <0.05. LION, Lipid Ontology.
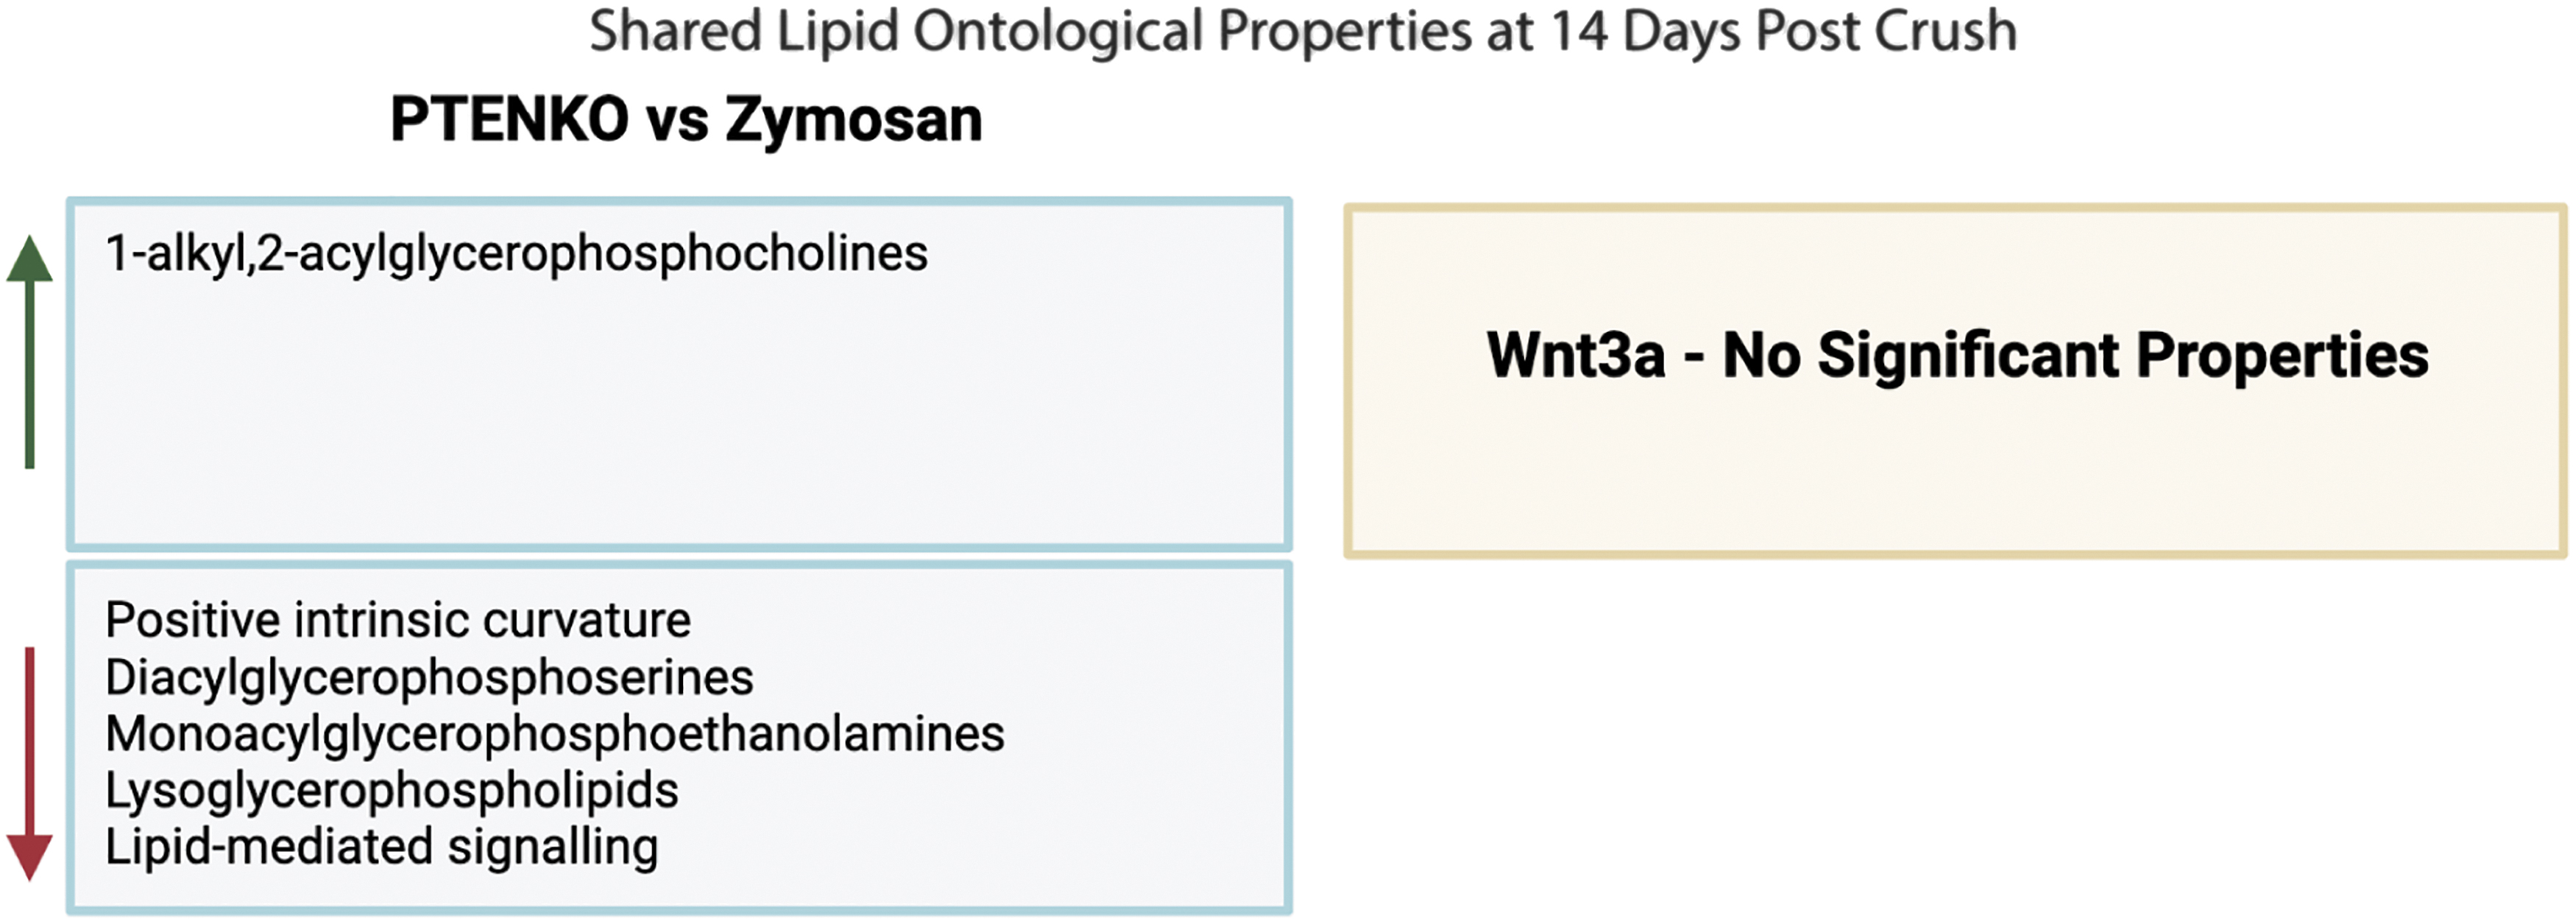
Shared Up and Downregulated LION Properties at 14 dpc. Common significantly upregulated (top boxes) and downregulated (bottom boxes) LION properties between PTENKO, Zymosan, and Wnt3a. No significant properties were found for Wnt3a at 14 dpc. All significant LION properties had an FDR q value <0.05.
At 7 dpc, the regenerative groups show increased LPE, lipid-mediated signaling, and lysoglycerophospholipids. Interestingly, Zymosan and Wnt3a share additional upregulated PGs. For downregulated properties, all three regenerative groups share decreased negative intrinsic curvature. This is further supported as all three groups show decreased PE-related lipids that make up the negative intrinsic curvature ontological property (Fig. 7). It can be speculated that PE was deacylated, resulting in the increased LPE; however, the shift has not been quantified, and further enzymatic analysis is necessary. Some downregulated properties are associated with plasmalogens (vinyl ether linkages). Plasmalogens are one of the major components of myelin and can regulate the initial axon segment involved in neuron excitability and plasticity.26,27 The demyelination process is likely a significant source of decreased vinyl ether PE species. At 14 dpc, ontological properties appear to diverge between the regenerative groups. Zymosan and PTENKO share some properties, whereas Wnt3a had no significant properties (Fig. 8).
PTENKO and Zymosan show increased 1-alkyl,2-acylglycerophosphocholine and decreased PS, LPE, lysoglycerophospholipids, positive intrinsic curvature, and lipid-mediated signaling.
LPC decreases inner membrane order of neuroblastoma cells
To understand how these lipidomic shifts affect neuronal membrane order, exogenous lipids of different intrinsic curvatures were given to neuroblastoma SH-SY5Y cells. SH-SY5Y is a stable neuronal line with short neurites that does not require additional supplementation. These cells can be differentiated into a neuronal–axonal phenotype; however, in this study, we want to establish lipid order effects without confounding variables from supplementation. This neuroblastoma cell line has an established phospholipidome 28 and been used for multiple lipid studies.29–32 Exogenous lipid studies using fluorescent nitrobenzoxadiazole (NBD) lipids show lipid internalization within 30 min of initial exposure followed by a decline over 4 h after exposure.33,34 Using our lipid loading/staining procedure, we found extensive lipid loading at the time of imaging using neuroblastoma cells and NBD lipids (Supplementary Fig. S1). No fluorescent lysoglycerophospholipids are currently available but similar timescales have been used to study its cellular effects. 35
The neuroblastoma cells were exposed to lipid-containing media: 10 μM of 16:1/16:1 PC (neutral), 18:1/18:1 PE (negative curvature), or 16:0 LPC (positive curvature) for 2 h. Membrane order was visualized using a C-Laurdan dye, a lipophilic dye excited by a single wavelength photon but emits in two wavelength ranges depending on dye–membrane permeability and membrane order.19,20 Ratiometric measurements or GP values between the two emission channels were generated using published methods. 21 GP values can be compared by mean GP values, overall GP Distribution, and GP Images. After LPC exposure, neuroblastoma cells show a significant decrease in the mean GP value and leftward shift in GP distribution indicated decreased membrane order (Fig. 9B, C). Exogenous PC and PE resulted in no significant shifts of mean GP value or distribution. The PE group was trending higher in GP values. Evaluation of HSB and GP images demonstrate that LPC decreases in internal membrane order (Fig. 9A). These experiments indicate that lysoglycerophospholipids have a greater capacity at shifting membrane order compared with PC and PE.
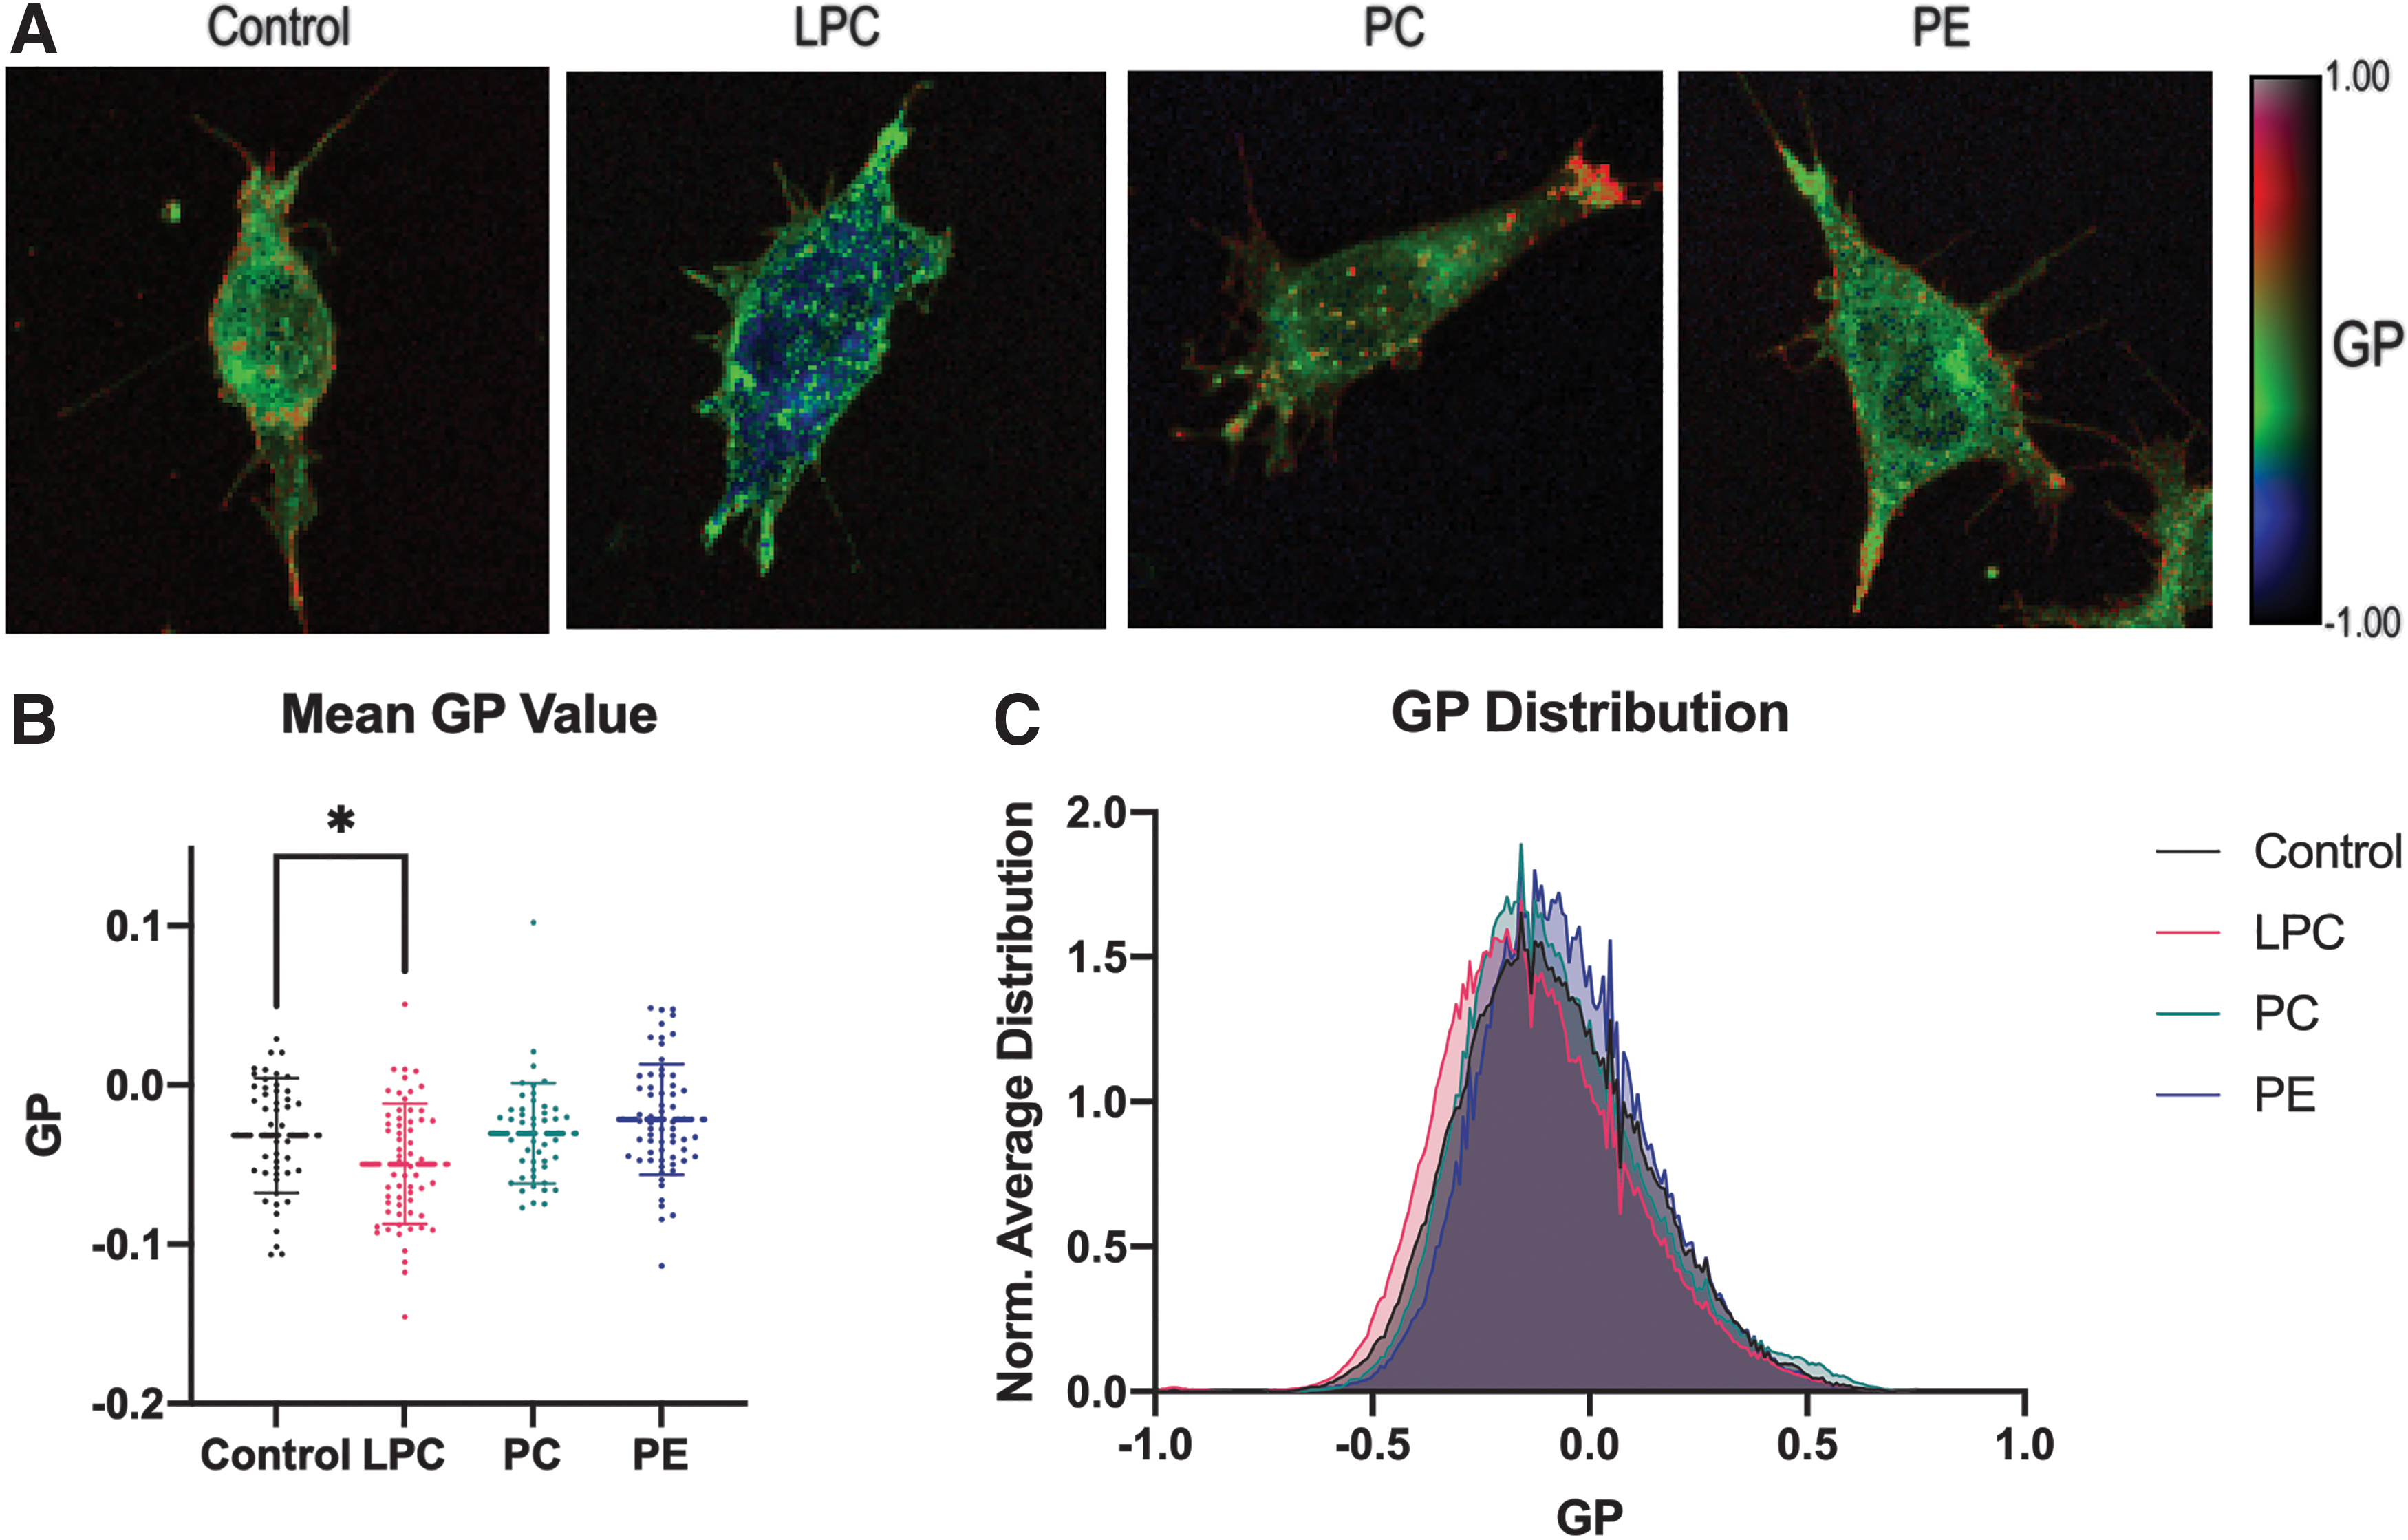
Membrane Order shift in Response to Lipids in vitro. C-Laurdan-stained SH-SHY5Y Neuroblastoma cells show shifts in membrane order after lipid exposure.
Discussion
We performed an analysis of glycerophospholipid profiles from three regenerative models using Metaboanalyst and LION software. Significantly shifted glycerophospholipid classes, glycerophospholipid species, and ontological properties were identified and crossreferenced between regenerative treatments. Each analysis type provided unique perspectives for data interpretation. The Wnt3a and Zymosan datasets had similar sizes (n = 3, 4), whereas the PTENKO had a larger size of n = 12. The Zymosan model has the highest quantity of significant lipid species, but this may be attributed to the larger rat tissue size increasing total lipid yield and sensitivity.
In neurons, Wnt3a, Zymosan, and PTENKO (mTOR) pathways and glycerophospholipid synthesis have not been thoroughly studied. Wnt3a has shown effects in plasma triglyceride levels but no specifics on glycerophospholipid synthesis. 36 Zymosan causes lipid acyl remodeling in macrophages in vitro. Specifically, zymosan reduced arachidonic acid (20:4) in glycerophospholipid classes (PC, PI, and PG) and a potential incorporation of oleic acid (18:1).37–39 Based on this study's lipid analysis, Zymosan significant lipids did show a decreased arachidonic PE specie and increased 18:1 PE and PG species at 14 dpc. Zymosan may have stimulated local retinal lipid remodeling displaying changes in distal axonal lipids. This may explain the discrepancy between Zymosan and Wnt3a/PTENKO's prioritized polyunsaturated fatty acids at 14 dpc. PTENKO (mTOR activation) shows increased reliance on ER-based PC and PE synthesis for ON regeneration. 40
Similar findings in other tissues show that mTOR activation increases phospholipid synthesis and mTOR can be activated by phospholipid precursor (PA).41,42 The complete details of acyl chain lengths and saturation levels have not been studied. These previous studies agree with this study's finding where PTENKO regeneration causes significant changes in PC and PE species.
Overall, the regenerative models have higher similarities at 7 dpc compared with 14 dpc. At 7 dpc, increased lysoglycerophospholipids at the lipid class, specie, and ontological levels were associated with injury response. Membrane order analysis suggests lysoglycerophospholipids may significantly decrease internal neuronal membrane order. Lysoglycerophospholipids also have signaling capabilities that can lead to secondary effects, such as calcium influx.35,43 Further analysis will be necessary to evaluate the source of the membrane order changes. By 14 dpc, higher regenerative treatments (Zymosan and PTENKO) reduce lysoglycerophospholipids, which may be a crucial step for successful regeneration.
A common regenerative motif is decreased PE at 7 dpc. This is confirmed by the shared downregulated negative intrinsic curvature property at 7 dpc. Some of the decreased properties are associated with vinyl ether bonds or plasmalogens, which are a major myelin lipid component. 26 Demyelination is natural after neuronal injury 44 and myelin lipids can inhibit axon regeneration. 45 Decreasing tissue plasmalogens would support axonal growth and may be an effect of regenerative treatments. Contrastingly, at 14 dpc, there are regenerative increases in PC, PE, PI, and PS species. PC, PI, and PS are neutral intrinsic curvature lipids, whereas PE is a negative intrinsic curvature lipid. PC and PE synthesis genes, such as Pcyt1, Pcyt2, and Chka/b, were found to be indispensable for axon regeneration. 40 Intuitively, an efficiently growing axon would require neutral curvature lipids to support a lamellar structure. However, exogenous PC and PE did not have significant impacts on membrane order. This is unexpected for PE as it is considered a negative intrinsic curvature lipid. Other PE species should be further evaluated based on polyunsaturation and acyl linkage to identify any unique membrane order shifts.
This study is limited by full tissue analysis as lipids can be sourced from fractionated neuroglia, and degenerating and regenerating axons. However, a vehicle+crush control is used to control for lipidomic-inflammatory shifts from the injection and crush surgery. Regenerative treatments are localized to the eye's posterior chamber where the RGCs are the first contact layer and result in distal lipidomic shifts of ON-residing axons. Lipidomic shifts seen, especially decreased lipids at 7 dpc, may be a result of neuroglia and macrophages cleaning up debris after ON crush and demyelination. 46 Lysoglycerophospholipids can be created by any cell and act as a paracrine signal to other tissue-residing cells/axons. 47 Increased lipidomic shifts at the 14 dpc are more likely associated with axonal growth as the inflammatory response has significantly subsided. Cellular fractionated lipidomics should be pursued to find the cellular source of lipid shifts. At present, there is lack of tissue-level lipidome for crush versus regeneration studies. Fractionated cells have disadvantages of changes in lipidome in nontissue environments and miss secretome lipid information. Tissue-level lipidome is a reference point for further future analyses and better understanding.
Moving forward, plasmalogens, PE, lysoglycerophospholipids, and PC should be targeted in regenerative lipid metabolism as they are consistently shifting in each model. This will help narrow down which acyl chains, saturation, and acyl linkages are most impactful. The development of fractionation methods for cellular lipids is essential to further understanding these lipidomic shifts.
Conclusion
We characterize glycerophospholipid shifts between three regenerative models. Earlier time points show more similarities, while later time points have higher divergence potentially associated with the regenerative factors' signaling. Lysoglycerophospholipids increase at 7 dpc across all models and decrease in PTENKO and Zymosan by 14 dpc. The increase of lysoglycerophospholipids seen after injury likely reduces membrane order. In regeneration, PE and negative intrinsic curvature lipids decreased at 7 dpc but increased at 14 dpc. PTENKO and Zymosan share increased 1-alkyl,2-acylglycerophosphocholine and decreased PS at 14 dpc. The combined use of Metaboanalyst 5.0 and LION software provides an overall fuller lipidomic picture interpretable at multiple levels. Most significant lipid species were injury response, but multiple PS, PE, PC, and PG species were identified as regenerative. PC-PE-PS is a well-known lipid metabolic axis that is essential in axon regeneration. Future studies to understand how neurons respond to inflammatory/injury lipidomic shifts natively and with regenerative treatments will narrow down which lipid metabolic pathways to prioritize for therapeutic development.
Footnotes
Acknowledgments
The authors acknowledge Bascom Palmer Eye Institute and Metabolomics Workbench for providing the resources, lipidomics datasets, and environment to support this publication. They acknowledge LION and Metaboanalyst for providing free, online software supporting this data analysis.
Authors' Contributions
S.D.M.: Conceptualization, Data curation, Formal Analysis, Methodology, Visualization, Writing (Reviewing/Editing, Original Draft), and Investigation. E.N.: Formal Analysis and Investigation. S.K.B.: Funding Acquisition, Conceptualization, Resources, Writing (Review/Editing), and Supervision.
Author Disclosure Statement
The authors declare that they have no known competing financial interests or personal relationships influencing the work reported in this article.
Funding Information
This work was supported in part by US Department of Defense Grant W81XWH1910845, NIH Grant U01EY027257, NIH Center Core Grant P30EY014801, an unrestricted grant from Research to Prevent Blindness to the Bascom Palmer Eye Institute. Metabolomics workbench is an effort of NIH Common Fund's Metabolomics Data Repository and Coordinating Center supported by U2C DK119886.

References
Supplementary Material
Please find the following supplemental material available below.
For Open Access articles published under a Creative Commons License, all supplemental material carries the same license as the article it is associated with.
For non-Open Access articles published, all supplemental material carries a non-exclusive license, and permission requests for re-use of supplemental material or any part of supplemental material shall be sent directly to the copyright owner as specified in the copyright notice associated with the article.
