




Abstract
Purpose:
To assess the combined effects of omidenepag (OMD), a selective EP2 agonist, and ripasudil (Rip), an inhibitor of rho-associated coiled-coil containing protein kinases, on the human orbital adipose tissue, two-dimensional (2D) or three-dimensional (3D) cultures of human orbital fibroblasts (HOFs) were employed.
Methods:
Cellular metabolic functions (2D), physical (3D), lipid staining (3D), and quantitative polymerase chain reaction for adipogenesis-related genes, PPARγ and AP2, and extracellular matrix (ECM) molecules, including collagen (COL)1, 4, and 6, and fibronectin (FN) (3D) were evaluated in the presence of OMD (100 nM) and/or Rip (10 μM).
Results:
Real-time metabolic analyses revealed that the adipogenic differentiation (DIF+) with OMD significantly shifted an energetic state toward energetic, whereas DIF+ with Rip significantly shifted that toward quiescent. In the case of both drugs upon DIF+, the metabolic effect of OMD was predominant. DIF+ induced enlargement and stiffed 3D spheroid with increased lipid staining and mRNA expression of adipogenesis-related genes, COL4 and COL6, and decreased the expression of COL1. In the presence of OMD and/or Rip to DIF+, (1) the sizes were further increased by Rip and the stiffness was significantly decreased by OMD or Rip and (2) COL4 or AP2 expression was substantially increased by OMD or Rip, respectively.
Conclusion:
The results presented herein indicate that the metabolic effects of OMD and Rip exerted opposing effects and the effects of OMD toward Ap2 and ECM expressions were distinct from those of Rip, but the effects of OMD toward the physical aspects and adipogenesis of the 3D cultured HOFs were similar to the effects of Rip.
Introduction
It is well known that evidence-based treatment for glaucomatous optic neuropathy requires suitable control of the intraocular pressure by administering antiglaucoma medications and/or glaucoma surgery. 1 Among these clinically available antiglaucoma instillations, as the 1st line medication, prostaglandin F2α analogs (PGF2α-ags) are frequently used, based upon their remarkable hypotensive efficacy with few systemic side effects. However, it has recently been reported that non-negligible periocular side effects termed “deepening of the upper eyelid sulcus (DUES)” and others can occur among long-term users of PGF2α-ags. 2 As possible underlying mechanism causing DUES, orbital fat atrophy induced by PGF2α-ags has been identified. 3 Subsequently, such periocular side effects caused by several instillations, especially new types of drugs, as well as various combinations thereof have attracted considerable interest from the scientific community.
To further study the molecular pathogenesis of DUES, we recently successfully established an in vitro model that replicates the pathogenesis of DUES, namely, PG induced fatty tissue atrophy, by employing three-dimensional (3D) cell cultures using 3T3-L1 preadipocytes, 4 human orbital fibroblasts (HOFs),5,6 and others. Our studies indicated that PGF2α-ags caused a significant downsizing of and stiffer 3D spheroids, and the inhibition of their adipogenesis.
Therefore, we hypothesized that our recently developed method using 3D spheroid cell cultures has the potential for serving as a powerful strategy for evaluating the influence of various drugs toward orbital adipose tissues. In fact, more recently, among 2nd and 3rd lines of antiglaucoma instillations, we also examined the drug-induced effects of Rho-associated coiled-coil containing protein kinase (ROCK) inhibitor (ROCK-i), ripasudil (Rip) hydrochloride hydrate, and a prostanoid EP2 agonist, omidenepag (OMD), employing this in vitro 3D spheroid model.
Quite interestingly and unexpectedly, Rip and OMD affected differently from that for PGF2α-ags on 3D 3T3-L1 or human orbital fibroblast (HOF) spheroids,7–10 in which an increased size, a decreased stiffness, and no suppression of adipogenesis were observed, in the presence or absence of PGF2α-ags. Based upon these collective observations that both OMD and Rip may affect the structural architecture of cells, in addition to their ocular hypotensive effects, we hypothesized that OMD may have some effects on ROCKs and other related enzymes, such as myosin light chain kinase (MYLK) and LIM domain kinase 1 (LIMK1). In fact, it was reported that EP2 signaling negatively regulates chemokine-stimulated Rho/ROCK signaling. 11
To study this possibility, we studied the synergistical effects of OMD and Rip on adipose tissue using a 2D or 3D cultured 3T3-L1 cell model, and (unexpectedly) identified simultaneous, but not simply additive, effects on their adipogenesis and structure, suggesting that some as-yet unidentified underlying mechanisms between EP2 and ROCK signaling are operative within adipocytes. 12 Furthermore, a previous study demonstrated that the physiological aspects of human orbital adiposed tissues in which adipogenesis is much poorer compared with 3T3-L1 cells, 13 the drug-induced effects toward HOFs should be distinct from those of 3T3-L1 cells.
In fact, the observed PGF2α-ags-induced efficacy on lipid metabolisms during their adipogenic differentiation was much lower compared to 3D spheroids of 3T3-L1 cells, although we also identified similar effects of PGF2α-ags on 3D HOF spheroids. 5 These collective observations suggest that an in vitro 3D HOF spheroid model, as well as the 3T3-L1 cell model, 12 should also be studied using additional cellular functional assays to completely understand the simultaneous effects of OMD and Rip on human orbital adipose tissues.
Thus, to study the synergistic effects of OMD and Rip toward human orbital fatty tissues, we utilized our recently developed in vitro 3D HOF spheroid model,4,14 as well as the conventional two-dimensional (2D) cell culture method, and investigated the following issues; (1) the inhibitory effects of OMD on several enzymes, including ROCKs, LIMK1, and MYLK (2D), and the additive effects of OMD on Rip in (2) a real-time cellular metabolic analysis by a Seahorse-Bio analyzer (2D), (3) physical aspects, size and stiffness (3D), (4) BODIPY lipid staining (3D), and (5) quantitative polymerase chain reaction (qPCR) analysis of adipogenesis-related genes and extracellular matrix (ECM) molecules (3D).
Methods
The current study at Sapporo Medical University Hospital, Japan, was approved by the Institutional review board (approved number, 282-76) and according to the tenets of the Declaration of Helsinki and national laws for the protection of personal data. Informed consent was obtained from all participants in this study.
Enzyme assays
The enzyme assays for OMD were performed by Eurofins Panlabs Discovery Services Taiwan, Ltd., according to previously described procedures.15–21 The inhibitory effects of 10 μM of OMD on ROCK1, ROCK2, MYLK, and LIMK1, as well as the half-maximal inhibitory concentration (IC50) of ROCK1 and ROCK2 were determined by measuring the inhibitory activity of OMD on these enzymes.
Measurement of real-time cellular metabolic functions
Without or with adipogenic induction (DIF− or DIF+) in the presence of 100 nM OMD and/or 10 μM Rip, the oxygen consumption rate (OCR) and extracellular oxidation rate (ECAR) of 2D-cultured HOF were evaluated using a Seahorse XFe96 Bioanalyzer (Agilent Technologies), as described previously with minor modifications.22,23 In brief, ∼, 20,000 2D-cultured HOFs were placed in the wells of a 96-well assay plate.
After replacing the culture medium with Seahorse XF Dulbecco's modified Eagle's medium (DMEM) (pH 7.4; Agilent Technologies, no. 103575-100) supplemented with 5.5 mM glucose, 2.0 mM glutamine, and 1.0 mM sodium pyruvate, the basal OCR and ECAR values were determined using a Seahorse XFe96 Bioanalyzer, and thereafter, the samples were further analyzed after supplementation with 2.0 μM oligomycin, 5.0 μM carbonyl cyanide p-trifluoromethoxyphenylhydrazone, 1.0 μM rotenone and antimycin A, and 10 mM 2-deoxyglucose (2-DG). The OCR and ECAR values were normalized to the amount of protein per well, as assessed by BCA protein assay (TaKaRa Bio, Inc., Shiga, Japan) after completion of the assay.
Isolation of HOFs, their 2D and 3D spheroid cultures, and induction of their adipogenic differentiation (DIF+)
All experiments involving human orbital tissue and cells were performed in compliance with the tenets of the Declaration of Helsinki. Approval from our internal review board was obtained for the procurement and use of human orbital tissue and cells for this study. Collection of HOFs was processed as described previously using orbital fat explants, which were obtained from surgeries of 2 male and 2 female patients (mean age; 48 years old) with orbital fat herniation. 5
They were then planer 2D cultured in DMEM medium supplemented with 10% fetal bovine serum, 1% L-Glutamine, and 1% Antibiotic-Antimycotic on 100 mm dishes at 37°C with 5% CO2, in which the medium was changed once every 2 days until they reached 100% confluence. For inducing adipogenic differentiation (DIF+) of those 2D cultured HOFs, overconfluent 2D cells were obtained by further culturing for 2 days, and followed by supplementation of the culture medium with 250 nmol/L dexamethasone, 10 nmol/L T3, 10 μg/mL insulin, and 10 mmol/L troglitazone during day 1–5, and with the dexamethasone-free adipogenesis cocktail during day 6–12.
Thereafter, 3D culture HOFs and the induction of their adipogenic differentiation were processed during 10 days, as described in a recent report.4,5,8 For evaluating the additive efficacy of ROCK-i, 10 μM Rip to an EP2 agonist, 100 nM OMD was added during day 2 through day 10. The concentrations of these drugs were the same as was used in our previous studies,7,8 in which we confirmed that these concentrations were optimum for the following analysis. We also confirmed that there were no different effects between 100 nM and 10 μM OMD on the physical properties, sizes and stiffness, and the mRNA expressions of ECM of the 3D HOF spheroids (Supplementary Figs. S1 and S2).
Observation of 3D HOF spheroid configuration and measurement of their mean sizes
As described previously, the 3D spheroid configuration was observed by phase contrast (PC, Nikon ECLIPSE TS2; Tokyo, Japan). 5 Their mean size was determined as the largest cross-sectional area of the PC image analyzed using the Image-J software version 1.51n (National Institutes of Health, Bethesda, MD).
BODIPY lipid staining of 3D HOFs spheroid
Lipid staining of the 3D HOF spheroid by BODIPY was processed as described previously. In brief, 3D HOF spheroids were fixed with 4% paraformaldehyde and thereafter incubated for 3 h in phosphate-buffered saline containing 0.1% BODIPY (no. D3922; Thermo Fisher Scientific), 0.1% 4′,6-diamidino-2-phenylindole (DAPI) (no. D523, Doujin, Japan), 0.1% phalloidin (no. 20553; Funakoshi, Japan), and 3% bovine serum albumin. The staining of the BODIPY was observed using a Nikon A1 confocal microscope (Tokyo, Japan) and their intensity levels were quantified using the Image J software version 2.0.0 (NIH, Bethesda, MD).
Quantitative polymerase chain reaction
Using total RNA extraction by a, RNeasy mini kit (Qiagen, Valencia, CA) and reverse transcription by a SuperScript IV kit (Invitrogen), the samples were processed according to the manufacturer's instructions. The real-time PCR with the Universal TaqMan Master mix using a StepOnePlus instrument (Applied Biosystems/Thermo Fisher Scientific) was performed. cDNA levels expressed as fold change relative to the expression of a housekeeping 36B4 (Rplp0) gene were calculated. Sequences of the primers and TaqMan probes used are shown in Supplementary Table S1.
Micro-indentation force measurement
The micro-indentation force of the spheroid was measured using a micro-squeezer (CellScale, Waterloo, ON, Canada) as described previously. 14 Briefly, a single spheroid was placed on a 3-mm × 3-mm plate and then compressed to achieve a 50% deformation during 20 sec under monitoring by a micro-camera. The required strain (μN) was measured, and force/displacement (μN/μm) was calculated.
Statistical analysis
All statistical analyses were performed using Graph Pad Prism 8 (GraphPad Software, San Diego, CA). To analyze the difference between groups, a grouped analysis with two-way analysis of variance (ANOVA) followed by a Tukey's multiple comparison test was performed. Data are presented as arithmetic mean ± standard error of the mean.
Results
Inhibitory effects of OMD on ROCK1, ROCK2, LIMK1, and MYLK
OMD (10 μM) caused 36%, 25%, 7%, or 22% inhibitions of ROCK1, ROCK2, LIMK1, and MYLK, respectively, and among these, the IC50 of OMD for ROCK1 and ROCK2 were 18.4 and 16.6 μM, respectively. These data indicate that OMD has the potential to inhibit ROCKs.
Effects of OMD and/or Rip on metabolic properties of the 2D cultures of HOFs, as assessed by a real-time cellular metabolic Seahorse bioanalyzer
Next, to assess the effects of OMD or Rip or simultaneously both OMD and Rip on the cellular metabolism in HOFs, a real-time biocellular metabolic analysis of 2D HOFs cells was performed. As shown in Fig. 1, adipogenic differentiation (DIF+) had no effect on baseline oxygen consumption and glycolysis, but maximal respiration was significantly increased in the 2D-cultured HOFs. Interestingly, the induction of DIF+ in the presence of OMD significantly increased baseline oxygen consumption for adenosine triphosphate synthesis and glycolytic capacity.

Different metabolic effects of OMD and/or Rip on adipogenesis of 2D-cultured HOFs assessed by real-time analysis of cellular metabolic function. In the absence or presence of a combination of 100 nM OMD and/or 10 μM Rip, as the real-time metabolic functions of the 2D-cultured HOFs without (DIF−) or with adipogenic differentiation (DIF+), the OCR
In contrast, the induction of DIF+ in the presence of Rip significantly decreased these indices. The administration of both OMD and Rip upon DIF+ cancelled the quiescent effect of Rip on metabolism, but leaving the energetic effect of OMD intact. These results suggest that OMD and Rip induce different effects on metabolic properties, but that the metabolic effect of OMD is predominant in the case of the co-administration of OMD-Rip.
Effects of OMD, Rip, or OMD and Rip on the physical aspects (size and stiffness) and adipogenesis of 3D HOF spheroids
To compare the effects of the OMD and Rip on the physical aspects of the 3D HOF spheroids replicating human orbital fatty tissues, their sizes and stiffness were evaluated by a micro-squeezer in the presence or absence of 100 nM OMD or 10 μM Rip. During 10 days of the 3D culture of HOFs, as described in our previous studies,4,5 uniform round-shape 3D HOF spheroids grew into downsizing, and upon adipogenesis (DIF+), these sizes were significantly increased (Fig. 2). Such DIF+-induced enlargements of the 3D HOF spheroid were markedly enhanced by the administering of 10 μM Rip (Fig. 2).
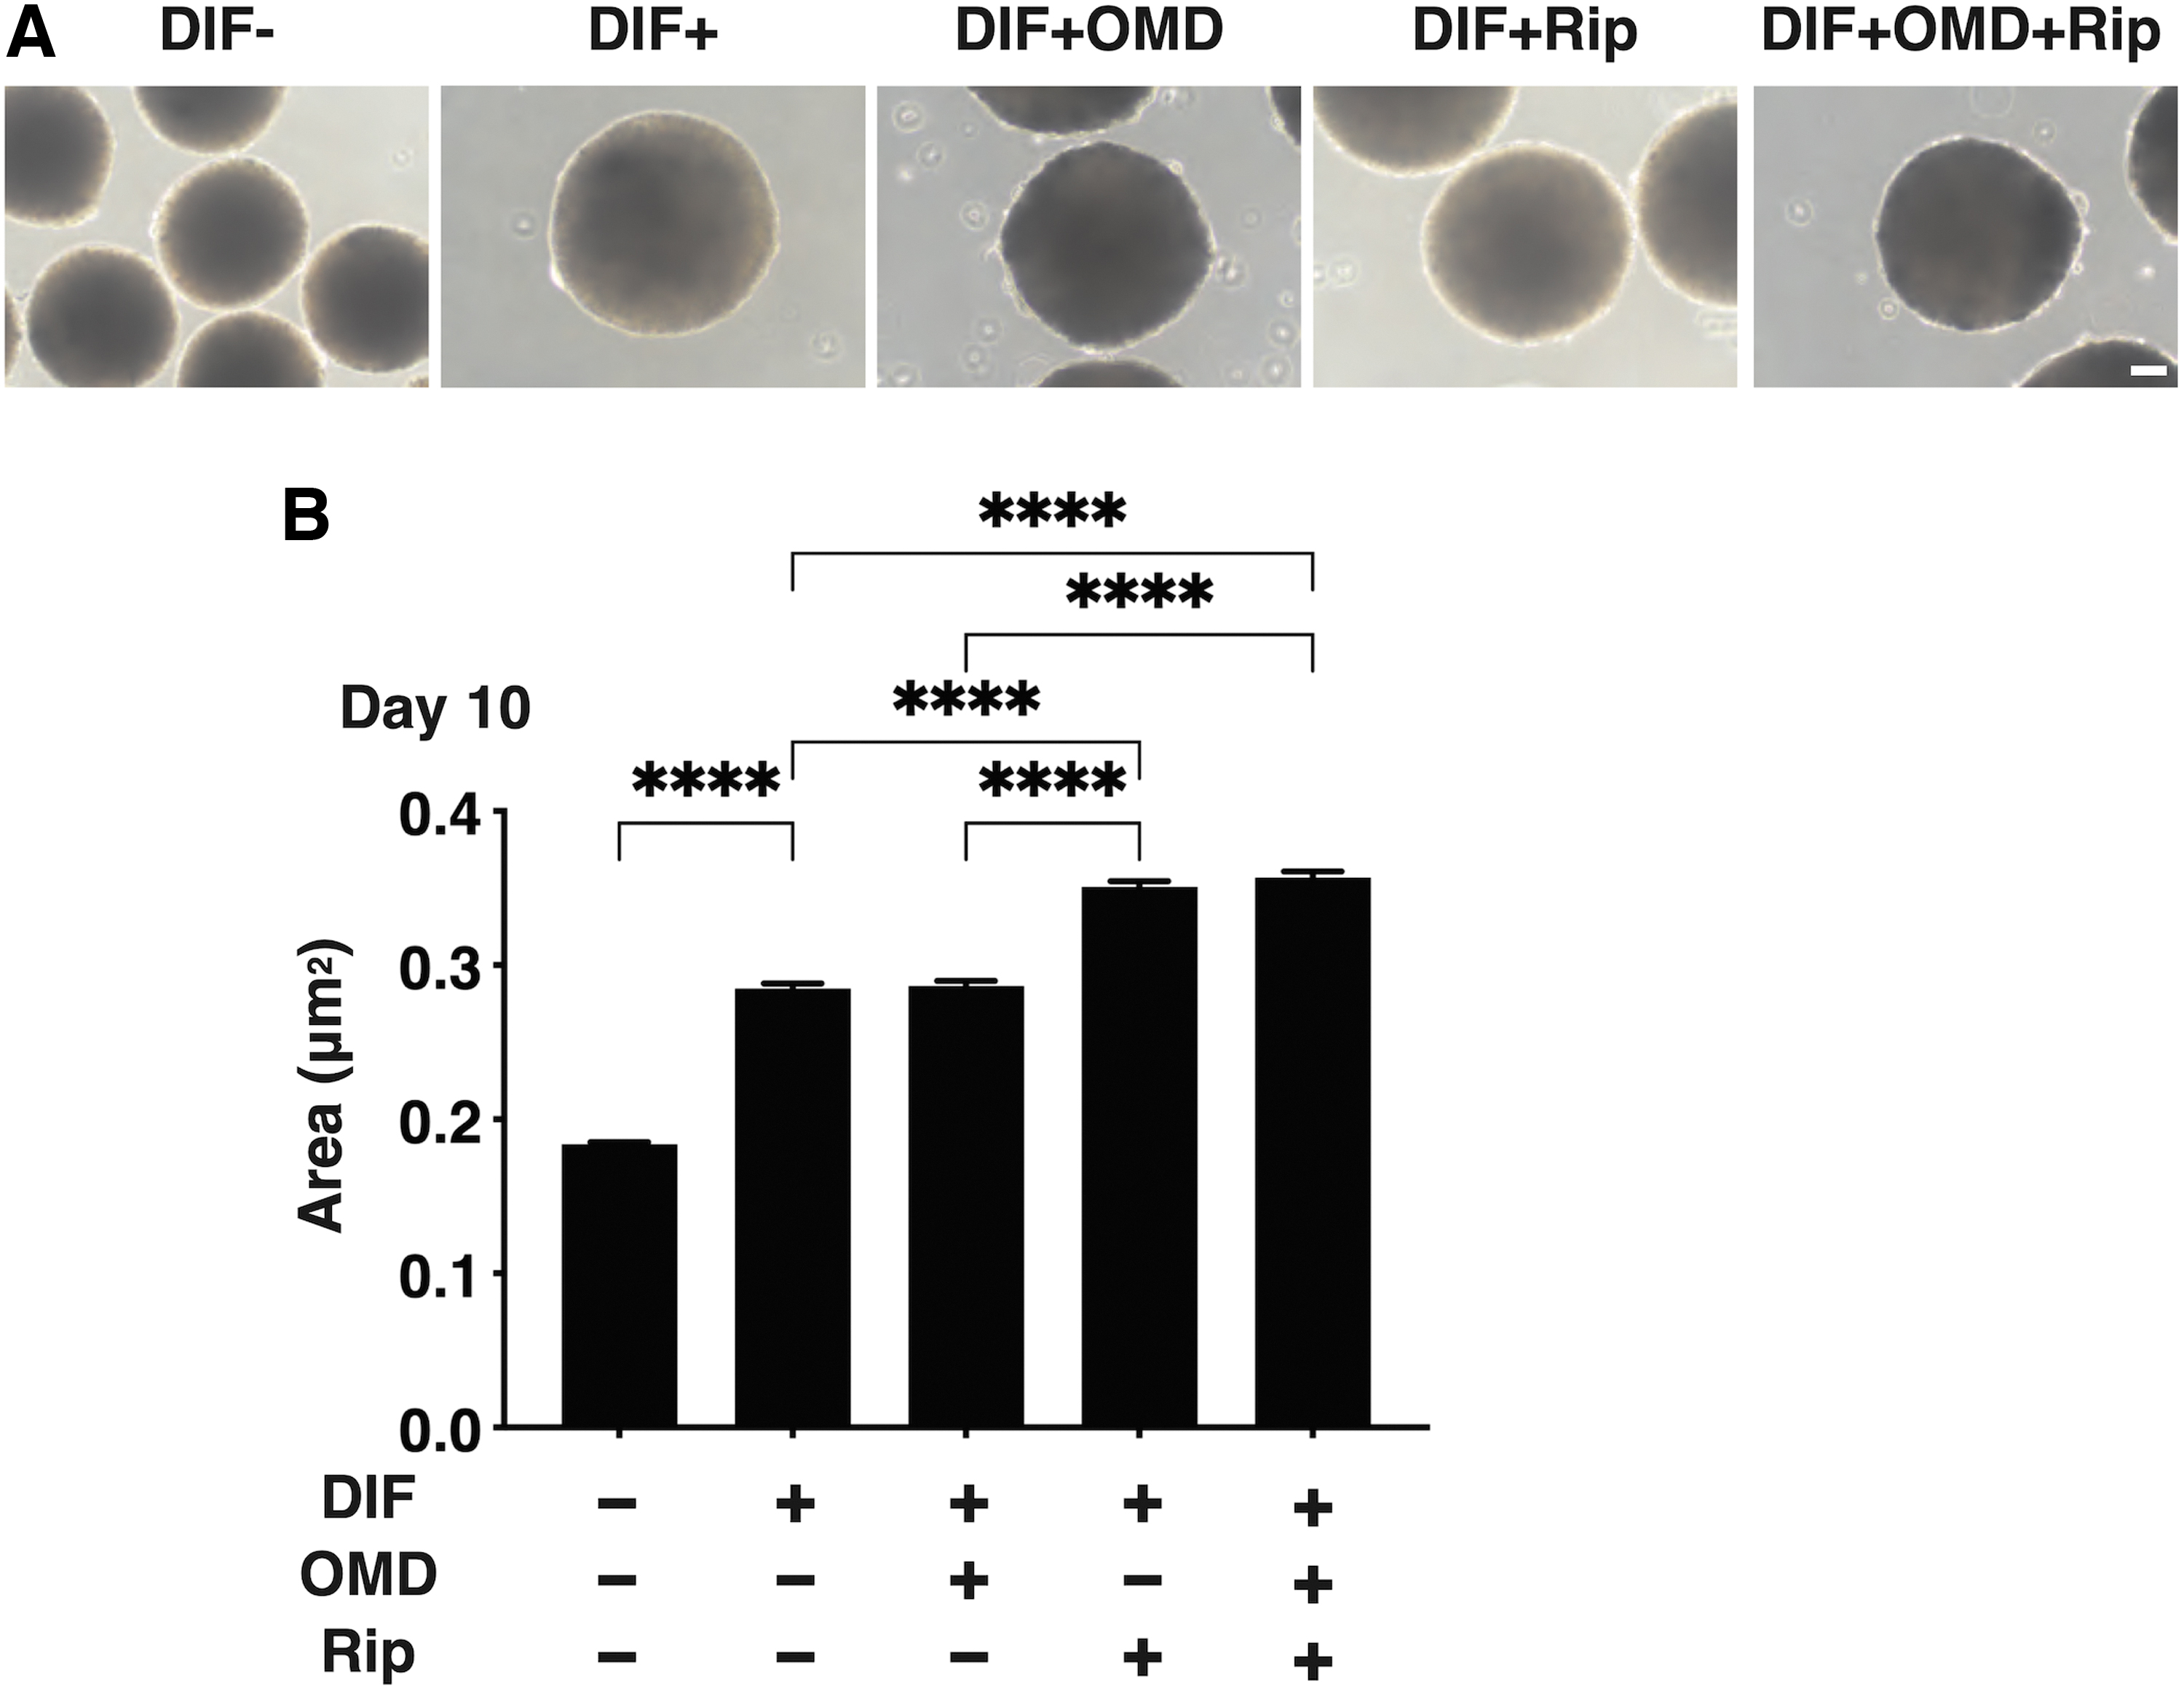
Effects of OMD and/or Rip on the sizes of 3D HOF spheroids. 3D HOF spheroids prepared under several following conditions; 3D HOFs spheroids of preadipocytes (DIF-) or their adipogenic differentiation (DIF+) without or with 100 nM OMD and/or 10 μM Rip. Representative images by phase contrast microscope of the 3D HOF spheroids among the above experimental conditions on day 10 are shown in
Concerning the OMD- and/or Rip-induced effects on the hardness of 3D HOF spheroids, which was significantly increased upon DIF+, and in the presence of 100 nM OMD or 10 μM Rip, such DIF+-induced effects were substantially decreased and the values were not additively enhanced by both drugs (Fig. 3). Similar to these, the DIF+-induced enhancement in BODIPY staining was further increased by the presence of OMD or Rip (Fig. 4).
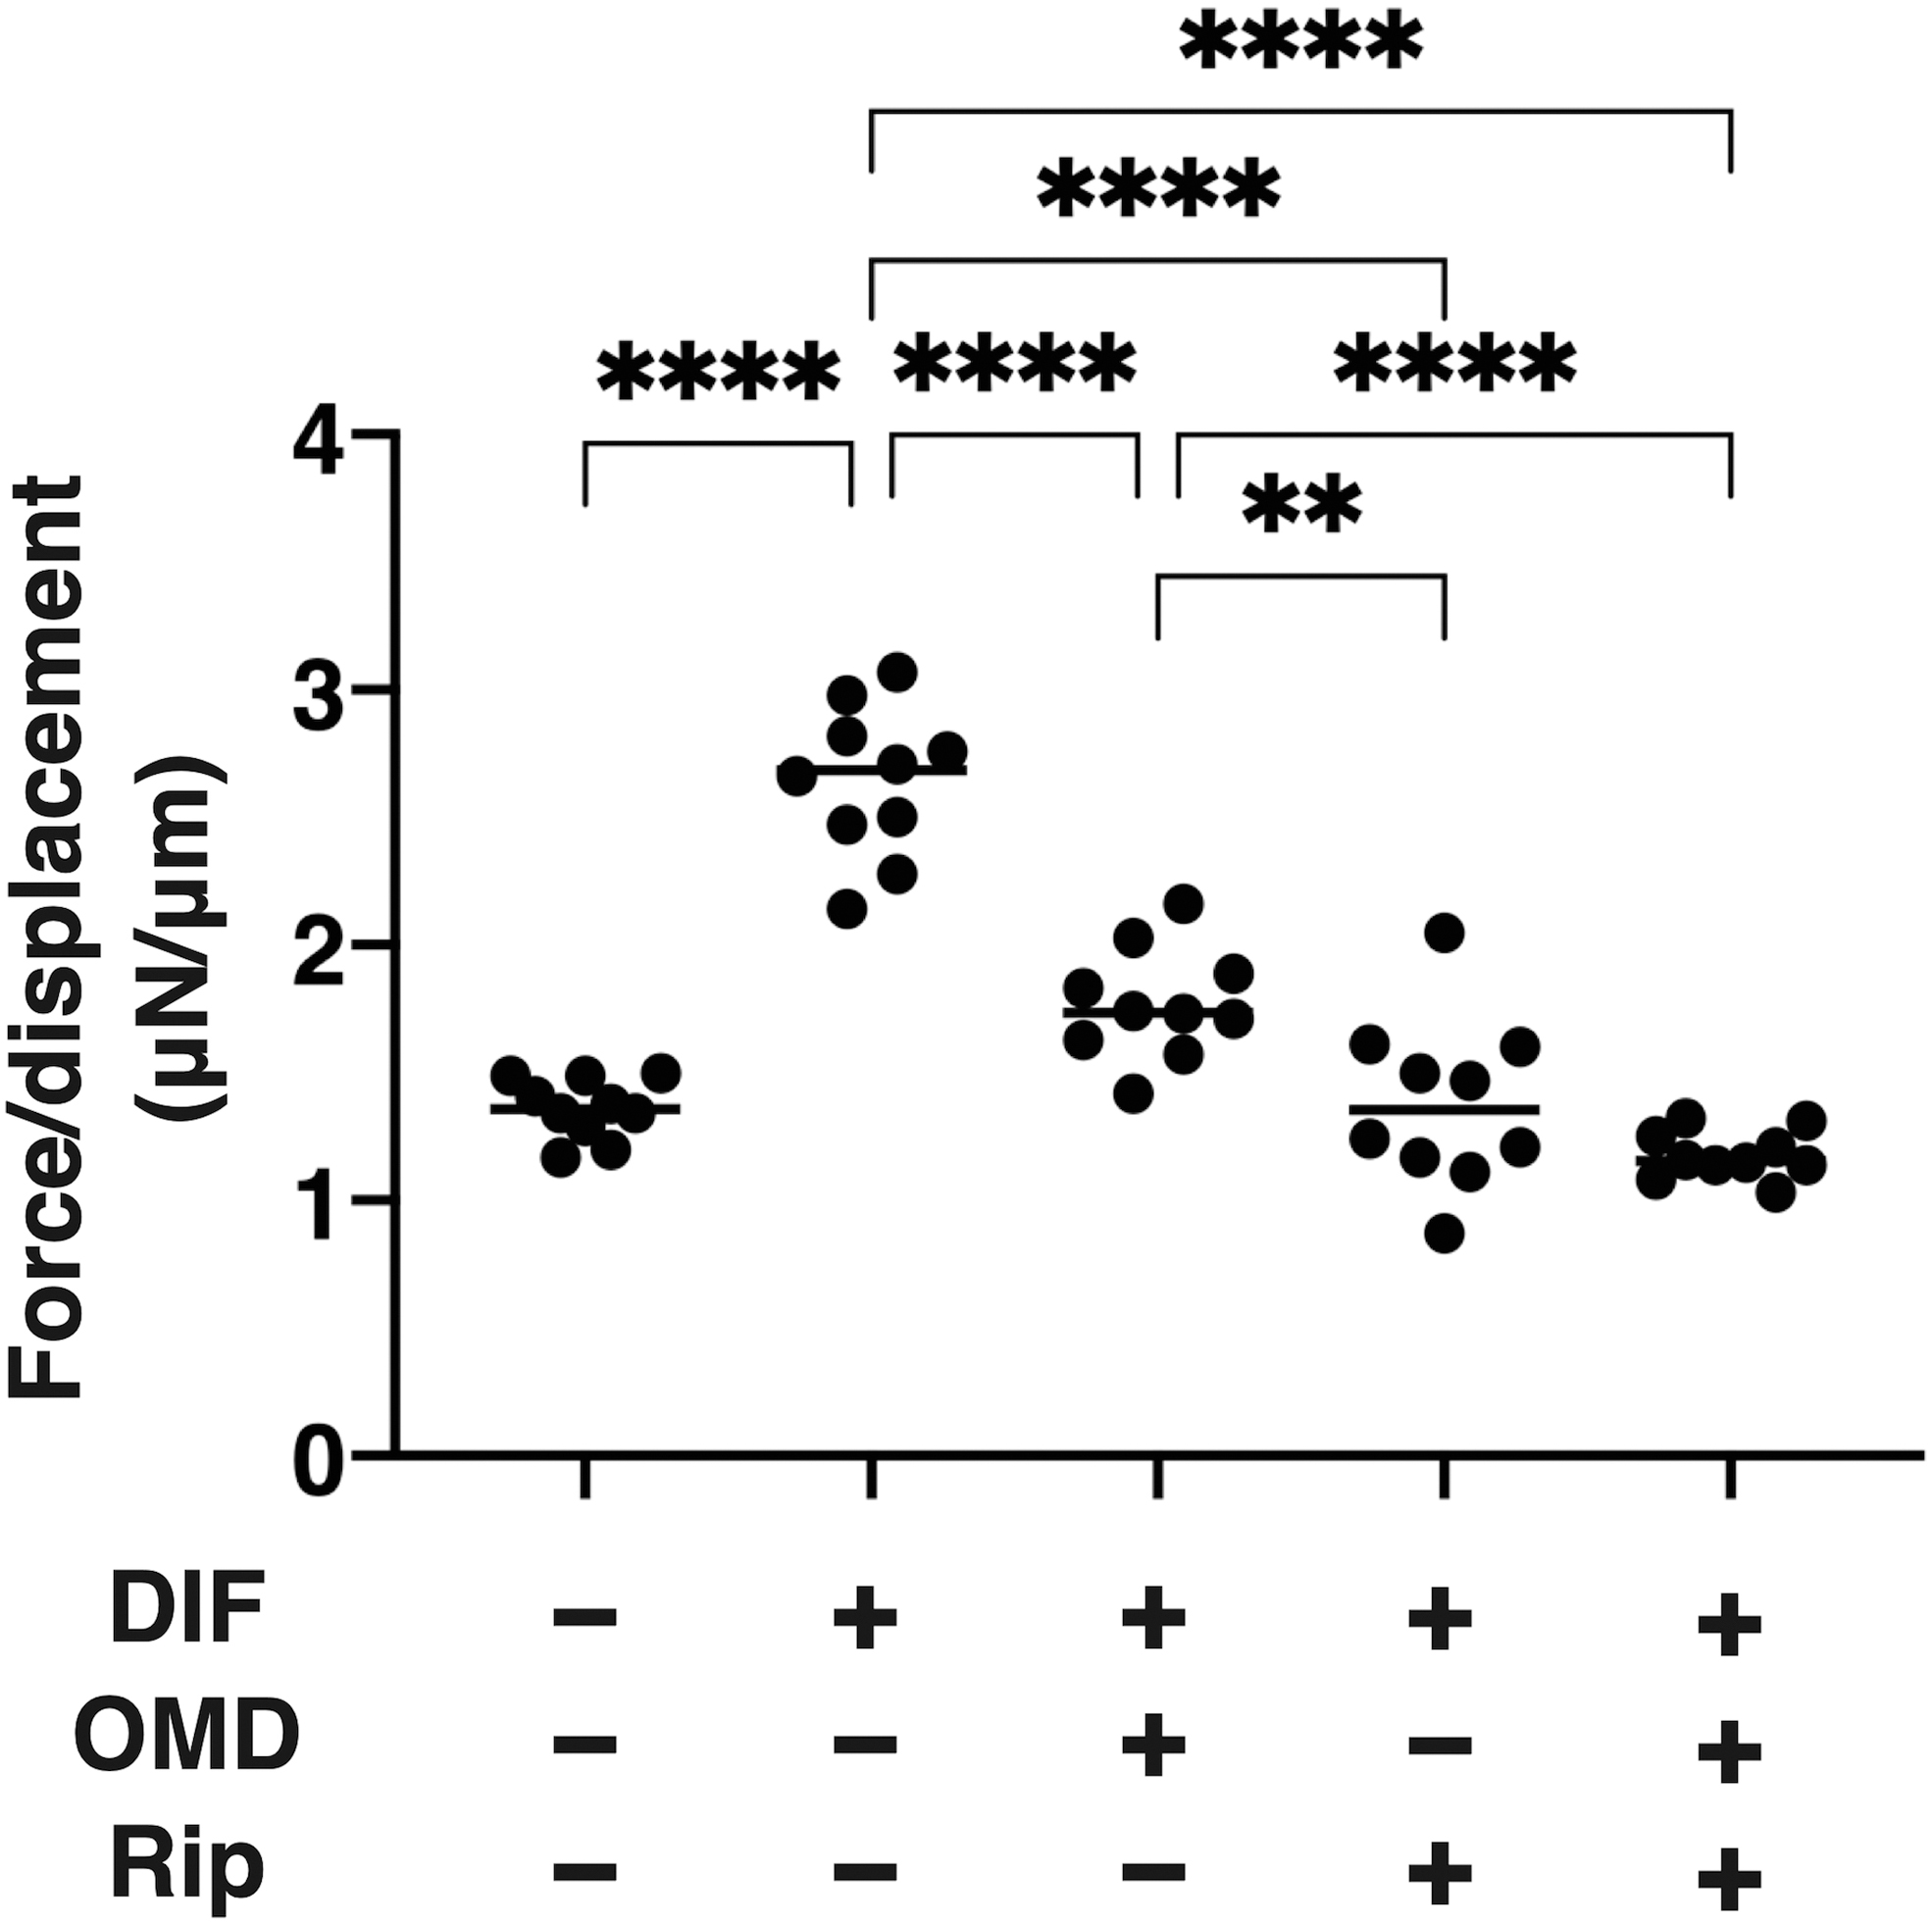
Effects of OMD and/or Rip on hardness of the HOFs 3D spheroid. The day 10 HOF 3D spheroids of preadipocytes (DIF-) and their adipogenic differentiation (DIF+) in the absence or presence of 100 nM OMD and/or 10 μM Rip were analyzed in their physical hardness by a micro-squeezer. The force inducing 50% deformation (μN/μm force/displacement) were measured and plotted. All experiments were performed using fresh prepared 12–20 spheroid. **P < 0.01, ****P < 0.001 (ANOVA followed by a Tukey's multiple comparison test).
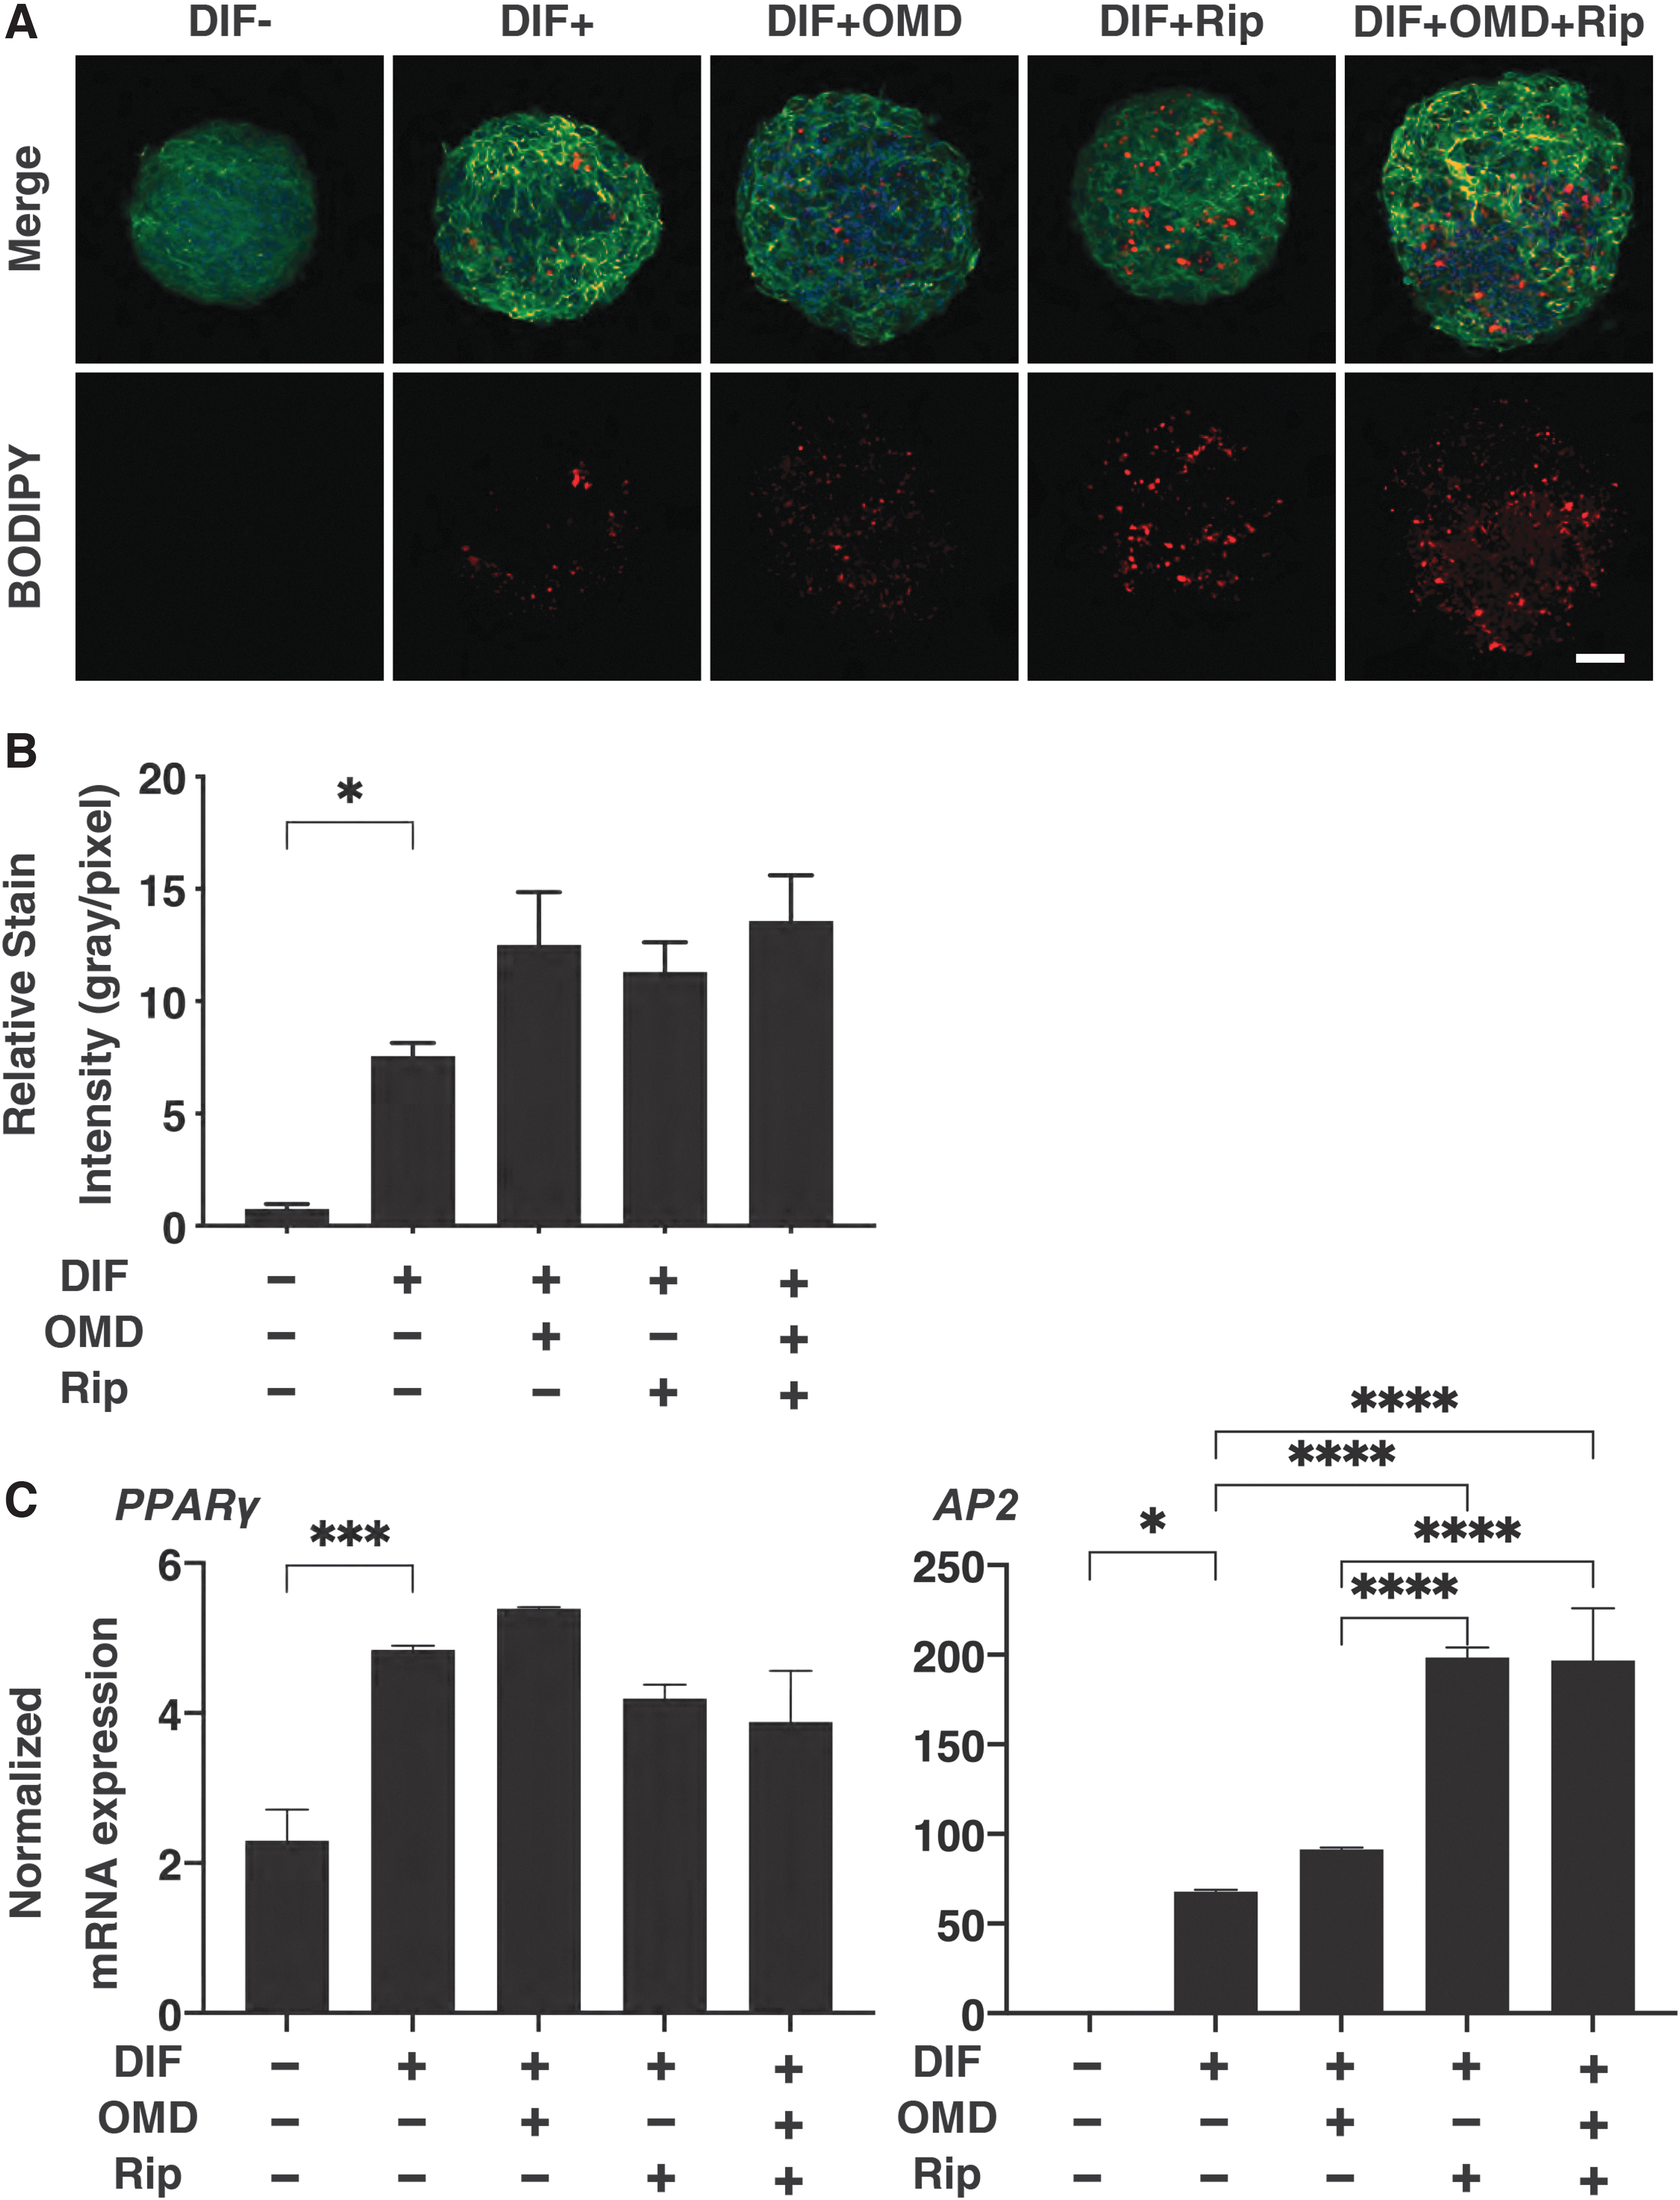
Effects of OMD and/or Rip on adipogenic differentiation (DIF) of 3T3-L1 3D spheroid. The day 10 HOF 3D spheroids of preadipocytes (DIF-) and their adipogenic differentiation (DIF+) in the absence or presence of 100 nM OMD and/or 10 μM Rip were immunostained with DAPI (blue), phalloidin (green), and BODIPY (red)
In the presence of 10 μM Rip in both the absence and presence of 100 nM OMD, the mRNA expression of AP2 was significantly upregulated, although the values for PPARγ were not significantly changed by 100 nM OMD and/or 10 μM Rip (Fig. 4). These data indicate that the effects of OMD on BODIPY lipid staining and the gene expressions of PPARγ were similar to that for Rip, but the effects of both drugs on AP2 expression were different. Taken together with similar effects on the physical properties by OMD and Rip, both drugs induced the production of lipid, but the nature of these lipids was distinct.
Effects of OMD, Rip, or OMD and Rip on major ECM expression in 3D HOF spheroids by qPCR
To study further to elucidate the possible underlying mechanisms responsible for causing the OMD- and/or Rip-induced effects toward the structural and physical aspects of the 3D DOF spheroid as above, we determined the mRNA expression of major ECM molecules, including collagen (COL)1, COL4, COL6, and fibronectin (FN) (Fig. 5). As was shown in our previous study, significant upregulation of COL4 and COL6, and downregulation of COL1 and FN were again confirmed. In the presence of 100 nM OMD, DIF+-induced COL4 was further upregulated and the OMD-induced effect was diminished by the addition of Rip. These collective findings suggest that different effects toward COL4 expression between Rip and OMD may be involved in the diversity of physical properties of the 3D HOF spheroids described above.
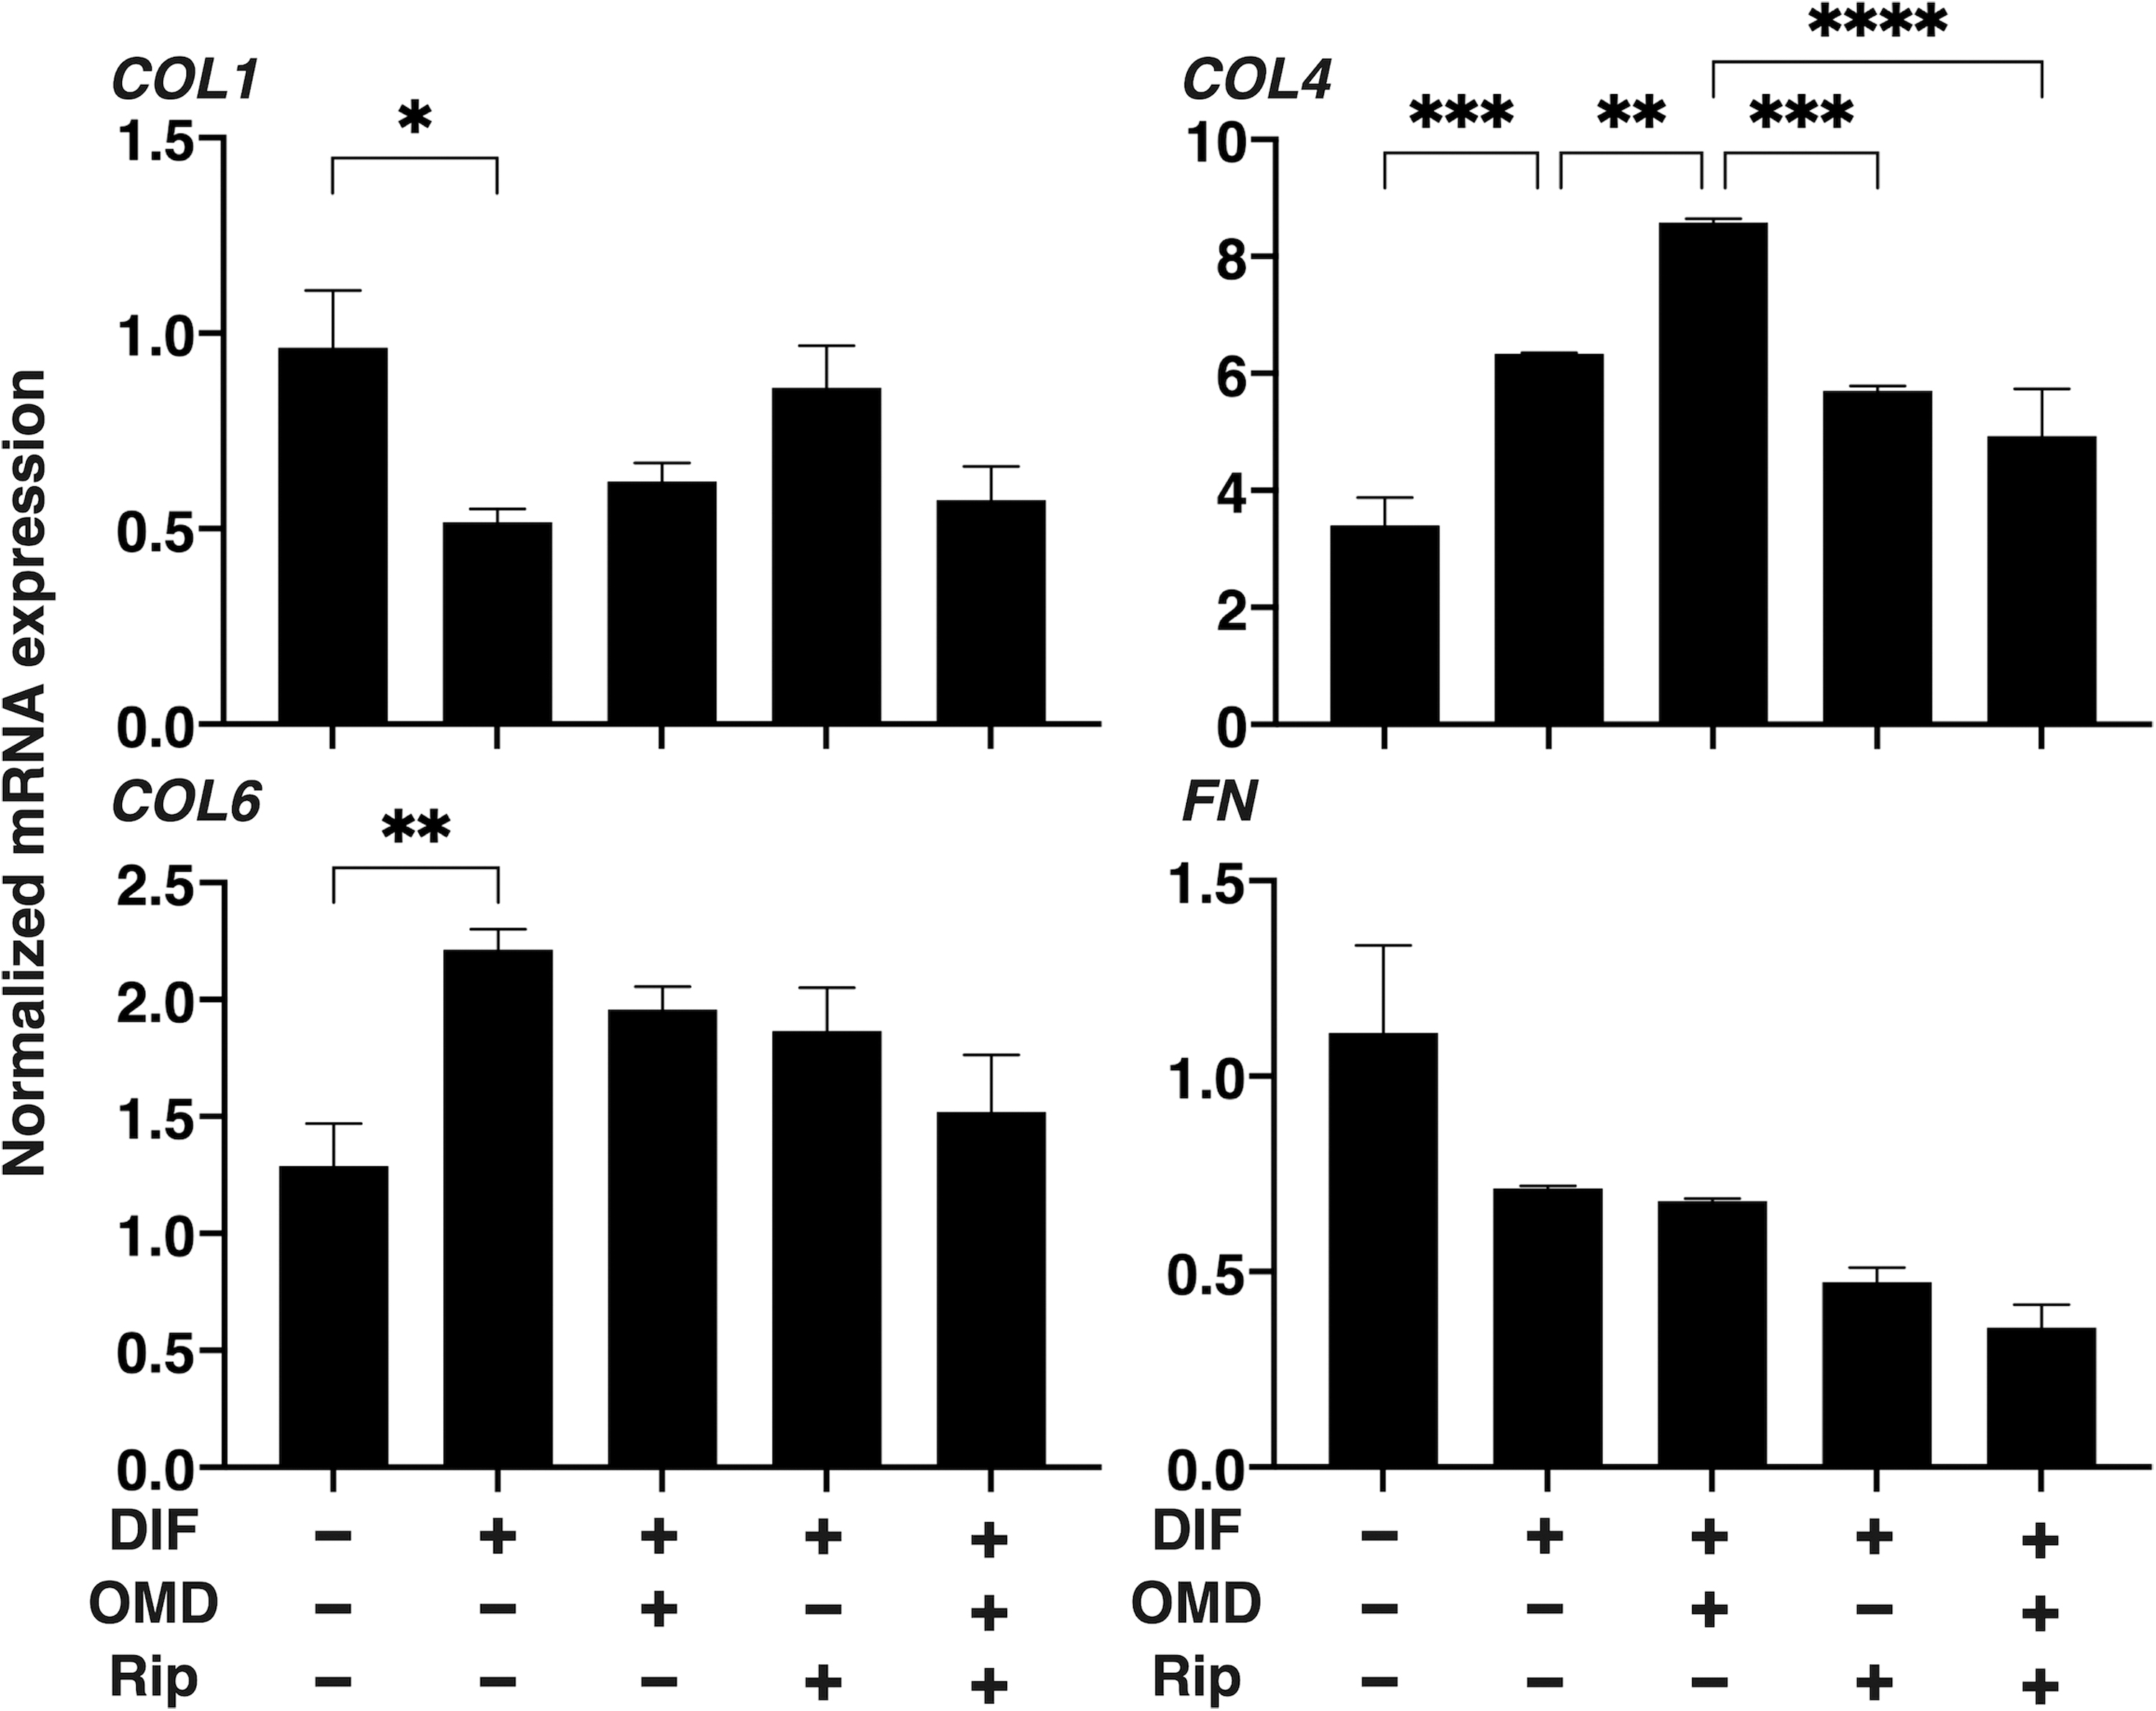
Gene expressions of ECMs in 3D HOF spheroid. The day 10 HOF 3D spheroids of preadipocytes (DIF-) and their adipogenic differentiation (DIF+) in the absence or presence of 100 nM OMD and/or 10 μM Rip were subjected to a qPCR analysis of ECM molecules (COL1, COL4, COL6, and FN). All experiments were repeated in duplicate using fresh preparations, each of which consisted of 16 spheroids. Data are presented as arithmetic mean ± SEM. *P < 0.05, **P < 0.01, ***P < 0.005, ****P < 0.001 (ANOVA followed by a Tukey's multiple comparison test). COL1, collagen 1; COL4, collagen 4; COL6, collagen 6; FN, fibronectin.
Discussion
PGE2 is known to couple with four subtypes of the G protein-coupled receptor, referred to as prostaglandin receptors EP 1–4. 24 EP1 increases intracellular free calcium levels, whereas EP2 and EP4 increased and EP3 decreased the levels of cAMP, respectively. 25 Among these, EP2 is distributed to various organs, including ocular tissues, and is pivotally involved in various signal transduction pathways. 26 Besides EP2 receptor agonist, OMD-induced ocular hypotensive effects,27–29 little information has been currently available in terms of side effects, especially toward systemic and periocular tissues.
In terms of this issue, especially the OMD-induced effects toward adipose tissue, Yamamoto et al. described no OMD-induced effect against DIF+ of 2D 3T3-L1 cells, although PGF2α significantly suppressed adipogenesis. 30 However in contrast, we claimed that OMD caused a significant suppression of their adipogenesis using 2D and 3D cultures of 3T3-L1 cells, 8 similar to a lot of studies demonstrating the inhibition of adipocyte development by PGE2 and PGF2α.31,32 Furthermore, in the 3D 3T3-L1 cultures, we have also shown the OMD-induced significant enlargement and less stiffed 3D 3T3-L1 spheroids, 8 although, in contrast, PGF2α induced substantial numbers of small and stiffer 3D 3T3-L1 spheroids4,5 (Table 1). In this study, although such OMD-induced enlargement effects toward 3D spheroids were not observed in the HOFs, OMD still caused a significant decrease in their stiffness and these effects were apparently different from the PGF2α-induced effects, downsizing and increased stiffness 5 (Table 1).
Summary of the Effects of Adipogenesis (DIF+) in the Absence or Presence of Omidenepag or PGF2α Agonists on the Physical Properties (Size and Stiffness), Lipid Staining, and Gene Expressions of Adipogenesis-Related Factors and Extracellular Matrix of the Three-Dimensional Human Orbital Fibroblast and 3T3L1 Spheroids
Data related to 3T3L1 cells4,7,8,12,40,41 and PGF2α5,6,14,39 were recruited from our previous studies.
↑, significant increase (P < 0.05); ↑↑, significant increase (P < 0.01); ↓, significant decrease (P < 0.05); ↓↓, significant decrease (P < 0.01); (–), no significant change; AP2, adipocyte protein 2, COL1, collagen 1; COL4, collagen 4; COL6, collagen 6; ECM, extracellular matrix; FN, fibronectin; HOF, human orbital fibroblast; OMD, omidenepag; PGF2α, prostaglandin F2α; PPARγ, peroxisome proliferator-activated receptor γ.
Therefore, these above findings suggest that OMD may induce some unidentified effects toward 3D spheroid structure. To identify the underlying mechanisms responsible for the effects of OMD on 3D spheroid architecture, we evaluated the inhibitory activities of OMD for several possible enzymes that are related to the regulation of the cell structure, including ROCK 1 and 2, LIMK1, and MYLK, and the findings indicated that 10 μM OMD exerted positive inhibitory activities.
Since in this study Rip also caused similar effects on the physical aspects, size and stiffness, of the 3D HOF spheroid as observed by OMD, and these were not synergistically enhanced by OMD, we rationally speculate that, in addition to the agonist actions of EP2, ROCK inhibition activity of OMD may also be partly involved. To support this idea, the current real-time biocellular metabolic analysis indicated that OMD and Rip induce different effects on metabolic properties, despite the predominant metabolic effect of OMD in the case of the co-administration of OMD-Rip (Fig. 1).
Previously, the negative regulation of adipocyte differentiation by the ROCKs, and in turn, their stimulation by ROCK-is, Y-27632, and fasudil was demonstrated. 33 In this study, ROCK 1 and 2 inhibitors, Rip, and EP2 agonist OMD also relatively increased the intensity of BODIPY staining levels in the 3D HOF spheroids (Fig. 3). However, although the mRNA expression of the adipogenesis-related gene, AP2, was upregulated by Rip, OMD had no effect, supporting the relative increase in BODIPY staining by Rip. There results may support potential ROCK inhibitory activities of OMD as shown above. Regarding the discrepancy between lipid staining and adipogenesis-related gene expression, since the lipid staining intensities should represent spatial distribution within the 3D spheroid, those levels may not always correspond to the total levels of their gene expressions, as was shown in our previous study. 4
In addition, similar to 3D 3T3-L1 spheroids, 7 Rip induced significant effects on physical properties, size and stiffness, of the 3D HOF spheroids as above. These findings rationally suggest that such Rip-induced effects might be a similar phenomenon associated with the inhibition of ROCK, reducing the degree of cellular mechanical tension and hardness by decreased levels of the ECM synthesis in various cells.34–36
In terms of the ROCK inhibition of OMD, we first demonstrated that the IC50 values for ROCK 1 (OMD; 18.4 μM) and ROCK 2 (OMD; 16.6 μM) were relatively lower compared to the values for Rip, a potent inhibitor (ROCK 1; 51 nM and ROCK 2; 19 nM). Taking into account the fact that the concentrations of the prodrug of OMD (OMDI) and Rip were significantly high for their instillations, with values of 38.5 μM and 6.3 mM, respectively, and, taking the long-term use of these antiglaucoma medications into account, the ROCK inhibition activity by OMD converted from OMDI may not be negligible.
In addition, since several biological barriers such as cornea, aqueous humor, lens, and vitreous are present before topically administered drugs reach the posterior segment of the eye, 37 the OMD-associated ROCK inhibitory activities could be enhanced in some conditions, that these barriers' functions are modulated with ocular inflammations, ocular surgeries, and others. Also, upon DIF+, the 3D HOF spheroids enlarged, presumably because of the increased volume of lipid, but become less stiff, as shown in Figs. 2 and 3 and also reported in our previous studies.5,6,14,38
However, in the case of 3T3-L1 preadipocytes, DIF+-induced enlargement and a decrease of the stiffness of the 3D 3T3-L1 spheroid were consistently observed, as was reported in our previous studies4,7,8,12,39–41 (Table 1). However, as of this writing, we have no viable explanation for why the effects of DIF+ of 3D spheroid stiffness were different between 3T3-L1 preadipocyte and HOFs.
Therefore, additional studies with the goal of elucidating the unidentified mechanisms related to the relationship between OMD and ROCKs by comparing several combinations with several ROCK inhibitors, as well as Si RNA inhibition of ROCK 1 and/or 2, in addition to the molecular mechanisms responsible for inducing diverse effects toward 3D spheroid stiffness upon DIF+, will be needed in our future project.
Footnotes
Acknowledgments
We are grateful to Dr. Masahiro Fuwa, Dr. Atsushi Shimazaki, and Dr. Takashi Nagano (Product Department Division, Santen Pharmaceutical CO., Ltd., Nara, Japan) for their excellent scientific input, discussions, and contributions to this effort.
Authors' Contributions
F.H. designed and performed experiments, analyzed data, and wrote the article, M.W. designed and performed experiments, analyzed data, and wrote the article, T.S. designed and performed experiments, analyzed data, and wrote the article, A.U., Y.T., and M.F. analyzed data and wrote the article, H.O. designed experiments, analyzed data, and wrote the article.
Author Disclosure Statement
No competing financial interests exist.
Funding Information
No funding was received for this article.

References
Supplementary Material
Please find the following supplemental material available below.
For Open Access articles published under a Creative Commons License, all supplemental material carries the same license as the article it is associated with.
For non-Open Access articles published, all supplemental material carries a non-exclusive license, and permission requests for re-use of supplemental material or any part of supplemental material shall be sent directly to the copyright owner as specified in the copyright notice associated with the article.
