




Abstract
Purpose:
To identify reasons for variable intraocular pressure (IOP) responses to latanoprost and timolol in healthy volunteers and to generate the control group as part of Eye Dynamics and Engineering Network.
Methods:
In this multicenter, randomized, crossover study (NCT01677507), both eyes of 106 healthy subjects (212 eyes) were treated with latanoprost or timolol for 7 days, with a 6-week washout between treatments. Ocular biometrics, tonometry, and aqueous humor dynamics (AHD) were assessed at baseline and day 8 of each treatment. Subjects were divided into responders and nonresponders using cutoffs of >15% or >10% IOP reduction. Treatment effects and correlations were analyzed with paired t-tests.
Results:
More subjects responded to latanoprost (54%) than timolol (27%) at >15% cutoff (p < 0.01). Responders had higher mean baseline IOP than nonresponders for both drugs at both cutoffs (p < 0.01). Among timolol nonresponders (n = 56), 39% responded to latanoprost in both eyes, 20% in one eye, and 41% in neither. Among latanoprost nonresponders (n = 31), 13% responded to timolol in both eyes, 13% in one eye, and 74% in neither. Latanoprost increased uveoscleral outflow, while timolol reduced aqueous flow and outflow facility. Low baseline uveoscleral outflow was associated with latanoprost response.
Conclusions:
Higher baseline IOP predicted better responses to both drugs. Higher baseline uveoscleral outflow predicted nonresponse to latanoprost. No AHD differences were linked to the timolol response. Timolol nonresponders were often responsive to latanoprost, but not vice versa.
Introduction
Even though latanoprost is more efficacious than timolol in both intraocular pressure (IOP)-lowering effect and response rate, 1 a variable nonresponse rate for each medication makes it difficult to predict whether a patient will respond to each drug. Depending on the chosen IOP cutoff to indicate response or nonresponse and the characteristics of enrolled subjects, latanoprost’s nonresponse rate ranges anywhere from 7% to 41%;2–7 while timolol’s nonresponse rate ranges anywhere from 20% to 44%.2,8,9 Two crossover trials have compared latanoprost and timolol responses within the same individual. One study 10 examined patients with primary open-angle glaucoma (OAG) or ocular hypertension (OHT) who were nonresponders to latanoprost therapy (using a cutoff of less than 15% reduction in IOP). After placing these latanoprost nonresponders on timolol, 21% responded to timolol. However, given the low number of subjects in that study, the statistical power for detecting any response to timolol after crossover was only 50%. Another study 11 examined patients with primary OAG treated with latanoprost and timolol for 3 months. The study found very low rates of nonresponse for each drug but direct comparisons of an individual’s response to each drug were not done. Neither of these crossover trials examined concordance between the response group and factors such as aqueous humor dynamics (AHD) in predicting individual response to each drug. None of these studies explained the effect of OHT on response rates. To do this, a control group of healthy ocular normotensive subjects is needed.
The primary purpose of the current study is to identify associations between IOP response rates to latanoprost and response rates to timolol in subjects with healthy eyes. To accomplish this, the Eye Dynamics and Engineering Network (EDEN) Consortium gathered data from healthy subjects. The parameters of the Goldmann Equation (aqueous humor flow, outflow facility, episcleral venous pressure [EVP], uveoscleral outflow, and IOP) were examined before and after 1 week of treatment with either latanoprost or timolol. We tested if baseline parameters of AHD are predictive of IOP response to either drug and we examined concordance between nonresponders to latanoprost and timolol.
Methods
Subject recruitment
The study was approved by the respective Institutional Review Boards at the University of Michigan, Mayo Clinic Rochester, and the University of Nebraska Medical Center. It was performed according to the Declaration of Helsinki. The study was registered at Clinicaltrials.gov under the identification number NCT01677507. Informed consent was obtained before initiating any study-related procedures. Subjects enrolled in the study were healthy volunteers over the age of 40 years, with IOPs below 20 mmHg on the screening visit, no signs of any ocular pathology, and who were never prescribed IOP-lowering drugs. Exclusion criteria included history of ocular surgery (laser or incisional), glaucoma, use of medications to lower IOP, history of narrow angles, ocular trauma within the last six months, recent changes to systemic medications which may influence IOP, use of glucocorticoids (topical, inhaled, or systemic), or any contraindication to timolol (active airway disease, bradycardia, or serious hypersensitivity reaction). Additionally, women who were pregnant or breastfeeding were excluded from the study due to the known changes in IOP during these physiological states.12,13 Details of the study design and a more comprehensive list of inclusion and exclusion criteria are found in the baseline publication from the EDEN Consortium. 14
Experimental design
A randomized, open-label, cross-over trial was used to evaluate IOP response after a 7-day use of either latanoprost or timolol at the three study sites of the EDEN consortium. All study subjects received an ocular examination before enrolling in the study (screening visit), including visual acuity, slit-lamp biomicroscopy, IOP, gonioscopy, indirect ophthalmoscopy, A-scan biometry, and ultrasound pachymetry. Subjects enrolled in the study then underwent a baseline visit with measurements of ocular biometrics (central cornea thickness, anterior chamber depth, cornea diameter, and axial length), IOP, AHD parameters of the Goldmann equation (i.e., aqueous humor flow [AHF] rate, outflow facility, uveoscleral outflow, and EVP). Next, subjects were randomized to self-administer for 7 days to both eyes either one drop of 0.005% latanoprost once daily in the evening before bed or 0.5% timolol twice daily, once upon awakening in the morning and once before bed in the evening. Subjects were coached on dosing methods and timing. They were given a log to record the date and time of each dose administered. The logs were returned at the next visit, when subjects were queried about any issues with dosing. No subject was withdrawn from the study for compliance reasons. The selection of treatment duration was based on two prior publications2,15 reporting little change in IOP between 1 and 6 months of treatment. Therefore, IOP efficacy after 1 week of medication use was presumed to be reflective of IOP efficacy after long-term use. On day 8 of drug administration, subjects underwent a post-medication visit where all measurements were repeated as at baseline. After a 6-week washout, the subjects self-dosed the other drug for a week and returned for a final set of measurements.
Experimental Measurements and Calculations
Intraocular pressure
IOP was measured with Goldmann applanation tonometry during the screening visit, and with pneumatonometry (Classical Model 30, Reichert, Depew, NY) during baseline and post-medication visits. Measurements were made using the standard protocol established by the OHT Treatment Study. 16 Goldmann applanation tonometry was not used during the baseline and post-medication visits because it requires fluorescein which would interfere with the aqueous flow measurement. 17 Pneumatonometry, which requires a topical drop of proparacaine, was used after aqueous flow scans were collected to avoid potential interference with the aqueous flow assessment. IOP measurement by pneumatonometry taken at the baseline visit was used as baseline IOP for all but one of the study subjects. One subject was missing pneumatonometry data from the baseline visit, so the screening visit Goldmann IOP was used instead. IOP was measured in both eyes at 11 AM using a pneumatonometer. The response category (responder vs. nonresponder) was classified using the IOP measured by pneumatonometry. IOP responders were defined as those having an IOP reduction of >15%, while mixed responders had an IOP reduction of >15% in one eye but not the other (right eye [RE] or left eye [LE]). This cutoff has been identified as a clinically significant IOP response to one medication 18 and this decrease exceeds typical diurnal IOP variation. 19
Since a responder cutoff of >15% IOP change is arbitrary, a separate analysis was made with a cutoff of >10% for comparison. In other words, the subjects were secondarily divided into responders and nonresponders when the response was defined as having an IOP reduction of >10%. All analyses were repeated as before. This analysis was done to determine the impact of small changes in IOP from drug treatment.
Measurements of aqueous flow, outflow facility, and episcleral venous pressure
Details of the measurements of aqueous flow, outflow facility, and EVP in this study were described previously. 14 Since data from three sites were combined, all centers used very detailed standard operating procedures to minimize variability among centers. Following is a brief description of these methods. Aqueous flow was measured by fluorophotometry. Flow measurements required fluorescein so that fluid movement in the anterior chamber could be detected and monitored. Therefore, the night before each study visit, the subject self-administered multiple drops of topical fluorescein 2% to both eyes. Subjects were given a log to record fluorescein administration times. Subjects were questioned afterward to verify each log. The following morning, at the clinic study room, three fluorescein scans of the cornea and anterior chamber were made in both eyes with a scanning ocular fluorophotometer (Fluorotron Master, Ocumetrics, Palo Alto, CA). Scans were repeated at 45-minute intervals until four sets were collected. The decay rate of the fluorescent signal and the volumes of the cornea and anterior chamber were used to calculate aqueous flow. Volumes were calculated from values of cornea thickness and diameter and anterior chamber depth which were measured with an IOLMaster (Carl Zeiss Inc, White Plains, NY). The Fluorotron program provided the aqueous flow value.
The outflow facility was measured by tonography using a pneumatonometer with tonography module (Reichert, Depew, NY). The two-minute tonography option was used. A 10-gram weight was attached to the shaft of a handpiece probe which was applied to the central cornea of the supine subject. The pressure in the eye was measured at 50–60 Hz for 2 min. The decay rate of the pressure was used to calculate the outflow facility using a detailed set of formulas. Measurements were made in each eye after the last fluorophotometry scan was completed and again an hour later for a total of two tonography traces per eye per AHD study visit. The best (nonnegative values, no outliers, least variable data) of the two measurements was used in the analysis.
Not all tonography traces could be used for the outflow facility analysis. Poor quality traces were those that showed large variations in pulse amplitudes and a lack of clear linear decline in pressure over time. Out of 212 traces, 30% were considered poor or very poor quality by agreement with the authors who performed the measurements. These were not used in this analysis.
EVP was measured by a commercially available venomanometer (EyeTech, Boca Raton, FL). The instrument was connected to a slit lamp. An appropriate vein was visualized in the eye of the subject seated at the slit lamp. The soft membrane of the instrument was placed on the vein. The dial of the unit was turned to apply pressure behind the membrane until the vein began to collapse (blanch). One investigator collected the measurement and a second individual read the value on the dial. The measurement was made twice per eye per study visit and the values were averaged.
Calculation of uveoscleral flow
Uveoscleral outflow was calculated from the rearranged modified Goldmann equation. Fu = AHF — C (IOP—EVP) where Fu is uveoscleral outflow (µL/min), AHF is aqueous flow determined by fluorophotometry (µL/min), IOP is measured by pneumatonometry, C is outflow facility measured by tonography (µl/min/mmHg), and EVP is episcleral venous pressure determined by venomanometry.
Data analysis
Data were managed with REDCap 20 and analyzed with JMP Pro version 17.1.0 (SAS Institute Inc., Cary, NC, 1989–2023). The changes in measurements with the drug were compared to the baseline using paired t-tests. Correlations were calculated with the Spearman rank correlation coefficient. 21 Response rates were based on pneumatonometric IOPs. Groups were compared with robust tests between responders and nonresponders within each treatment arm (latanoprost or timolol).22,23 Each eye was analyzed individually to more accurately predict the drug effect, as monocular analysis is only helpful for drug side effect profiles. 24
Results
Subjects and study design
About 135 subjects were enrolled in the study. Of these, 106 subjects (212 eyes) who completed both timolol and latanoprost treatment arms were included in the data analysis. The reasons for early withdrawal from the study included the following: unexpected health issues unrelated to the study medication, concern over side effects of the study medication, work-related inability to fulfill study visits, and failure to comply with the study medication. The mean age of subjects was 55.5 ± 8.9 years (mean ± STDEV [standard deviations of the mean]) with the majority being Caucasian (87%) and female (76%). Mean baseline IOP was 16.0 ± 3.1 mmHg RE, and 16.1 ± 3.0 mmHg LE. All subjects had a best corrected visual acuity equal to or better than 20/50. The patients’ mean cup-to-disc ratio was 0.4 ± 0.2 (both eyes, BE), vertically and horizontally. Baseline ocular biometrics are listed in Table 1. The randomized order of drugs given made no significant difference in IOP change. There was no difference in baseline characteristics between those who started latanoprost first or timolol first.
Biometrics and Aqueous Humor Dynamics of Latanoprost and Timolol
p-value for paired t-test between Baseline and post-latanoprost or post-timolol.
Significant at the 0.05 level.
Acv, anterior chamber volume; AHF, aqueous humor flow; AxL, axial length; IOP, intraocular pressure; C, outflow facility; CCT, central corneal thickness; Fu, uveoscleral outflow; EVP, episcleral venous pressure; SD, standard deviation.
There were no withdrawals of subjects from the study due to drug-related issues. The side effects of each drug were redness, dry eye, blurred vision, and eye discomfort, as well as an instance of double vision with latanoprost. The summary of the demographics and baseline characteristics of study subjects were reported previously. 14
Intraocular pressure
When compared to baseline, timolol lowered IOP by a mean of 13% in the RE (−2.1 ± 1.8 mmHg) and 14% in the LE (−2.3 ± 1.8 mmHg) and latanoprost lowered IOP by 16% in the RE (−2.8 ± 2.3 mmHg) and 17% in the LE (−3.0 ± 2.2 mmHg). Latanoprost lowered IOP by 4% more than timolol in the RE (p = 0.0026) and 4% more than timolol in the LE (p = 0.002). For both timolol and latanoprost, subjects with a higher baseline IOP had a larger magnitude decrease in IOP (p < 0.0001) (Tables 2 and 3).
Baseline Characteristics of Eyes by Response Group (>15% decrease in IOP), Latanoprost Responders and Timolol Responders (n = 212 Eyes, 106 Subjects)
p-value for robust (Huber M-estimation) t-test between responder and nonresponder groups within treatment with latanoprost or timolol.
Significant at the 0.05 level.
Responders are defined as a > 15% decrease in IOP from baseline using pneumatonometry.
Fu, uveoscleral outflow; Acv, anterior chamber volume; AHF, aqueous humor flow; AxL, axial length; C, outflow facility; CCT, central corneal thickness; IOP, intraocular pressure; LNR, latanoprost nonresponders; LR, latanoprost responders; Pev, episcleral venous pressure; TNR, timolol nonresponders; TR, timolol responders.
Baseline Characteristics of Eyes by Response Group (>10% decrease in IOP), Latanoprost Responders and Timolol Responders (n = 212 Eyes, 106 Subjects)
p-value for robust (Huber M-estimation) t-test between responder and nonresponder groups within treatment with latanoprost or timolol.
Significant at the 0.05 level.
Responders are defined as a >10% decrease in IOP from baseline using pneumatonometry.
Fu, uveoscleral outflow; Acv, anterior chamber volume; AHF, aqueous humor flow; AxL, axial length; C, outflow facility; CCT, central corneal thickness; IOP, intraocular pressure; LNR, latanoprost nonresponders; LR, latanoprost responders; Pev, episcleral venous pressure; TNR, timolol nonresponders; TR, timolol responders.
Aqueous Humor Dynamics
Differences from baseline or between treatments
A lower AHF rate was found when taking timolol as compared to latanoprost (1.9 ± 0.6 vs. 3.0 ± 1.0 µL/min, p < 0.0001 RE, 1.9 ± 0.6 µL/min vs. 2.8 ± 0.9 µL/min, p < 0.0001 LE) (Table 1). A higher outflow facility was found when taking latanoprost as compared to timolol (0.25 ± 0.09 vs. 0.17 ± 0.09 µL/min/mmHg, p < 0.0001 RE; 0.25 ± 0.09 vs. 0.17 ± 0.09 µL/min/mmHg, p < 0.0001 LE). A higher uveoscleral outflow was found when taking latanoprost as compared to baseline (1.65 ± 1.49 vs. 1.03 ± 1.95 μL/min p = 0.0036* RE; 1.53 ± 1.23 vs. 0.93 ± 1.43 μL/min p = 0.0005* LE).
Changes among response groups
Subjects were compared according to response group: timolol responders (TR), timolol nonresponders (TNR), latanoprost responders (LR), and latanoprost nonresponders (LNR) at 15% and 10% IOP reduction. TR had a 2.3 mmHg higher IOP at baseline on average than TNR RE (Tables 2,3, p = 0.0002*) and 1.7 mmHg higher IOP LE (Tables 2,3, p = 0.002*). No other baseline characteristics differed between TR and TNR for either eye (Tables 2,3). After treatment, TR showed no difference in EVP relative to TNR (Tables 2,3, RE: TR: 8.0 ± 1.8 mmHg vs. TNR: 7.7 ± 1.6 mmHg, LE: TR: 7.6 ± 1.5 mmHg vs. TNR: 7.4 ± 1.5 mmHg). There was no significant difference in baseline aqueous humor formation between the two treatments (Tables 2,3, RE: TR: 3.1 ± 0.9 µL/min, TNR: 3.0 ± 1.3 µL/min, p = 0.2702; LE: TR: 2.9 ± 1.0 µL/min, TNR: 2.9 ± 1.0 µL/min, p = 0.8836).
At baseline and compared to LNR, LR had a higher baseline IOP (Tables 2,3, RE: LR: 17.0 ± 3.0 mmHg vs. LNR: 14.3 ± 2.7 mmHg, p < 0.0001, LE: LR: 16.9 ± 2.8 mmHg vs. LRN: 14.3 ± 2.5 mmHg, p < 0.0001). Baseline uveoscleral outflow was lower in LR than LNR (Tables 2,3, RE: LR: 0.72 ± 2.01 μL/min vs. LNR: 1.65 ± 1.71 mmHg, p = 0.0285*, LE: LR: 0.60 ± 1.50 mmHg vs. LRN: 1.55 ± 1.06 mmHg, p -= 0.0014). Again, there was no significant difference in baseline aqueous humor formation rate between the two treatments (Tables 2,3, RE: LR: 3.0 ± 1.3 µL/min, LNR: 3.2 ± 1.1 µL/min, p = 0.3227; LE: LR: 2.8 ± 1.0 µL/min, LNR: 3.1 ± 0.9 µL/min, p = 0.0794). No other measured variates before or after treatment were significantly different between the LR and LNR groups (Tables 2,3).
IOP Responders Versus Nonresponders
15% Responder threshold
There were no differences in baseline characteristics between TR’s and LR’s. More subjects were LR than TR: 54% responded to latanoprost in BE and 27% responded to timolol in BE (pneumatonometry) (p = 0.007). 20% of subjects (21/106) were TNR and LNR in BE (pneumatonometry). 20% of subjects (21/106) were TR and LR in BE (pneumatonometry). The remainder of the subjects responded to one drug or the other, but not both. 5% of subjects (5/106) were timolol-only responders in both eyes, while 30% of subjects (32/106) were latanoprost-only responders in both eyes. Of those that were TNR (n = 56), 39% (22/56) responded to latanoprost in both eyes, 20% (11/56) responded in one eye, and 41% (23/56) did not respond in either eye (Fig. 1a). Of those that were LNR (n = 31), 13% (4/31) responded to timolol in both eyes, 13% (4/31) responded in one eye, and 74% (23/31) did not respond in either eye (Fig. 1a).
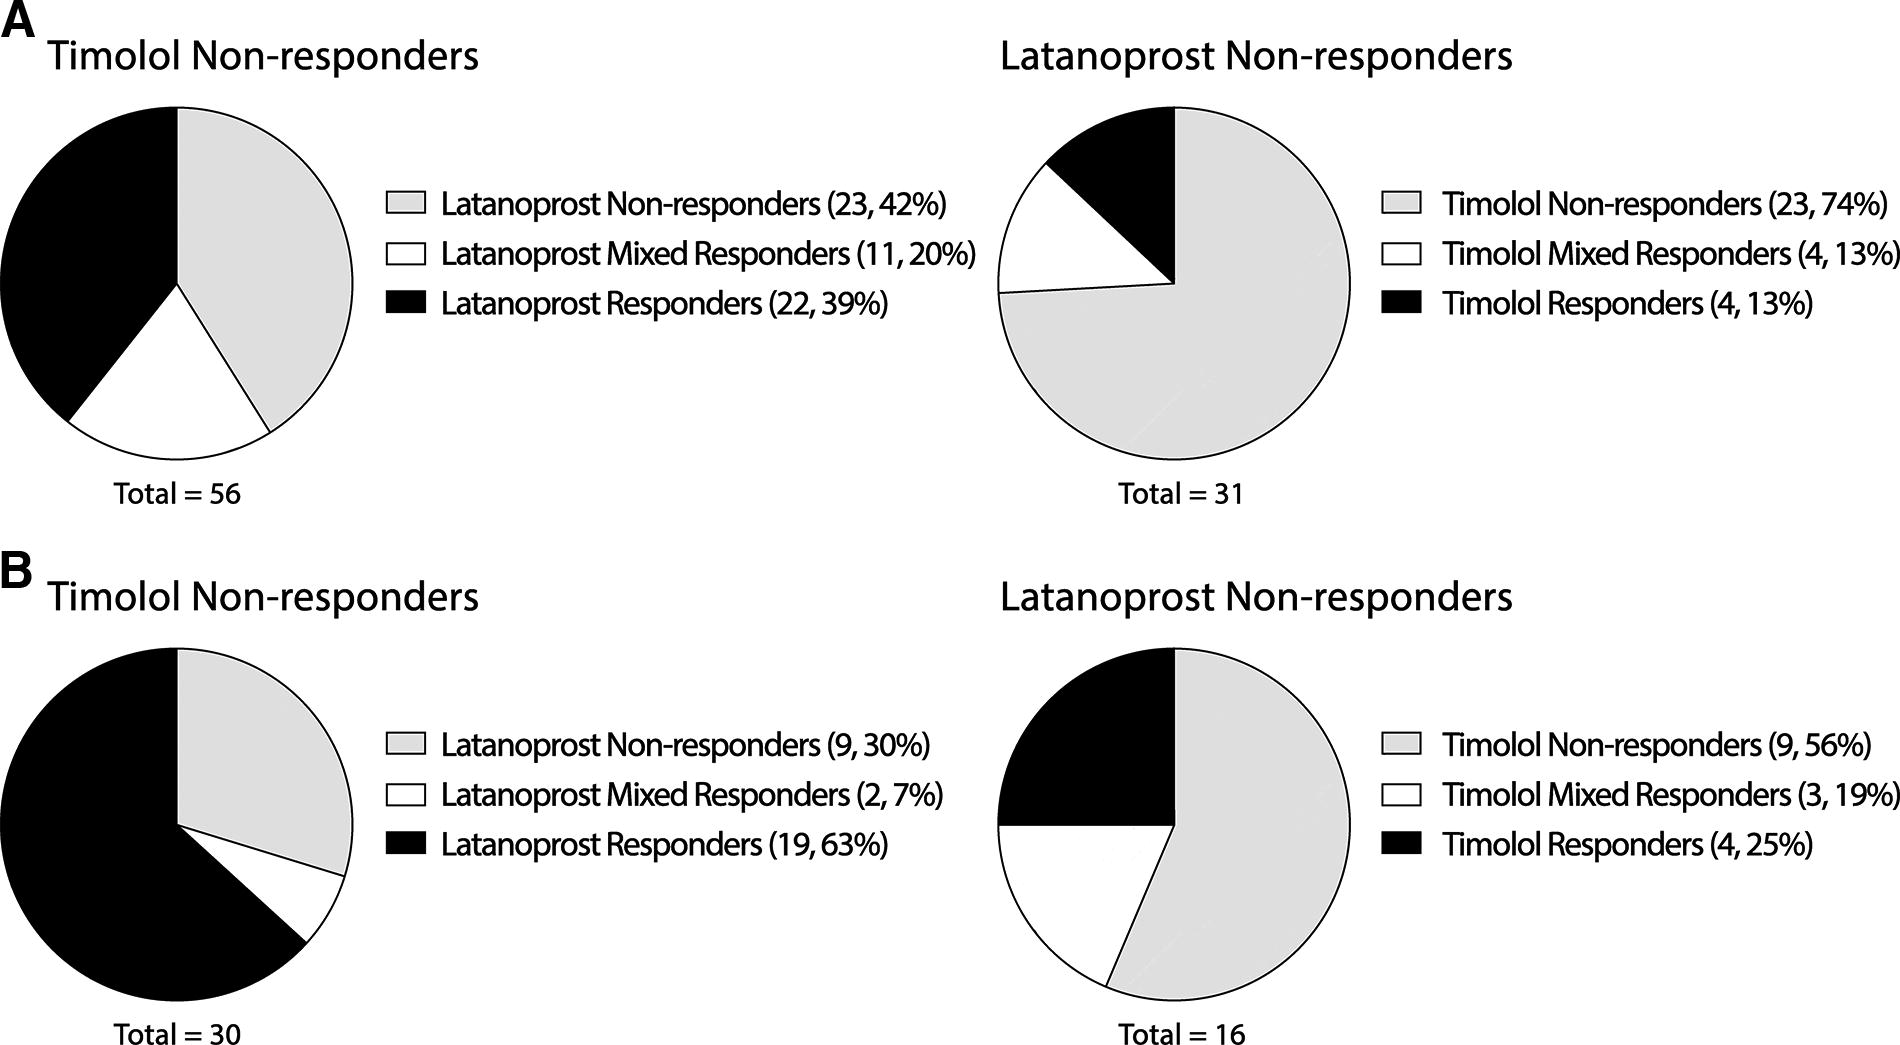
Timolol nonresponders and latanoprost nonresponders (<10% or <15% IOP change with drug), subdivided by the response to the other drug arm. IOP was measured by pneumatonometry. (
10% Responder thresholds
When changing the response cutoff to 10% instead of 15% IOP reduction, 50% (53/106) were TR and 71% (75/106) were LR. 6% of subjects (9/106) were TNR and LNR in BE. 41% of subjects (43/106) were TR and LR in BE. Of those that were TNR (n = 30), 63% (19/30) responded to latanoprost in both eyes, 7% (2/30) responded in one eye, and 30% (9/30) did not respond in either eye (Fig. 1b). Of those that were LNR (n = 16), 25% (4/16) responded to timolol in both eyes, 19% (3/16) responded in one eye, and 56% (9/16) did not respond in either eye (Fig. 1b). There was no significant difference in AHF, ocular biometry, or response category between the 10% and 15% cutoff (all robust p > 0.05).
Blood pressure and ocular biometrics
Blood pressure and ocular biometrics were not different between responders and nonresponders to either drug.
Discussion
This robust crossover trial found greater IOP reduction and response rates with latanoprost compared to timolol in healthy, ocular normotensive subjects. Subjects had a higher chance of responding to latanoprost if they were nonresponders to timolol, but a low chance of responding to timolol if they were nonresponders to latanoprost. We found no concordance of nonresponders to timolol and latanoprost after 1 week of treatment. The only baseline characteristic that could help predict response to either timolol or latanoprost was higher baseline IOP. These eyes had good IOP responses to both timolol and latanoprost and therefore we were unable to identify predictors of response to either drug individually. Changing the cutoff IOP response from >15% to >10% yielded no significant differences in the responder versus nonresponder analyses.
When investigating characteristics of AHD before and after timolol treatment, several interesting results were revealed. We expected to find a decrease in AHF corresponding to a proportional decrease in Fu. Less fluid produced should mean that less fluid is drained. However, this was not found. We also expected to find that eyes with high AHF would have a better IOP response to timolol than eyes with low AHF. This idea was based on studies in which timolol lowered IOP during the day when aqueous flow was high, but not at night when aqueous flow was low.25,26 Instead, we found no difference in AHF or any other parameter of AHD between responders and nonresponders. In addition, we found no difference in ocular biometrics. Multiple factors might be at play in our study, as it is possible that a single factor can negate the effect of other factors. It is likely that there is low predictability in identifying responders and nonresponders when two factors of AHD are affected and negate each other. In the case of timolol, it is AHF and C producing convulted results.
Interestingly, one parameter of AHD, Fu, did show a difference between IOP responders and nonresponders to latanoprost. Since only one AHD factor is acting primarily here, any change in IOP is determined solely by a change in Fu. Uveoscleral outflow before treatment was lower in the responders than nonresponders. Latanoprost could increase Fu when baseline Fu was low but could not increase it when baseline Fu was high. Apparently, there is an upper limit to Fu increase by latanoprost.
A few constraints of the study design are of note. (1) To ensure adequate compliance and follow-up, study subjects were tested for changes in AHD after only 1 week of treatment with latanoprost or timolol. Previous research has shown no further IOP-lowering effect between 1 and 6 weeks of treatment 15 and no change in IOP-lowering effect with either drug from 2 weeks to 4 or 6 months.27,28 Since short-term changes in IOP provide similar information to chronic treatment, we chose the 1-week treatment to shorten this already lengthy study and to minimize nonadherence to the treatment regimen. (2) This study shows differences in AHD and IOP response or nonresponse to timolol and latanoprost in ocular normotensive individuals. Different results may be found in subjects with OHT. These healthy subjects will serve as controls for a separate ongoing study of ocular hypertensive subjects using the same methods and testing the same drugs. Comparing subjects with ocular normotension to those with OHT may show how the disease can affect the response to a drug and how AHD can predict the responder/nonresponder rates. (3) Tonography does have limitations when assessing outflow facilities. It does not account for unique variations among subjects’ eyes, and it uses a previously published reference table to obtain aqueous flow change during the time of IOP change, which is needed to calculate the outflow facility. In addition, the indentation of the cornea from the probe can alter AHF, uveoscleral outflow, and EVP, which can lead to variations in measurement. This is why tonography was the last measurement on the days of the AHD assessment. Even with these inaccuracies, tonography remains the best noninvasive, relatively quick, and repeatable method to collect outflow facility in clinical studies and enables us to compare this study to other studies that use the same method.
In conclusion, our study found that latanoprost is more effective at lowering IOP than timolol in non-glaucomatous, normotensive eyes. Latanoprost was found to be more efficacious at lowering IOP in timolol nonresponders than timolol was at lowering IOP in latanoprost nonresponders. Our analysis did not identify concordance of nonresponse to either drug at an individual level. Low baseline uveoscleral outflow was associated with latanoprost response, but no AHD differences were linked to timolol response. Investigation is underway to identify factors predictive of nonresponse to IOP-lowering drugs in patients with OHT or glaucoma. Because of higher baseline IOP in this group of subjects and expected larger changes with drug treatment, AHD parameters may be more predictive of drug response.
Footnotes
Authors’ Contributions
The authors confirm contribution to the article as follows: Study conception and design: S.E.M., C.B.T., V.G., A.R.S., and D.M.R.; Data collection: S.E.M., C.B.T., V.G., A.K., S.F., and A.S.; Analysis and interpretation of the results: J.C.R., C.B.T., D.M.R., C.P., J.G., S.F., V.G., A.S., and S.E.M.; All authors reviewed the draft article including results and approved the final version of the article.
Data Access Statement
Data from this study can be found at clinicaltrials.gov under the identification number NCT01677507.
Author Disclosure Statement
The authors declare that there is no conflict of interest regarding the subject matter of this article.
Funding Information
This work was supported by the following grants: NEI EY0022124 (PI Moroi University of Michigan), NEI P30 EY007003 (University of Michigan), NIH UL1TR000433 (University of Michigan, Michigan Institute for Clinical and Health Research), Research to Prevent Blindness (University of Michigan and The Ohio State University); NEI P30 EY032857 (The Ohio State University)