
Abstract
Abstract
Aims:
To investigate whether different calculation methods to express fluorescence intensity (FI) as target-to-background (BG) ratio are comparable and which method(s) match with human perception.
Materials and Methods:
Comparison of three calculation methods from current literature (OsiriX®, ImageJ®, and Photoshop®) to objectify FI during laparoscopic cholecystectomy measured at the exact same locations within recorded images of two categories: ex vivo and in vivo. Currently applied formulas to present FI in relation to the BG signal are compared with the subjective assessment by the human observers. These three formulas are Signal contrast = (FI in fluorescence regions−FI in BG)/255; Target-to-background ratio = (FI of target−FI of BG)/FI of BG; Signal-to-background ratio = FI of cystic duct/FI of liver and Target-to-background ratio = (FI of target−noise)/(FI of BG−noise).
Results:
In our evaluation OsiriX and ImageJ provided similar results, whereas OsiriX values were structurally slightly lower compared with ImageJ. Values obtained through Photoshop were less evidently related to those obtained with OsiriX and ImageJ. The formula Target-to-background ratio = (FI of target−noise)/(FI of BG−noise) was less corresponding with human perception compared with the other used formulas.
Conclusions:
FI results based on measurements using the programs OsiriX and ImageJ are similar, allowing for comparison of results between these programs. Results using Photoshop differ significantly, making direct comparison impossible. This is an important finding when interpreting study results. We propose to report both target and BG FI in articles, so that proper interpretation between articles can be made.
Introduction
Intraoperative near infrared fluorescence (NIRF) imaging is gaining both more applications and more users. The current main applications for the use of NIRF imaging with indocyanine green (ICG) in gastrointestinal surgery are: visualization of the cystic duct during laparoscopic cholecystectomy, perfusion assessment of gastrointestinal anastomoses, and lymph node identification.1–5 The growing popularity of NIRF applications is accompanied by an increasing number of (pre)clinical studies published on this topic. In these studies, different applications, different fluorescent dyes, and different methods for reporting the intensity of the signal are used. For objective intercomparison between studies, a uniform objective quantification of the signal is mandatory. For instance, in the application of NIRF angiography, the fluorescent signal is reported in several ways, like: “adequate/sufficient or inadequate/insufficient,” 6 “good, average, or bad.” 7 It is difficult to compare the outcomes of studies when only such subjective evaluation is used. Our research group and many others use objective assessment of the fluorescence intensity (FI). 8 A review we recently performed showed that both different software packages and different formulas are used, still making intercomparison of studies difficult. 9 In random order, these software programs are OsiriX® (Pixmeo, Bernex, Switzerland), ImageJ® (National Institutes of Health, Bethesda), and Photoshop® (Adobe Systems, San Jose). Commonly used formulas in current literature are presented in Table 1.
Applied Formulas as Reported in Literature and Their Results
BG, background; FI, fluorescence intensity.
The aim of this technical note is to investigate whether measurements concerning FI reported in current literature are comparable and matching with human visual perception. A second aim is to evaluate the formulas that are currently used to correct the signal of the target with respect to the signal of the background (BG), and to provide an advice on which formula to use in future research.
Materials and Methods
To explore software packages and formulas used to report FI in laparoscopic cholecystectomy, the results of an earlier performed systematic literature search were used. 9 Twenty eight articles were screened for the use of software packages to measure FI and the applied formulas to quantify the intensity of the signal in the cystic duct compared with the BG fluorescence. The identified software packages were then used in a controlled ex vivo setting to measure the FI of ICG in known concentrations with the laparoscope at a fixed distance. Subsequently, FI was measured using these programs on screenshots made during NIRF laparoscopic cholecystectomies. Finally, with the aforementioned screenshots, the formulas presented in literature were evaluated by assessing which formula corresponded best with the subjective assessment by the observers. See Figure 1 for an overview of study methods.

Overview of study methods. ROI, region of interest; MD, medical doctor.
Analysis of NIRF images obtained during ex vivo experiments
Images from an earlier ex vivo experiment were used. 9 In this ex vivo experiment, ICG was diluted with 35 mg/mL albumin in a 0.9% NaCl solution to known concentrations. For the current experiment, images from dilutions of 5 mg/mL ICG, 0.5, and 0.001 mg/mL were used. For each dilution, nine times 1 mL of the dilution was placed on a wells plate. Images were obtained by making screenshots (Portable Network Graphic [PNG] image) in the videos (mp4) that were made with the laparoscopic system (D-Light-P® Fluorescence system; Karl Storz, Tuttlingen, Germany). For all concentrations, the FI was measured at 5 cm and 9, 10, 11, 12, 13, and 14 cm distances. The FI was measured at three points in the image, by two observers. The points of interest were placed on the exact same location; the exact same pixels were included, in the middle of the wells cup, whereas no light reflections were included in the regions of interest (ROI).
Analysis of NIRF images in laparoscopic cholecystectomy
We randomly selected four laparoscopic cholecystectomies with NIRF imaging; these concern elective procedures performed in the Maastricht University Medical Center (Maastricht, The Netherlands). Screenshots were collected from the surgical videos. In these screenshots, at least the liver and cystic duct had to be visible in fluorescence light. In all screenshots, the FI was measured in three ROIs in the cystic duct, three ROIs in the liver (two on the right of the cystic duct, one left). The regions in the liver were used as BG reference. Three other regions in the surroundings were measured and were assessed as noise. The FI in these ROIs was measured in all programs by two observers and both the gray value and blue value were measured. Again, care was taken that per image, the ROI positions were pixel to pixel aligned on the same locations in all software programs. See Figure 2 for an example on the chosen ROI in a screenshot.
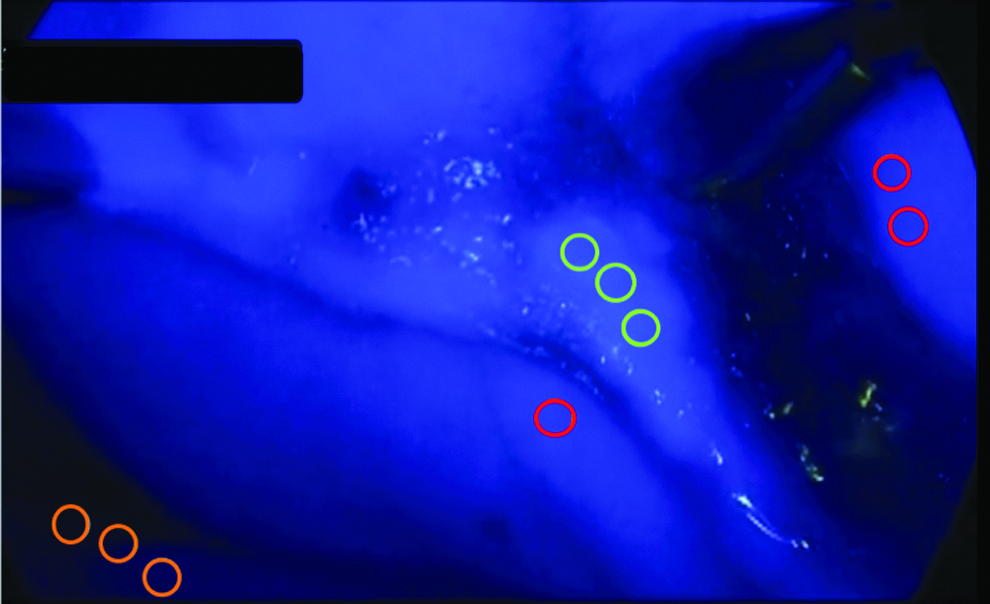
Example of assigned ROI for in vivo fluorescence intensity measurement. The ROIs are color-coded as follows: cystic duct in green, liver (background) in red, and noise in orange. ROI, region of interest.
Determination of a conversion formula for comparison of data from different programs
Measured FI in the respective programs was compared to obtain a conversion formula to enable comparison of obtained FI in the one study with another. Analysis was performed in SPSS version 23 (IBM Corp. Released 2015. IBM SPSS Statistics for Windows, Version 23.0. Armonk, NY: IBM Corp.). First, observations were visualized in a scatter plot. A linear regression analysis was performed to assess how results of one formula could be converted to another. These analyses were initially performed separately for the ex vivo and the in vivo measurements. Then, agreement was quantified using an intraclass correlation coefficient and linear regression analysis.
Comparison of the objectively measured and calculated FI with subjective assessment
The assessed screenshots from the aforementioned NIRF laparoscopic procedures were ordered from “very clearly visible fluorescent delineation” of the cystic duct compared with the surroundings to “weak fluorescence” of the cystic duct compared with the surroundings based on the opinion of three experts. This subjective assessment was compared with the results from filling in the formulas identified from literature for both the measured gray values and the measured blue values. The FI and BG intensities used, therefore, were measured with OsiriX. A difference in ranking of more than five places was considered a mismatch. A ranking score within five places was scored as an accurate match between subjective order and calculated order with the respective formula. The used ROIs were the same for all four formulas as the example in Figure 1. The ROIs from both observers were filled in all formulas.
Results
Programs used to objectively measure FI
In the literature, three software programs were identified for objective quantification of the signal, namely OsiriX,2,8,10–12 ImageJ,13–15 and Photoshop CS. 16 OsiriX, ImageJ, and Photoshop were used in five, three, and one, respectively, of the reviewed studies.
Ex vivo NIRF imaging analysis
Twenty-one images were analyzed for the three ICG concentrations (5, 0.5, and 0.001 mg/mL) at different distances. Because two observers analyzed three points in every image, a total of 126 points were analyzed. As shown in Figure 3, the values obtained with ImageJ are very strongly related to the FI measured with OsiriX (Intraclass correlation coefficient = 1.0; R2 = 0.9999; P < .001). With the regression analysis, a formula was obtained to convert the measured value from ImageJ to a value when OsiriX would have been used:

Relation between measured fluorescence intensity using ImageJ® and OsiriX in ex vivo images.
Value measured with OsiriX = −0.44 + 0.98 (value measured with ImageJ).
In reverse, the formula value for conversion from OsiriX to ImageJ would be:
Value measured with ImageJ = 0.46 + 1.02 (value measured with OsiriX).
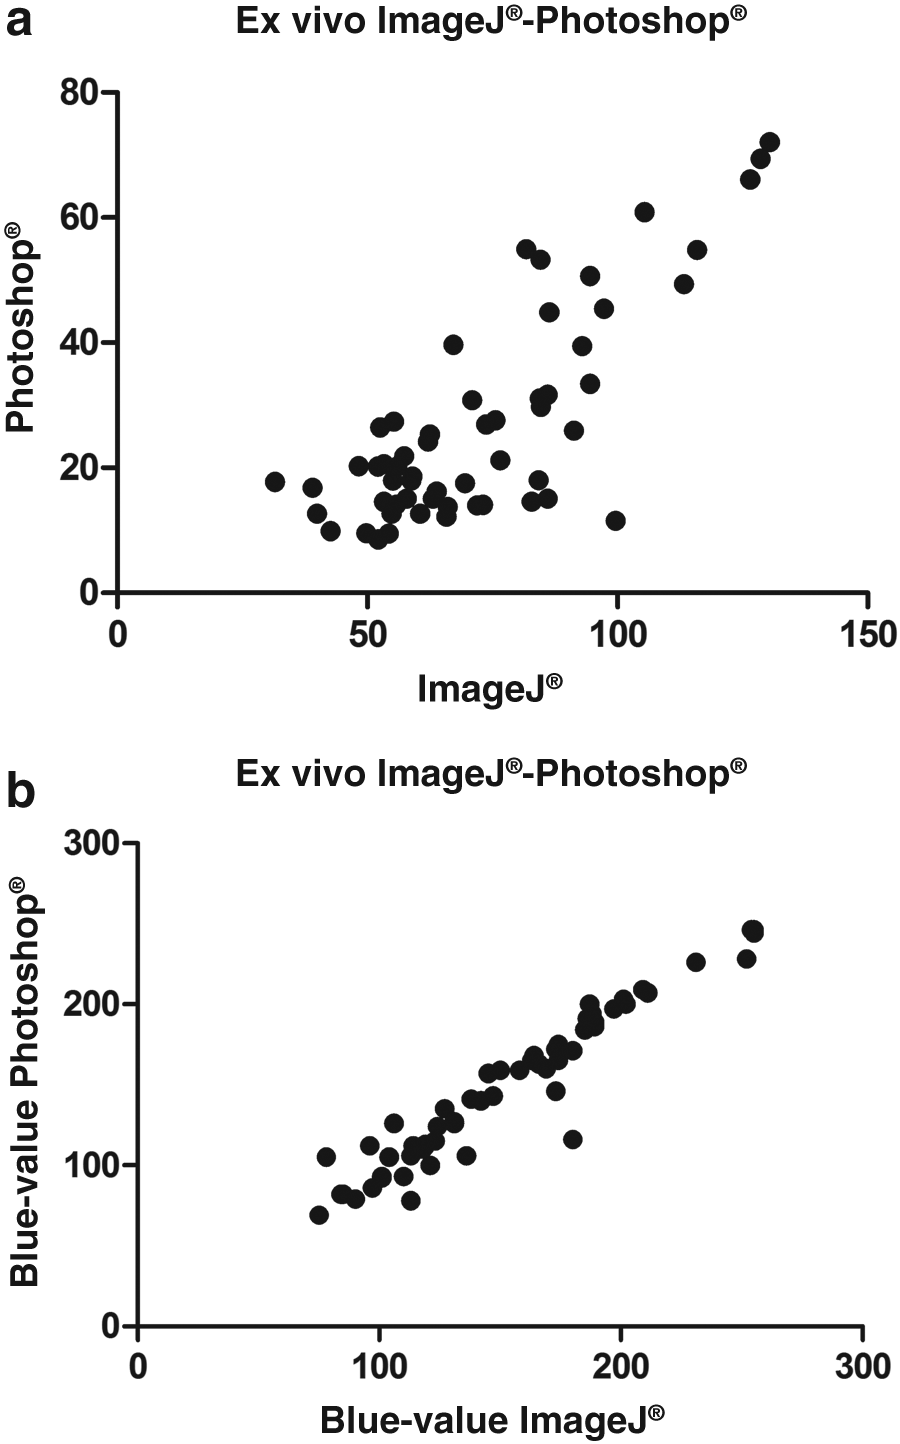
When comparing the values obtained with OsiriX with the values obtained with Photoshop, also a statistical significant relation between results was found, however, with a lower interclass correlation coefficient (interclass correlation coefficient = 0.78; R2 = 0.93; P < .001). As shown in Figure 4, no obvious straight line is formed by the data points obtained with Photoshop and OsiriX (in contrast to comparing between OsiriX and ImageJ). Therefore, no straightforward formula to convert between values derived from OsiriX versus Photoshop could be obtained using a regression analysis. An approximate conversion formula based on a linear regression analysis would be:
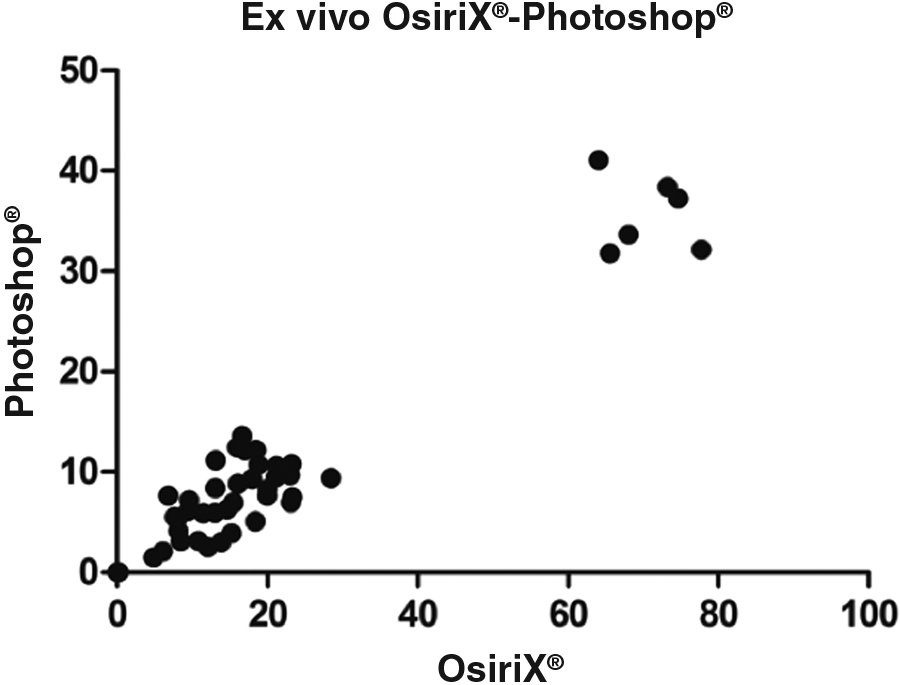
Relation between measured fluorescence intensity using Photoshop® and OsiriX® in ex vivo images.
OsiriX = 1.26 + 1.88 (value measured with Photoshop)
The inverse approximate conversion would be:
Photoshop value = 0.01 + 0.49 (value measured with OsiriX)
Note that values obtained with OsiriX are on average roughly two times as high as values measured with Photoshop (while using the same FI as input).
Comparing measured FI values between Photoshop and ImageJ, a similar statistical significant relation is found (interclass correlation = 0.78; R2 = 0.93; P < .001). This relation is shown in Figure 5:
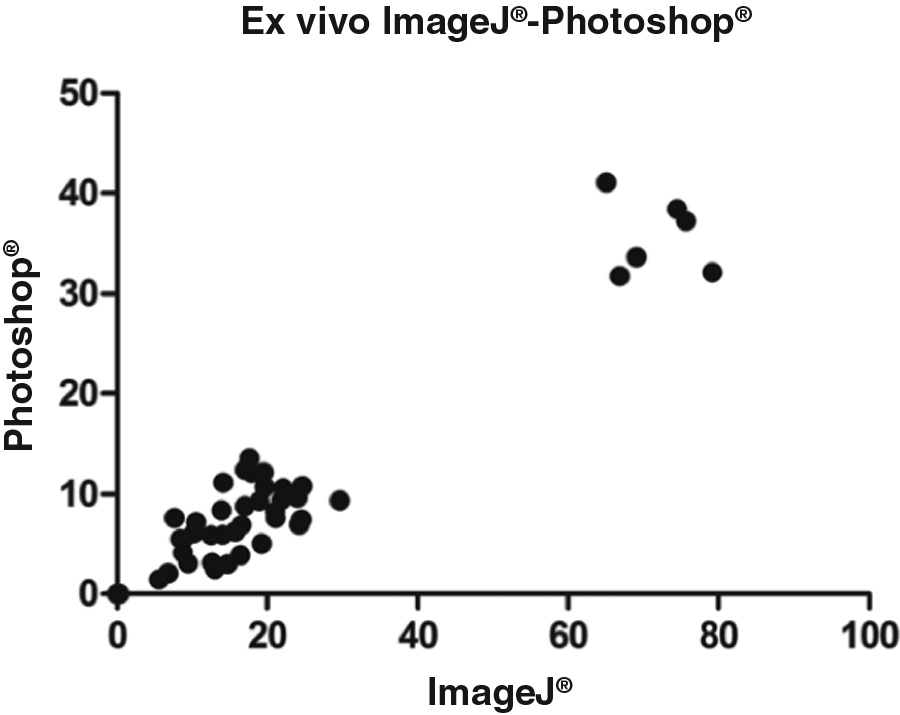
Relation between measured fluorescence intensity using Photoshop and ImageJ in ex vivo images.
Value obtained with ImageJ = 1.88 + 1.90 (value obtained with Photoshop).
With the corresponding inverse approximate conversion:
Value obtained with Photoshop = −0.26 + 0.49x (value obtained with ImageJ).
In vivo NIRF imaging analysis (from laparoscopic cholecystectomy)
Eighteen screenshots in 4 patients were analyzed. These patients all underwent elective laparoscopic cholecystectomy for symptomatic cholecystitis. In these images FI was measured on exact the same ROIs with the three software programs, with two sets of ROIs chosen independently by two observers. Comparing OsiriX and ImageJ based on the measured gray values in the images, revealed a very strong correlation (intercorrelation coefficient = 1; R2 = 1; P < .001), and when data are plotted, a straight line can be drawn between the points, as is shown in Figure 6. The conversion formulas from linear regression analysis between OsiriX and ImageJ are:
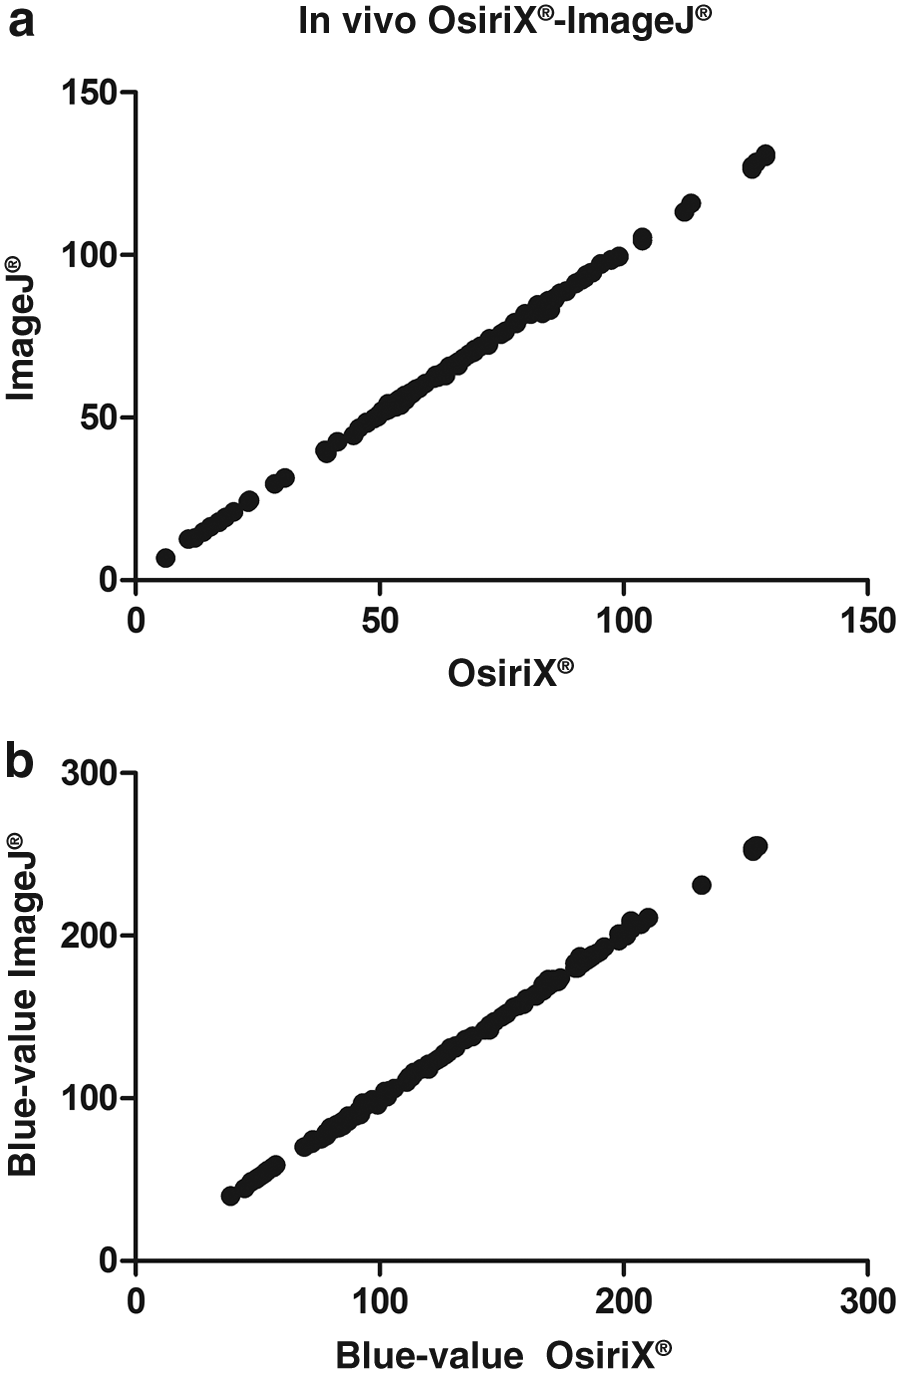
Relation between measured fluorescence intensity using ImageJ and OsiriX in in vivo images for both gray value and blue value.
OsiriX = −0.69 + 1.00 (value obtained with ImageJ), and
ImageJ = 0.75 + 1.00 (value obtained with OsiriX)
When measuring the blue values, a perfect correlation (interclass correlation = 1; R2 = 1.00; P < .001) was found with the following conversion formulas:
Blue value OsiriX = 0.42 + 1.00 (blue value obtained with ImageJ), and
Blue value ImageJ = −0.30 + 1.00 (blue value obtained with OsiriX)
In the in vivo experiments, statistically there seems to be a relation between the values measured in Photoshop and OsiriX (interclass correlation = 0.76; R2 = 0.63; P < .001). However, as shown in Figure 7, no straightforward conversion formula can be identified to compare between studies.
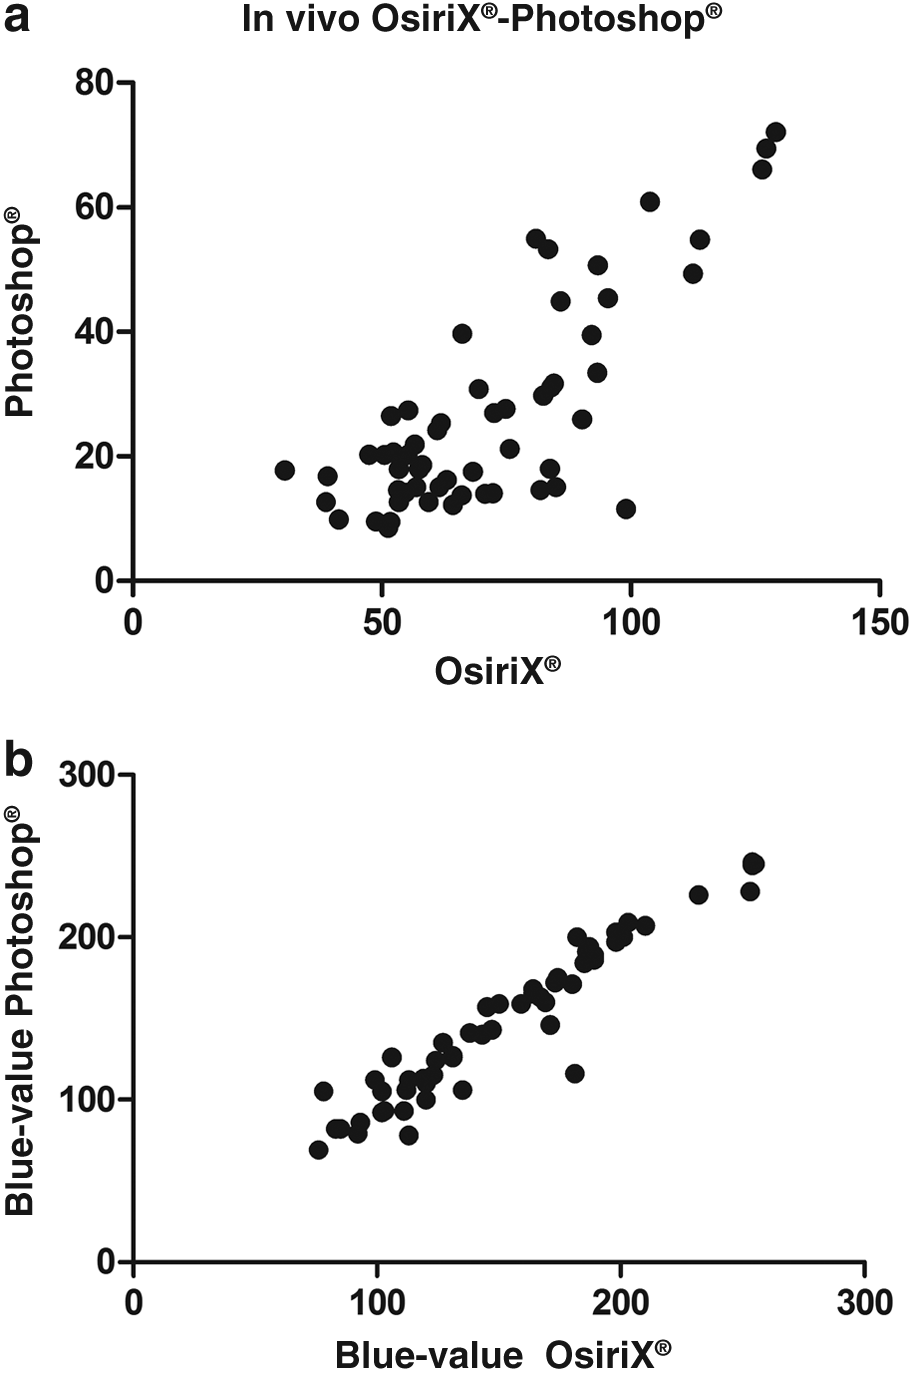
Relation between measured fluorescence intensity using Photoshop and OsiriX in in vivo images.
This is the same for Photoshop and ImageJ (interclass correlation = 0.76; R2 = 0.63; P < .0001), see also Figure 8.
Relation between measured fluorescence intensity using Photoshop and ImageJ.
For the blue values, outcomes are comparable. Between OsiriX and Photoshop an interclass correlation of 0.96 was found (R 2 = 0.92, P < .001), between ImageJ and Photoshop, the interclass correlation was 0.96 (R 2 = 0.93, P < .001).
Reported formulas for assessment of FI
As mentioned, the FI in the articles is often presented using a formula. The four formulas identified are reported in Table 1.
Using the described method, the formula Signal contrast = (FI in fluorescence regions−FI in BG)/255 seemed to be the most comprehensive with what the experts reported as their visual perceptions. However, as shown in Table 1, differences are small.
As the formulas were applied to gray values in color images with fluorescence in blue, we also tested these formulas using the blue value. From this refinement, also the formula Signal contrast = (FI in fluorescence regions−FI in BG)/255 emerged as showing the strongest match with the subjective order of FI of the ductus. However, the formula Signal-to-background ratio = FI of cystic duct/FI of liver was somewhat more accurate than Target-to-background ratio = (FI of target−FI of BG)/FI of BG.
Discussion
Despite an increasing number of publications in the field of NIRF imaging, no standard yet exists for objective assessment of fluorescence images. This problem has recently been highlighted by reports from the American Association of Physicists in Medicine (AAPM). 18 Different software packages are used to quantify the fluorescent signal, and also different formulas are applied to correct for the BG fluorescence. The latter is important, as for human visual perception not only the absolute signal of the target is important, but also the contrast in relation to its surroundings. Such a formula actually is an imitation of the human visual perception system that naturally uses such contrast for object identification. In the present study we focused on two goals. First, to investigate whether different software packages used for measuring FI reported in the current literature yield comparable results. Second, to identify the formulas used in literature to calculate a target-to-background ratio and try to provide an advice on what formula to use in future research for comparison of studies.
In our ex vivo analysis, a very clear relation between values measured with OsiriX and ImageJ was detected. The values obtained with OsiriX were ∼0.5 units lower than those obtained with ImageJ. The relation between the values from Photoshop and from the other two programs was less evident as illustrated by a lower correlation coefficient.
From our in vivo images, a slightly different conversion factor between OsiriX and ImageJ was observed. This may be due to the fact that images from an operative field are less standardized and influenced by subtle differences in scattering and light intensity. A possible explanation for the differences in correlation between the results from the different programs is a difference in measuring which is probably more likely to occur when using Photoshop. It is our experience that it seems more difficult to exactly select the same pixels for analyzing the ROI. The various applied analysis programs were treated as a black box within this study. However, the software that provides results that are matching well with human perception seems to be more promising than others.
Apart from differences in used software, different formulas are used to present the FI. It is essential to take the signal from the surroundings due to uptake of the dye into account, because this influences the contrast as observed by the surgeon. 9 When using a formula, the influence of the BG is taken into account and thereby might provide a number more consistent with human perception. Several formulas are used that use target and BG signal, but in different dependency. It is difficult to decide on theoretical grounds which approach is best. Some points of attention should be kept in mind. Of course, the ROI's should be chosen carefully, reflecting the signal of the subject best. Next, when using a formula, the distance between the laparoscope and the BG should be about the same as the distance between the target and the laparoscope. An observation, for which the present way of measuring does not correct, is the fact that a small darker zone is observed surrounding the cystic duct, which influences the observed contrast, but is not taken into account when taking the liver as BG.
In current literature, four different formulas were found. We tested these formulas against the assessment by the human eye. One formula seemed to be most accurate. This was the formula used by Kono et al., 16 namely Signal contrast = (FI in fluorescence regions−FI in BG)/255. However, even though this was the best of the four formulas, there was not a 100% match between the subjective order and obtained order with this formula and differences with the other formulas were small. The only deviating formula was the formula Target-to-background ratio = (FI of target−noise)/(FI of BG−noise), which provided results less compatible with human perception. Most likely this is due to the noise which is taken into account in this formula. The cystic duct is often directly surrounded by a dark signal due to the shape of the cystic duct and shows more light reflections compared with the liver. Therefore, this cystic duct is sometimes easily recognizable with the naked eye than what is suggested by the outcomes of the formulas. Based on these observations it is not possible to advice one formula or the other. From our own experience, it is of great importance, independent from the formula used, that the ROI for signal analysis, are very carefully chosen. In the digital image, as discussed earlier, subtle differences in signal intensity and scattering occur within the same ROI, for example the cystic duct.
Both OsiriX and ImageJ measure the intensity of the signal on a gray scale. However, the fluorescence signal is most often presented in color images, especially in blue or green. The equipment used in the present study gives a blue image for fluorescence. This is the reason why not only the gray values but also the blue values were measured. However, we observed comparable outcomes using both methods. These results may be influenced by the fact that the used fluorescence system gives a very dark BG, hardly without any observable color. The BG reference values and therefore the results of the formula might have been different when had been used that contains a more mixed light source, filtering out less of the white light and therefore showing more of the environment.
A limitation of this study is that no uniformity existed in the equipment used between studies nor in the exact application of the technique. There are more relevant factors of influence than only the software used.16,19 The equipment itself, the used laparoscope, and the software in the laparoscopic system is of influence. Also, the timing of the application of the dye yields different results. As is shown in earlier studies, a longer time between ICG administration and assessment causes a more fluorescent cystic duct compared with the liver than an injection just 30 minutes before assessment.13,14 And last, probably the most important factor is the selection of the ROI's and the BG, which is a subjective action. We advocate minimizing this influence by choosing three points in both target and BG and use the mean value of these three. However, the risk for selection bias remains.
Conclusion
When comparing fluorescence values obtained from analysis with different programs, this is easiest with those from OsiriX and ImageJ. A conversion with a correction factor as indicated in this article is possible, enabling the reader to interpret the presented values correctly. The relation between these two programs and Photoshop is less clear, hindering comparison of results. Furthermore, to overcome the present use of different formulas by different authors to further evaluate the signal, we propose to report both ROI and BG FI in the article. This enables calculations to be made between articles independently of the preferred formula by the authors. Lastly in interpreting results, other influences on the FI and the risk for selection bias in chosen ROI for evaluation of the signal should be taken into account.
Footnotes
Disclosure Statement
No competing financial interests exist.