
Abstract
Background:
Many methods can quantitatively assess limb lymphedema, but methods to assess breast edema/lymphedema are quite limited. Thus, there is a need for a convenient and accurate way to quantify and track changes in this condition. Herein, breast tissue dielectric constant (TDC) values that depend on tissue water were used to obtain reference TDC values and interbreast TDC ratios.
Methods and Results:
TDC was measured in both breasts of 61 women who were about to undergo an ultrasound-guided diagnostic biopsy of a single mass (tumor) in 1 breast. Patient age and body mass index were (mean ± SD) 65.1 ± 11.6 (41–87 years) and 28.9 ± 5.1 (19.1–43.7 kg/m2). TDC was measured at a standardized site (12 o'clock position) with the TDC probe placed with its outer edge at the periphery of the subareolar region. TDC values of healthy breasts versus tumor breasts showed tumor breasts 3% greater (30.4 ± 4.6 vs. 29.5 ± 4.6, p = 0.02). Patients with benign tumors (N = 33) showed no difference between breasts (30.5 ± 4.4 vs. 30.8 ± 4.6 p = 0.434) and had an interbreast TDC ratio (tumor breast/healthy breast) of 1.013 ± 0.077. Patients with malignant tumors (N = 28) had tumor breast values 5% greater (29.8 ± 4.8 vs. 28.4 ± 4.6, p = 0.018) and an interbreast ratio of 1.056 ± 0.117. The overall interbreast ratio (N = 61) was 1.033 ± 0.099.
Conclusion:
Breast TDC values from nonedematous breasts provide the basis for calculating potential edematous/lymphedematous threshold values based on the measured means +2.5 standard deviation (SD). Accordingly, a TDC threshold value of 41 and an interbreast ratio of 1.28 were determined. These parameters have potential applicability for early detection in at-risk patients and those suspected of having breast edema/lymphedema.
Introduction
Breast edema as a consequence of breast cancer and its treatment occurs with an incidence ranging from 10% 1 to about 90% 2 depending on treatment type, assessment method, and time from treatment end. Prior work based on combined clinical assessments 3 and ultrasonography 4 indicated that both axillary surgery extent and radiotherapy were main contributors to early onset of breast edema. The importance of axillary node disruption was not unexpected given their prominent role in breast lymphatic drainage. 5 In a more extensive investigation of 836 women treated for breast cancer with breast-conserving surgery and subsequent radiotherapy, patient-reported breast edema was greatest at 6 months posttreatment with 12.4% reporting breast edema and 24.8% reporting breast edema at some time during a 28-month follow-up. 6 An issue that occurs with assessing breast edema is the absence of a uniformly used measure or criteria. Self-reported assessments often use survey questions as to patient perceptions 6 and symptoms, 7 whereas other assessments include high frequency ultrasound to assess breast skin thickness, 8 elastography to assess changes in tissue properties, 9 and in some cases, use is made of formulas for calculating breast volume changes.10–12 Other workers have introduced tissue dielectric constant (TDC) measurements as a potentially simple, yet, rapid method to assess breast edema after breast conserving surgery and radiotherapy.13–15
The TDC method is perhaps the only method that can provide a useful index of tissue water locally and hence be quite useful in the quantitative assessment of breast edema. However, until now, there does not appear to have been a systematic study aimed at characterizing TDC values of breast tissue before surgical or other interventions. It is the purpose of this report to help fill this gap in our knowledge.
Methods
Subjects
Participants were 61 women who had a mass (tumor) in 1 breast and who were scheduled to have a diagnostic biopsy. Overall ages and body mass index expressed as mean ± standard deviation (SD) and (ranges) were 65.1 ± 11.6 (41–87 years) and 28.9 ± 5.1 (19.1–43.7 kg/m2). Entry requirements into this study were that they be at least 18 years of age and have either a nonpalpable or palpable breast mass that had been identified as abnormal by mammographic, ultrasound, and/or MRI imaging modalities and were planning to undergo a diagnostic surgical biopsy. Exclusionary conditions were (1) the presence of nonintact skin at the planned breast measurement site, (2) a history of prior breast cancer or breast surgery or radiation therapy, (3) a history of breast implants or having undergone breast augmentation or reconstructive surgery, (4) having a pacemaker or any implantable devices or wires, and (5) currently pregnant. This study was approved by the Nova Southeastern University Institutional Review Board (IRB, 2019-7-Non-NSU-Health) and registered with ClinicalTrials.org (NCT04561297). Women were evaluated after reading and signing an IRB approved consent. Pertinent patient demographics, tumor features and biopsy results are shown in Table 1. Benign tumors were present in 33 patients (54%) and malignant tumors in 28 (46%). Patients with malignant tumors were older (69.9 ± 10.2 years) than those with benign tumors (69.9 ± 10.2 years, p < 0.01 via Mann–Whitney test). The volume of the malignant tumors was also greater (1.43 ± 3.4 mL vs. 0.36 ± 0.69 mL, p < 0.01). Upper breast quadrants (inner+outer) accounted for 74% of all tumors.
Patient and Tumor Features
Patients with malignant tumors were older and had larger tumors (**p < 0.01 Mann–Whitney test).
Upper quadrants (inner+outer) accounted for 74% of all tumors. Tumor quadrants (A through D) are illustrated schematically in Figure 2.
BMI, body mass index.
Standard measurement site
Measurements were made at standardized sites on both breasts of women scheduled to undergo an ultrasound-guided diagnostic biopsy of one breast. The breast to be biopsied is referred to as the tumor breast and the nonaffected breast is referred to as the healthy breast. During measurements, the patient was in a supine position with the head of the bed adjusted to a 30° angle. For the measurement, the patient's arms were positioned at her side. The standardized site on both breasts was selected to be at the 12-o'clock position of the breast. For finer positioning the 23 mm diameter TDC probe used for the measurements (Fig. 1) was placed with its outer edge lined up to the periphery of the subareolar region of each breast as illustrated in Figure 2. Room temperature during the measurements was set at 22°C.

TDC measuring device in use, the probe is placed on the breast standard site as shown in Figure 2 to obtain triplicate TDC measurements on both breasts. A single measurement takes about 7 seconds and the value is shown on the digital readout. TDC, tissue dielectric constant.
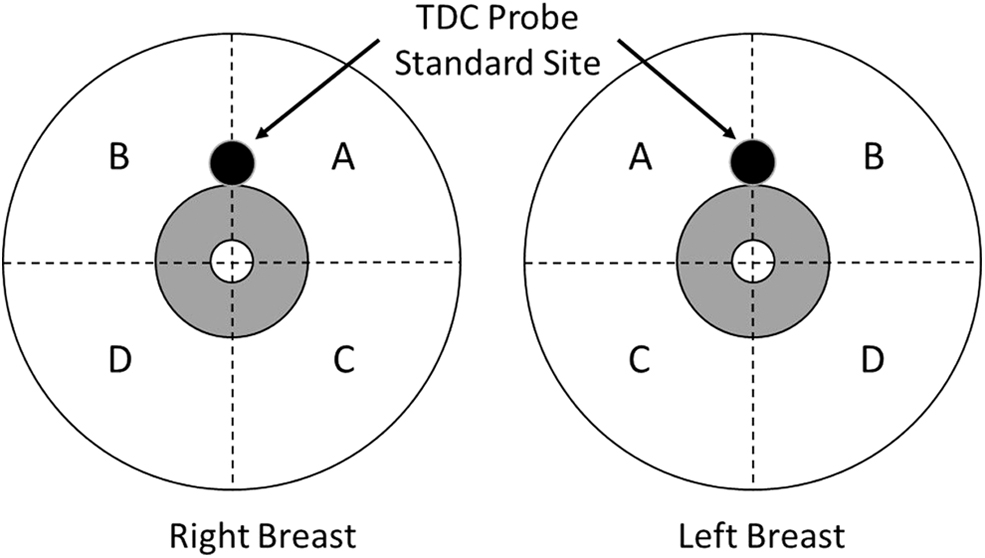
Standard site measuring locations right and left breasts schemas showing four quadrants for reference. Quadrants A through D are, respectively, upper inner, upper outer, lower inner, and lower outer. These are used in the text (Table 1) to indicate the location of the tumors.
TDC measurements
TDC was measured in triplicate at each standard site using a hand-held 20 mm diameter cylindrical probe that was connected through a coaxial cable to a control box (MoistureMeterD, Delfin Kuopio, Finland). Each TDC measurement took about 7 seconds and was triggered when the probe contacted the skin. Measurements were started after the patient had been supine for at least 5 minutes. The TDC device displayed the measured TDC value obtained at a frequency of 300 MHz. For reference, water's dielectric constant is about 76 at 32°C. Calibrations are done by measuring the dielectric constant of various concentrations of ethanol–water solutions and comparing against known dielectric values. The physics of this method is well described in the literature.16–21 In brief, the TDC probe in contact with skin acts as a coaxial transmission line through which a signal is transmitted to the tissue. Some signal is absorbed and some reflected back to be processed by the control unit. Reflected energy depends on the tissue's complex permittivity, which depends on signal frequency and on the dielectric constant (real part of the complex permittivity) and tissue conductivity. At 300 MHz, the contribution of the conductivity to permittivity is small and the dielectric constant is mainly determined by water molecules (free and bound). This method has been used extensively in a variety of applications22–34 with its validity evaluated on arms 21 and on legs. 35 The probe used had an effective measurement depth of 2.5 mm.
Analysis
Triplicate TDC measurements were averaged to get one TDC value for each breast's standardized site. Values were tested for normality with the Shapiro–Wilk statistic. The coefficient of variation (CV) of the three measurements per standard site was determined for each patient and an overall measurement CV calculated for all patients and separately for healthy breasts and tumor breasts. The standard site interbreast TDC ratio was defined as the ratio of the tumor breast TDC value divided by the healthy breast TDC value. Comparisons between breasts were based on paired t-tests with a statistically significant difference accepted at a p-value <0.05. Results are presented as mean ± SD unless otherwise noted.
Results
Standard site TDC values and inter-breast ratios
The Shapiro–Wilk test showed no significant departures from normality for standard site TDC values measured on healthy breasts (p = 0.612) or tumor breasts (p = 0.989). Comparisons of TDC values between healthy breasts and tumor breasts (N = 61) showed a slightly (3%) greater value on tumor breasts (30.4 ± 4.6 vs. 29.5 ± 4.6, p = 0.02). Patients with benign tumors (N = 33) showed no difference between their healthy versus tumor breasts (30.5 ± 4.4 vs. 30.8 ± 4.6, p = 0.434). For these patients, the interbreast TDC ratio (tumor breast/healthy breast) was 1.013 ± 0.077. For patients with malignant tumors, TDC values of tumor breasts were greater (5%) (29.8 ± 4.8 vs. 28.4 ± 4.6, p = 0.018) and had an interbreast ratio of 1.056 ± 0.117. Interbreast TDC ratios at standard sites did not differ between patients with benign versus malignant tumors (p = 0.106). Combining groups (N = 61) resulted in an interbreast ratio of 1.033 ± 0.099.
Standard site TDC coefficients of variation
The average CV of triplicate TDC measurements at the standard site on healthy breasts was 3.0% ± 2.2% and on tumor-carrying breasts was 3.5% ± 2.9%. For patients who had benign tumors (N = 33) the CV on the healthy breast was 3.0% ± 2.5% and 3.5% ± 2.5% on the tumor-carrying breast. For patients who had malignant tumors (N = 28), the CV was 3.0% ± 1.9% on the healthy breast and 3.0% ± 2.2% on the tumor-carrying breast.
Discussion
One of the first applications of TDC measurements to characterize breast edema was done by averaging TDC values derived from measurements made in each of four breast quadrants. 13 This yielded one average TDC value to characterize each breast. With this approach, measurements in 15 healthy women resulted in a wide range of TDC values (19.8–39.4). The magnitude of this variance in values led the investigators to conclude that absolute TDC values would not be useful to detect the presence of breast edema. The reported average value for these 15 healthy women was 29.6 (SD not specified). In the present study TDC values were obtained at a standardized site and for that site TDC values of the nonaffected breast of 61 women showed a similar TDC range (19.9–43.8) with an overall mean ± SD of 29.5 ± 4.6 and a 95% confidence interval between 28.3 and 30.7. Thus, the present data suggest that measuring breast TDC at a single timepoint is likely to be inadequate as a threshold to generally estimate the presence of breast edema in its early stages unless findings are carefully interpreted.
However, absolute TDC values may be useful as a lymphedema index and perhaps more importantly, to track changes in breast edema with time or treatment. For this purpose, a conservative initial edema threshold, based on the present data, can be calculated as the overall mean TDC value (29.5) + 2.5SD (2.5 × 4.6). Such a threshold would include about 99% of new cases. The result of this calculation is a breast edema threshold value of 41. Thus, a TDC value of 41 would, with high confidence, suggest the presence of breast edema.
Further, if TDC values were obtained before surgery or before radiotherapy, then absolute values might be useful to look for a change that is indicative of breast edema development in a given individual. For this purpose, it would be useful to know the minimum detectible change (MDC) in TDC values either in absolute or percentage terms. The percentage change in breast TDC value that might so indicate is unclear but might be estimated based on MDC values previously assessed at forearm and hand thenar eminence. 36 These prior measurements indicate an average MDC of 4–5 TDC units that corresponded to a 12.6% change as the MDC percentage. Based on this, and recognizing that breast tissue differs, an initial suggestion for a threshold change in breast TDC that would indicate edema is developing would be a 15% increase from a prior measurement. However, further study is required and warranted to specifically assess the MDC for breast tissue.
In addition to absolute TDC values, interbreast TDC ratios may be used when possible to help compensate for individual variations in absolute TDC values. Such interside ratio values have been documented for arms,37–39 hands,26,40 the trunk,41,42 and for legs.43,44 The first use of affected/control side ratios to assess breast edema was to evaluate radiation treatment (RT) effects on patients who had been previously treated surgically for breast cancer.13,15 These workers reported that of 118 women who were evaluated about 8 weeks after their breast surgery, but before their RT, TDC values of the affected breast was significantly elevated. The interbreast ratios ranged from 1.29 to 1.36 depending on the specific surgery. 13 Using a ratio of 1.4 as their threshold for unilateral breast edema, they reported that 31.4% of patients had breast edema before RT and that the ratio increased to 62.6% when measured 4 weeks after completion of RT. The present results obtained from nonedematous breasts indicate an interbreast threshold ratio (tumor breast/healthy breast) of 1.28 based on a mean ratio of 1.033 ± 0.099. Subsequently, similar breast TDC measurements have been used to assess the efficacy of breast compression to reduce breast edema acquired following both breast surgery and RT. 14
More recently, a group of 10 patients with breast lymphedema following breast cancer and its treatment was evaluated using both indocyanine green lymphography and TDC measurements. 45 Percentage water in lymphedematous breasts was reported based on TDC measurements with a compact device similar to that used in the present study. This device has an effective measurement depth somewhat less than for the present device. 46 These workers reported upper quadrant water percentages (%water) in nonaffected breasts to range between 36% and 41% depending on breast quadrant. Contrastingly, in lymphedematous breasts values up to 55% were reported. These water percentages relate to TDC values measured in the present study via the approximate equation TDC = 0.8% water. Thus, a reported % water of 41% corresponds to a TDC value of 32.8, and a 55% value (lymphedematous) corresponds to a TDC value of 44. Noteworthy is the fact that this measured value exceeds the conservative edema threshold value (41) herein calculated giving some support to its generalizable utility.
A somewhat less conservative threshold estimate might be based on 2SD. When used in the present case yields a threshold of 38.7, which is still greater than TDC values (27.5 ± 3.6) of healthy breasts of patients with unilateral breast edema. 14 Moreover, these workers reported average TDC values for breast cancer-related breast edema as 47.9 ± 7.8, a value consistent with the threshold herein proposed. Finally, it should be noted that in contrast to prior reported data obtained from women after breast cancer and surgery or RT, the present study investigated women in whom no breast cancer treatment had been given before TDC breast measurements. Thus, the present breast TDC data reflect normal or near-normal breast values and the thresholds from which these were determined reflect this condition.
Conclusion
Breast TDC values obtained from healthy and nonedematous breasts yielded reference values representative of normal or near-normal values from which potential edematous or lymphedematous threshold values were derived. An absolute TDC threshold value of 41 was determined based on a 2.5SD increase. This value is consistent with prior TDC measurements of lymphedematous breasts. Further, using the 2.5SD criterion, an interbreast threshold ratio of 1.28 was determined. This ratio threshold has potential applicability for early detection in at-risk patients and those having or suspected of having unilateral breast edema or lymphedema.
Footnotes
Acknowledgments
The authors thank the many patients for their cooperation and participation, without which this research would not have been done. The assistance of Paige Spagna, DO, in some of the early organization parts of this research is gratefully acknowledged.
Authors' Contributions
All authors contributed to and reviewed this article and approved the final article.
Author Disclosure Statement
No competing financial interests exist.
Funding Information
No funding was received for this article.