
Abstract
Background:
An adequate dietary energy supply is particularly important in patients with lipedema as it promotes weight and fat loss. Accurate estimation of resting metabolic rate (RMR) allows implementing a proper calorie restriction diet in patients with lipedema. Our study aimed to compare actual resting metabolic rate (aRMR) with predicted resting metabolic rate (pRMR) in women with lipedema and to determine the association between individual body composition parameters, body mass index, and aRMR.
Methods and Results:
A total of 108 women diagnosed with lipedema were enrolled in the study. aRMR was obtained by indirect calorimetry (IC) using FitMate WM metabolic system (Cosmed, Rome, Italy). pRMR was estimated with predictive equations and bioelectric impedance analysis (BIA). All body composition parameters were based on BIA. The mean aRMR in the study group was 1705.2 ± 320.7 kcal/day. This study found the agreement of predictive equations compared to IC is low (<60%). Most methods of predicted RMR measurement used in our study significantly underpredicted aRMR in patients with lipedema. Therefore, the most applied equations remain useless in clinical practice in this specific population due to large individual differences among the studied women.
Conclusions:
IC is the best tool to evaluate RMR in evaluated patients with lipedema. It is necessary to propose a new equation to RMR determination in clinical practice.
Introduction
Lipedema is a chronic lymphovascular disease almost exclusively found in women, which manifests as an excessive accumulation of subcutaneous adipose tissue. 1 It is characterized by pain and bilaterally symmetrical accumulation of adipose tissue, particularly in the lower part of the body, excluding feet. 2 Lipedema is associated with functional alterations of the lymphatic vasculature. An apparent contribution of lymphatic malfunction is observed. 1 Lipedema is estimated to affect ∼11.0% of women worldwide. 3 Lipedema is often misdiagnosed as lymphedema or obesity, although patients with lipedema may be also obese.4,5
Obesity increases the risk of lipedema progression or developing obesity-related diseases, such as cardiovascular disease, type 2 diabetes, and osteoarthritis. Therefore, weight loss in patients with lipedema is the key element of lipedema management.4,5 Diets that contribute to weight loss can improve patients' mobility and decrease the risk of developing secondary lymphedema. 6 Therefore, an adequate dietary energy supply is particularly important in patients with lipedema as it promotes weight and fat loss.
According to the lipedema management guidelines, weight loss is particularly difficult for patients with lipedema because popular weight loss programs do not promote lipidemic fat loss.4,6–10 Since many patients with lipedema are overweight or obese, weight loss and reduction of overall adipose tissue can contribute to the treatment success.4,10 In patients with lipedema, obesity is treated with a calorie restriction diet.6,8 Therefore, accurate assessment of energy demand in patients with lipedema is crucial in clinical practice.
Correct estimation of resting metabolic rate (RMR) in patients with lipedema allows implementing a proper calorie restriction diet. RMR is one of the components of total energy expenditure, representing 60%–75% of its value during a non-active period.11,12 It is the value of energy expended by the body at rest to maintain vital function during 24 hours.12,13 RMR can be obtained by indirect calorimetry (IC), by bioelectric impedance analysis (BIA), or with predictive equations. 13 The main benefit of performing IC is the prevention of overfeeding among patients, thanks to the precise assessment and control of their energy needs. Obtaining actual resting metabolic rate (aRMR) with IC is considered the gold standard, particularly in patients with acute or chronic conditions. 12 However, performing IC in clinical routine requires specialist equipment, is expensive, and is not widely available.
If it is impossible to obtain RMR by IC, using predictive equations is the most common method of RMR assessment.
13
However, although predictive equations are relatively reliable in healthy individuals, they may be inaccurate in case of chronic diseases.12,13 Predictive equations allow for a relatively quick and easy RMR estimation based on anthropometric parameters, such as height, weight, or body composition parameters
RMR highly depends on age, height, body weight, sex, physical activity, and body composition, including LBM and BF. Other factors such as ethnicity, hormonal status, obesity, diet, and environmental and genetic factors also influence RMR.14,15 There is a strong relationship between weight and RMR. 14 Many studies have confirmed that RMR is mostly dependent on the amount of LBM16–18 and, to some extent, on the amount of BF. 19 LBM determines RMR in about 60%–70%, whereas BMF only in 5%–7%. 20
To date, no one has reported a relationship between RMR and body composition in patients with lipedema. Due to disproportion between BF and LBM, the equations used among the general population may not apply. Our study aimed to compare aRMR with predicted resting metabolic rate (pRMR) in women with lipedema and to determine the association between individual body composition parameters and body mass index (BMI) with aRMR.
Materials and Methods
The study included 108 women with lipedema. The participants were enrolled in the study between January 2020 and June 2021. Lipedema was diagnosed based on typical clinical symptoms. 21 Clinical evaluation and diagnosis of lipedema were confirmed by an angiologist. The mean age of the study participants was 18–76 years (44.0 ± 13.5). Study exclusion criteria included diabetes mellitus, male sex, lymphedema of the legs, and factors that excluded BIA measurement: pregnancy, metal implants, pacemakers, stents, or other devices emitting electronic signals. The study was conducted at Wroclaw Medical University, Wroclaw, Poland. This study was conducted according to the guidelines laid down in the Declaration of Helsinki and all procedures involving patients were approved by the Bioethical Commission of Wroclaw Medical University (No. KB-456/2019). Written informed consent was obtained from all patients before their enrollment.
RMR assessment
Gas exchange was measured by IC with FitMate WM device (Cosmed, Rome, Italy). IC is considered the gold standard to measure RMR, by measuring oxygen consumption (VO2) and carbon dioxide production (VCO2). Breath exchanges are collected by the calorimeter for gas analysis and enable calculation of RMR using Weir's equation (REE (kcal/day) = [(VO2 × 3.941) + (VCO2 × 1.11)] × 1440). 12
Before proceeding to the measurement, the study participants had been instructed to avoid food and drinks, except water, for 8 hours and vigorous exercise for 48 hours. The measurement was performed in the supine position (reclined), in a ventilated and darkened room, at a moderate temperature (22°C–26°C).11,22 The study participants were examined in the morning after 7–9 hours of sleep. Before the measurement, participants were given 15 minutes to rest in a seated position to optimize measurement conditions. Then, they were asked to put on a Fitmate WM face mask. The measurement took 10–20 minutes and was performed in isolation to separate participants from external noise. Fitmate WM device was calibrated before every RMR assessment. Throughout the entire measurement process, its progress was monitored on the Fitmate WM screen. 16 The study participants were informed about the exact course of the procedure before the study commencement.
pRMR was calculated with the following predictive equations: Harris–Benedict, 23 Mifflin et al, 24 Bernstein et al, 25 Owen et al, 26 FAO/WHO, 27 Cunningham, 28 Müller et al, 29 Korth et al, 30 Lazzer et al, 31 Huang et al, 32 Henry's, 33 and the Institute of Medicine 34 (Table 1). The equations included age/height/weight or LBM. pRMR was estimated also with BIA. The BIA device predicts RMR using equation with LBM.
Predictive Equations Used for RMR Estimation
A, age [years]; DM, diabetes mellitus; FAO, Food Agriculture Organization; G, gender; H, height; IOM, the Institute of Medicine; LBM, lean body mass [kg]; RMR, resting metabolic rate; W, weight [kg]; WHO, the World Health Organization.
Measurement of body composition parameters using BIA
Body composition parameters and anthropometric measurements were performed with TANITA HR-001 growth meter (Tanita, Japan) and Jawon Medical X-Contact 353 8-electrode body composition analyzer (Jawon Medical co., Ltd., Republic of Korea). The following parameters were obtained: height [cm], weight [kg], percentage of BF [%], total body water [%], mass BF [kg], LBM [kg], soft tissue mass [kg], muscle tissue mass [kg], and visceral fat level (VFL). Before proceeding to the measurement, the study participants had been instructed to avoid food and drink for 4 hours, vigorous exercise for 12 hours, and taking diuretics for 6 hours. BIA was performed in the morning.
BMI was calculated as the ratio of body weight [kg] to the square of height [m2]. BMI results were interpreted on the basis of the classification of index values suggested by WHO 35 : <18.5 kg/m2—underweight; 18.5–24.9 kg/m2—normal weight; 25.0–29.9 kg/m2—overweight; 30.0–34.9 kg/m2—obesity class I; 35.0–39.9 kg/m2—obesity class II; and >40.0 kg/m2—obesity class III. Waist and hip circumference were measured with a standard measuring tape with ±1 cm accuracy. The mean value of the waist-hip ratio (WHR) was calculated as the ratio of waist to hip circumference.
Statistical analyses
The results were presented as mean value ± standard deviation, as well as minimum and maximum values. Normality of data distribution in the analyzed groups was tested with the Lilliefors test. Although the frequency distribution of some variables (based on the Shapiro–Wilk or Lilliefors tests) differed from the normal distribution, the analyses were performed with parametric methods. It was reasoned by high symmetry of frequency histograms and large sample size (N > 100), which is usually considered large enough to use parametric tests, even if the assumption of normal distribution is violated. Pearson correlation analysis was used to evaluate the relationship between aRMR and pRMR measured with BIA, as well as between aRMR and body composition parameters and BMI.
The consistency in individual measurements between aRMR and pRMR was assessed with the use of the Bland–Altman method. 36 Correlations between aRMR and body composition parameters and BMI were analyzed with Pearson correlation analysis. The Pearson correlation coefficient r was compared with the use of a test based on the transformation of r to Fisher's z-value. Since many body composition parameter variables are correlated, principal component analysis (PCA) was used to define a set of variables (principal components), among which each represents a group of strongly correlated variables (normalized Varimax rotation was applied). Results for all analyses were considered statistically significant at the level of p < 0.05. All statistical analyses were performed with STATISTICA v. 13 TIBCO Software, Inc., 2017 (StatSoft, Inc.).
Results
Characteristics of the study group
The mean body weight and height in the study group were 87.8 ± 22.6 kg and 165.9 ± 6.9 cm, equally. In this study, >70.0% of our study participants were overweight (based on BMI), and >80.0% had BF over 30.0% (using BIA). The mean value of BMI among the participants was 32.0 ± 8.7 kg/m2. Around 26.9% percentage of participants (n = 29) were of normal weight and 25.0% (n = 27) had obesity class I. An equal number of patients (17.6%; n = 19) were overweight or had obesity class III (17.6%; n = 19), and the lowest percentage of patients had obesity class II (13.0%; n = 14).
The mean waist circumference in the study group was 96.1 ± 17.7 cm. The percentage of individuals whose waist circumference was greater than 80 cm, but smaller than 88 cm was 13.9% (n = 15). The individuals whose waist circumference was greater than 88 cm represented the largest percentage of the subjects (64.8%; n = 70). Only 21.3% of the subjects (n = 23) had waist circumference below 80 cm. The mean value of WHR in the study group was 0.83 ± 0.1. The WHR value was equal to or greater than 0.85 in 38.9% of all study participants (n = 42).
Actual and predicted RMR
Most predictive equations and BIA significantly underpredicted aRMR, except for the Müller et al equation, 29 which significantly overpredicted RMR. The most underpredicted RMR was obtained with Bernstein et al, 25 with Owen et al equations, 26 and with BIA. The detailed results of characterization and the results of correlation between aRMR and pRMR are described and presented in Table 2.
The RMR Estimations Across Different Methods (n = 108)
p < 0.001.
aRMR, actual resting metabolic rate; BIA, bioelectrical impedance analysis; SD, standard deviation.
Korth et al's predictive equation was the most comparable in comparison to aRMR due to its lowest individual variability. Values of Korth et al, 30 Harris–Benedict, 23 and Lazzer et al 31 equations were within 10% of the measured aRMR in >50% of the study participants (Fig. 1).
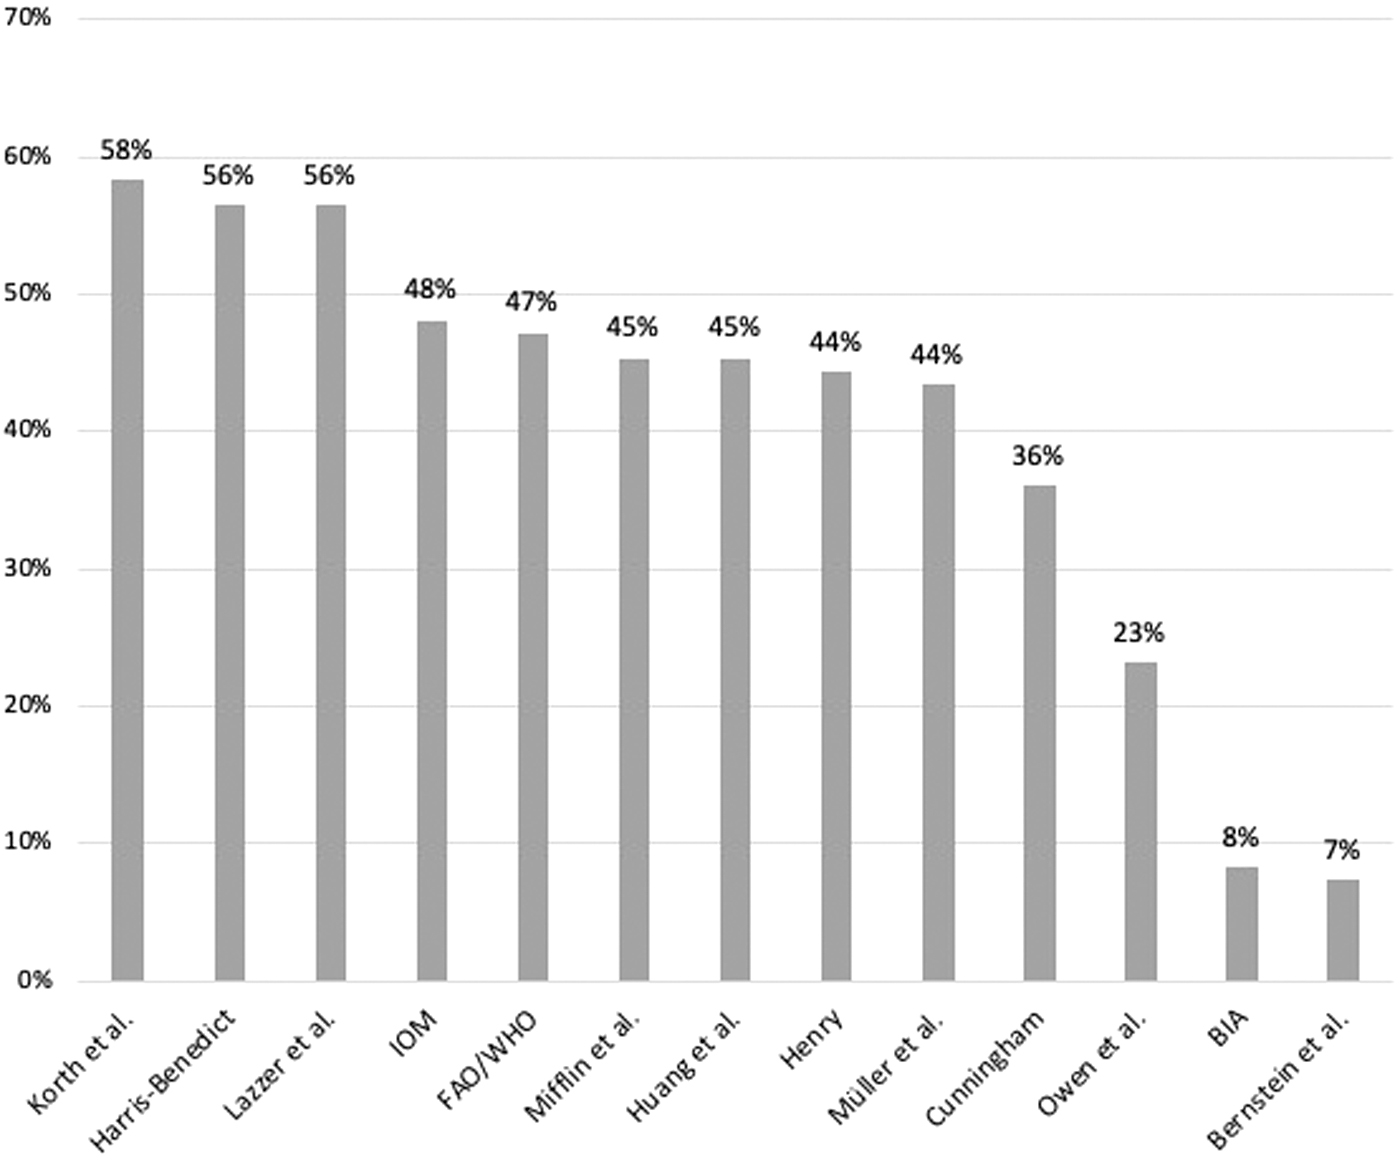
Percent of aRMR with an individual bias [%] within ±10% of aRMR for each prediction equation. aRMR, actual resting metabolic rate.
Based on the Bland–Altman analysis results, we observed a significant dispersion of individual scores for most equations. The only exception was for the Müller et al's equation, 29 which significantly overestimated the value of aRMR, but to a similar extent in the entire set of predictive equations, regardless of individual aRMR results. The Pearson's coefficient r for correlation between the averaged pRMR and aRMR values, and the difference between them are presented (Fig. 2).

Body composition parameters and BMI versus aRMR and pRMR
The mean percentage of BF mass among our study participants was 37.5% ± 7.4%. BF was higher than or equal to 30.0% in 88 patients (81.5%). Most study participants (47.2%; n = 51) were morbidly obese, with BF higher than 40.0%. VFL ranged from 3 to 20 (mean 13.4 ± 5.1). Over 70.0% (71.3%; n = 77) of study participants had a high VFL, including 43.5% with very high VFL. Characteristics of body composition parameters and BMI are shown in Table 3.
Characteristics of Body Composition Parameters and BMI (n = 108)
Supplementary Table S1 presents detailed results of Pearson correlation analysis between body composition parameters, BMI, and pRMR/aRMR. To further evaluate the correlation between body composition parameters, BMI and aRMR, we performed PCA. It enabled to define the two principal components, PC1 and PC2, which represent the sets of strongly intercorrelated variables (Supplementary Table S2). They can be interpreted as fat-free mass components and fat mass components with BMI, respectively. PC1 and PC2 groups significantly correlated with aRMR (r = 0.66 and r = 0.34, respectively; p < 0.001). However, PC1 group (fat-free mass components) more significantly correlated with aRMR than PC2 group (fat mass components with BMI). Supplementary Figure S1 presents the relationship between aRMR and PC1 (fat-free mass components) and PC2 (fat mass components with BMI).
Discussion
To date, many studies have compared RMR estimated by IC and predictive equations in overweight and obese patients.37–41 However, only one study assessed RMR in patients with lipedema, but the methodology was not precisely defined. 42 Correct RMR estimates in patients with lipedema allow calculating a proper calorie reduction diet to promote healthy weight loss. IC is considered to be an accurate method of obtaining RMR in patients with excessive body weight due to its high level of concordance between the obtained results and actual energy expenditure. 43
In this study, we, for the first time, obtained aRMR using IC in women with lipedema and correlated it with commonly available measurement methods usually used in clinical practice. This study found the agreement of predictive equations compared to IC is low (<60%). The most applied equations remain useless in clinical practice in this specific population due to large individual differences among the studied women. Therefore, estimating RMR with predictive equations used in this study is very limited in patients with lipedema. It is essential to find an appropriate method to estimate daily energy requirement for lipedema patients in clinical practice. It would be significant for clinicians to find the most comparable method to IC, which is low available. Results of this study indicate it may be necessary to propose a new equation for lipedema patients in the future.
Other authors also reported a relatively low concordance between aRMR and pRMR in overweight patients, but found the Mifflin et al 24 and Harris–Benedict equations 23 the most accurate.14,37–41 This was not the case in our study since we reported significant differences between aRMR measured with these two equations. Kruizenga et al 38 examined the validity of RMR predictive equations for underweight, normal weight, overweight, and obese inpatients and outpatients. They reported a low level of concordance between predicted and estimated with equations and IC, respectively, which is consistent with our study. The percentage of accurately predicted RMR did not exceed 49%. Authors emphasized IC as a preferred method for RMR assessment in obese patients.
Our findings are also in line with the results obtained by Carrera-Gil et al, 39 who reported a low level of concordance between RMR obtained by IC and estimated using Harris–Benedict and the Mifflin equations in patients with BMI ≥25 kg/m2. Authors concluded that predictive equations did not include body composition parameters and fat distribution parameters with a significant impact on RMR, and claimed their inaccuracy.
Due to the lower limb disproportion, BMI and body weight were considered inaccurate obesity assessment tools in patients with lipedema.4,6 According to the Dutch guidelines for lipedema management, waist circumference is the most effective measure of obesity in adults. 4 Waist circumference can be used to monitor the results of obesity treatment, which can be useful in clinical practice. 6 German guidelines recommend measuring WHR, which allows determining the distribution of BF and obesity type. 9 Consequently, due to the disproportionate content of BF on the buttocks and thighs compared to the waist, WHR may not be very useful in patients with lipedema in clinical practice. 6
We found a fat-free mass is a stronger determinant of RMR in patients with lipedema than fat mass, as occurred in most populations. Almajwal and Abulmeaty, 14 who evaluated the correlation between body composition and RMR in female patients, found that BF and LBM correlated with RMR in overweight patients and strongly correlated with RMR in obese patients. Contrary to our study, McMurray et al 18 found that RMR decreased with increasing BMI, suggesting that RMR in obese women is lower than in women with normal weight. Authors suggested that this may be related to higher FM in obese patients, which shows a weaker correlation with RMR than LBM.
The strength of this study is the use of IC, which is considered the gold standard with which to measure RMR. The other strength of this study is the large number of participants. A limitation of our study was the lack of control group with overweight women without lipedema to compare RMR values with participants.
Conclusion
IC is the best tool to evaluate RMR in evaluated patients with lipedema. However, due to its low availability and high cost, it is necessary to propose a new equation to RMR determination in clinical practice if IC is not available (e.g., in a dietician's office, health clinic, or hospital).
Footnotes
Authors' Contributions
M.J.: conceptualization (lead); data curation (lead); investigation (lead); writing—original draft (lead); methodology (lead); formal analysis (lead); and writing—review and editing (equal).; A.S.: conceptualization (supporting); writing—review and editing (supporting), and supervision (lead).; K.K.: software (lead); methodology (supporting), and formal analysis (supporting).; B.R.-I.: conceptualization (supporting); writing—review and editing (supporting), and supervision (lead).
Author Disclosure Statement
No competing financial interests exist.
Funding Information
No funding was received for this article.
References
Supplementary Material
Please find the following supplemental material available below.
For Open Access articles published under a Creative Commons License, all supplemental material carries the same license as the article it is associated with.
For non-Open Access articles published, all supplemental material carries a non-exclusive license, and permission requests for re-use of supplemental material or any part of supplemental material shall be sent directly to the copyright owner as specified in the copyright notice associated with the article.