
Abstract
Because they are monovalent for antigen, single chain antibodies display a different antibody-antigen interaction pattern from that of full-length antibodies. Using the law of mass action and considering the antibody-antigen binding pattern at OD-100% and OD-50% points, we introduced a formula for estimating single chain antibody affinity. Sigmoid curves of optical density values versus antibody concentrations were drawn and used to determine antibody concentrations at OD-50% points using statistical software SigmaPlot. The OD-50% points were then used to calculate the affinity via the mathematical formula. A software-adapted format of the equation is also presented for further facilitation of the calculation process. The accuracy of this method for affinity calculation was proved by surface plasma resonance. This method offers a precise evaluation of antibody affinity without requiring special material or apparatus, making it possible to be performed in any biological laboratory with minimum facilities.
Introduction
A
Materials and Methods
Mathematical equations
In terms of antigen-antibody interaction, the law of mass action states that OD value is directly influenced by the interaction of antibody-antigen: the more antigen-antibody binding, the more OD obtained. For single chain antibodies containing only one antigen binding site, the affinity can be determined as below.
Antibody binds to antigen, constituting antigen-antibody complex:
Therefore, the K of the reaction to be:
In the case of single chain antibody, total antibody and antigen concentrations are:
Where [Ag] is the concentration of free antigen and [AbAg] is the concentration of antibody bound to antigen.
Equation 1 can be re-expressed as:
This equation indicates that when concentration of antibody (in ELISA well) is increased, the concentration of free antigen approaches zero. Therefore:
At OD-50%, half the antigens are bound by antibody, and therefore we find that:
By solving equations 1 and 6, we find at OD-50%:
Equation 2 can be re-expressed as:
By solving equations 6 and 8 at OD-50%:
Therefore:
By using a number of antigen concentrations, one being half the other, we find that at OD-50%:
Where n=times of antigen dilution by ½.
Therefore:
Since each single chain antibody can bind to only one antigen, therefore:
Equation 10 can be re-expressed as:
By considering equations 10 and 12:
Where n is the times of antigen dilution.
Using equation 13, the affinity of single chain antibody can be determined by inserting antibody concentrations at OD-50% points.
Primary ELISA test to obtain OD values
Five concentrations of EGFRvIII specific 14-amino acid peptide (LEEKKGNYVVTDHC) were prepared in carbonate/bicarbonate buffer (pH 9.4) and coated on ELISA plate overnight at 4°C. The antigen concentrations used in the coating buffer were 20, 10, 5, 2.5, 1.25, and 0.625 μg/mL (Table 1). Non-specific sites were blocked with 300 μL of phosphate-buffered saline (PBS) containing 3% bovine serum albumin (BSA) for 1 h. Recombinant humanized single chain anti-EGFRvIII antibody (27 kDa) was affinity-purified from BL-21 bacteria using Ni-resin column. Serial dilutions of this antibody were made in PBS buffer with 1% BSA and applied as primary antibody to the ELISA wells (100 μL/well) containing different concentrations of antigen. The antibody concentrations were 50, 25, 12.5, 6.25, and 3.125 μg/mL (Table 1). After 1 h incubation at room temperature, 100 μL of HRP-protein L at final concentration of 50 ng/mL were added to each well as secondary antibody. Protein L is a cell wall protein of bacterial species Peptostreptoccus magnus that binds to all immunoglobulin molecules with kappa light chains.(12) After 1 h, 100 μL substrate was added to each well and allowed to cause signal. After each step, the ELISA wells were washed three to five times with PBS containing 0.05% Tween-20 to ensure that only specific binding events are maintained to produce signal at the final step.
Ag con, Antigen concentration; Ab con, antibody concentration; OD, optical density.
Drawing sigmoid curves to determine antibody concentrations at OD-50% points
Using SigmaPlot software, a graph of OD versus antibody concentrations was drawn for each antigen concentration (pathway: Statistic [on the SigmaPlot upper ribbon]>Non-linear Regression>Regression Wizard>Equation Category>Sigmoidal>Sigmoid, 3 parameters>Next [to adjust the needed parameters]>Finish). The resulting graphs were converted into sigmoid format to determine the antibody concentrations at OD-50% points (Fig. 1).

Conversion of non-logarithmic curve into logarithmic curve and determination of total antibody concentration at OD-50% point in antigen concentration of 2.5 μg/mL. Right-clicking on antibody concentration values on the horizontal axis (axis-X) and selecting Graph Properties item allows the antibody concentration values to be changed into logarithmic values (
The exact values of antibody concentration at OD-50% points can be determined using the sigmoid equation found in the Plot Equation dialog box on the Graph section (on the upper ribbon of SigmaPlot main page). By clicking the Library tab, the Equation Category drop-down list appears, from which the Sigmoidal item is selected. By clicking the Solve tab, the sigmoid equation appears in Expression box. By inserting the antibody concentration in the X box and then clicking the Evaluate button, the OD value will appear in Results box (Fig. 2).
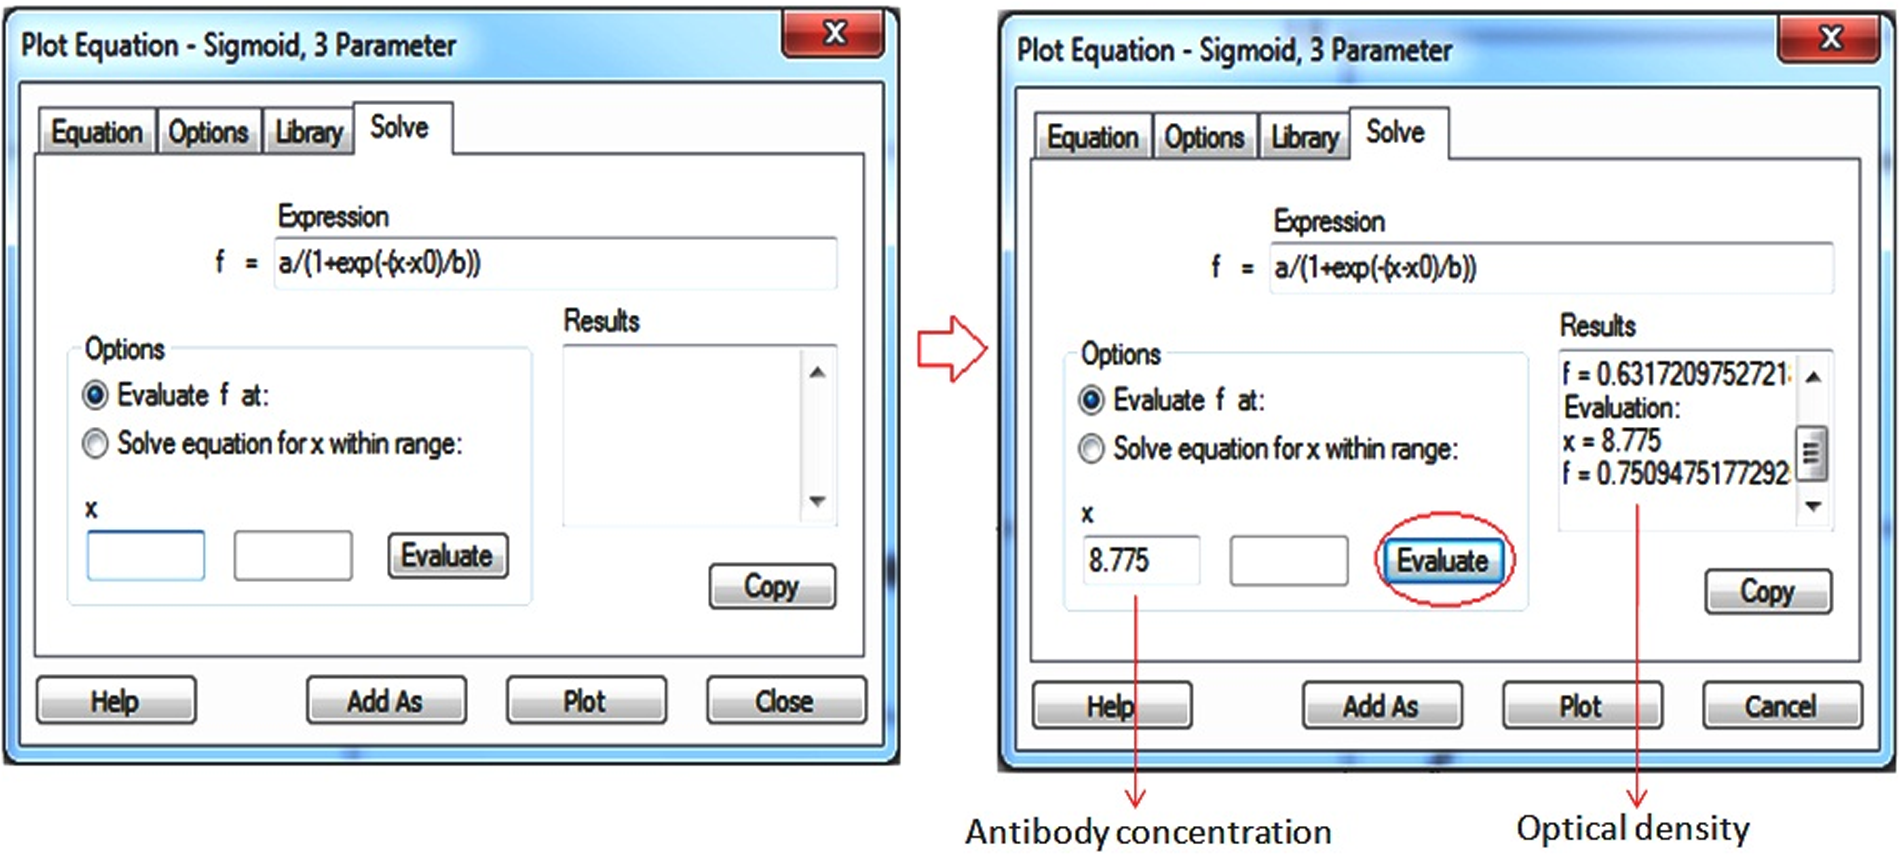
Precise evaluation of antibody concentration at OD-50% point in antigen concentration of 2.5 μg/mL. Antibody concentration of 8.775 μg/mL causes OD-50% (0.76) at this antigen concentration.
A sigmoid curve was drawn for each antigen concentration in the same manner, and total antibody concentration at OD-50% was determined and used to estimate the antibody affinity via the equation adapted for single chain antibodies (equation 13).
Results
ELISA results
Different OD values were observed in ELISA wells coated with different concentrations of antibody-antigen. As expected, at all antigen concentrations, the OD values were increased as antibody concentrations enhanced and finally reached plateaus, OD-100% points (Fig. 1). At antigen concentrations of 20, 10, 5, 2.5, 1.25, and 0.625 (μg/mL), the total antibody concentrations at OD-50% points were calculated to be 6.875, 7.030, 8.25, 8.775, 13.5, and 16 μg/mL, respectively (Table 1).
Secondary ELISA test to assay validity of SigmaPlot-estimated antibody concentrations
To examine the validity of SigmaPlot-estimated antibody concentrations at OD-50% points, another ELISA test including antibody concentration of 50 μg/mL and two estimated antibody concentrations at OD-50% points (7.030 and 8.775 μg/mL) was conducted at two antigen concentrations (10 and 2.5 μg/mL). Three repetitions were considered for each antigen concentration, and the means of expected OD-50% values were compared with the means of observed OD values by t-test. The results revealed that SigmaPlot-estimated antibody concentrations at OD-50% points are reliable values for assessment of antibody affinity (Table 2).
Ab con, antibody concentration; Ag con, antigen concentration; R: repetition; SD, standard deviation; SEM, standard error of the mean.
Automated calculation of antibody affinity using SigmaPlot software
After determining the antibody concentrations at OD-50% points, the single chain antibody affinity can be determined using equation 13. However, to further facilitate affinity calculation, the software-suited format of this equation is presented below:
Where f is Kaff, a is [Ab]′ total, b is [Ab]total, and n is times of antigen dilution.
This equation must be added to SigmaPlot equation library located in the Plot Equation dialog box. This dialog box contains four tabs: Equation, Option, Library, and Solve. The two firsts are used to make new equations, the third contains the collection of the software equations, and the fourth is used for solving the equations. The n value is defined using the Option tab. By having three n values, three equations must be made and added to the software equation library. By inserting two OD-50% values in a and b boxes on the Solve tab, the antibody affinity at each n value can be easily calculated (Fig. 3, Table 3).
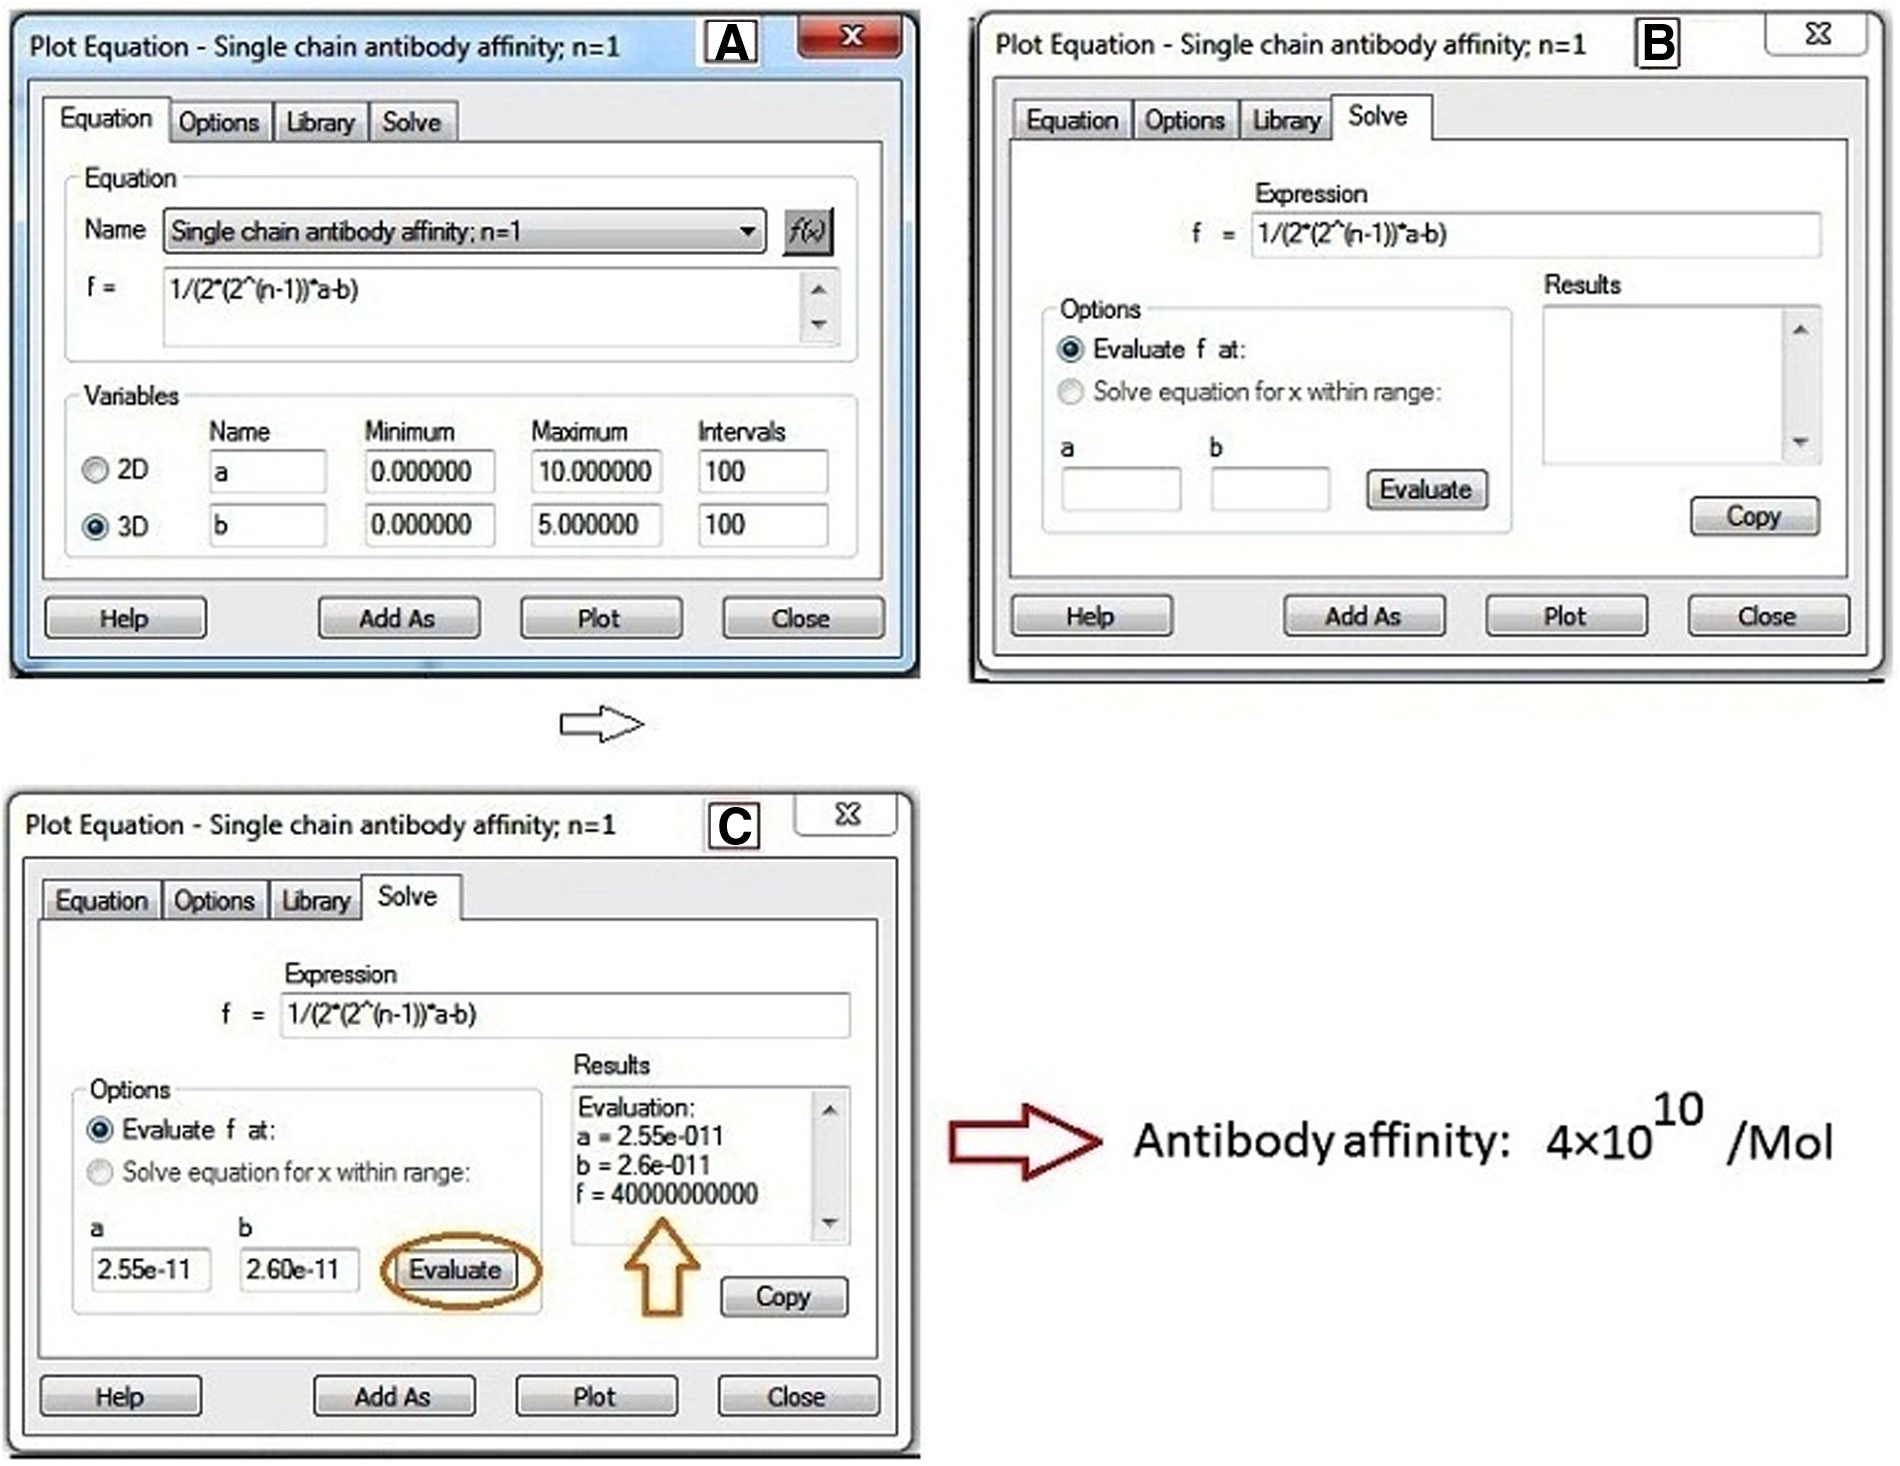
Calculation of single chain antibody affinity. The equation defined for affinity calculation is selected from the library of equations. The Plot Equation dialog box contain four tabs (
N, times of dilution; a, [Ab]′ total; b, [Ab] total.
Considering four antigen concentrations in the ELISA test, five affinity values at n=1, four at n=2, and three at n=3 were calculated (Table 3). The mean of these values, 1.87×10¹⁰/Mol, was reported as affinity of the humanized single chain antibody. The validity of this method for affinity calculation of single chain antibody was confirmed by surface plasma resonance (2.45×10¹⁰/Mol), showing high consistency with our result.
Discussion
The antigen-antibody interaction pattern of single chain antibodies differs from that of full-length antibodies, which have two antigen binding sites, necessitating the definition of an independent formula for affinity calculation of single chain antibodies. As confirmed by surface plasma resonance, our method offers a good estimation of single chain antibody affinity. This can be used for all types of single chain antibodies that have only one antigen binding site, including non-human, human, or humanized single chain antibodies. As noted before, several methods have been developed thus far for estimation of antibody affinity, some of which (for instance surface plasma resonance) also demonstrate to be very powerful. However, most of these methods are laborious or require special equipment or materials.(3,4,6) On the other hand, our method of measuring single chain antibody affinity is easy, reproducible, and reliable, providing a rapid assay of single chain antibody affinity with high accuracy. Since no specialized equipment is needed for this method, it can be easily performed in any laboratory with minimum facilities. Using the method that we described in this study, the affinity of single chain antibodies can be determined with high accuracy and without requiring any special equipment or materials.
Footnotes
Acknowledgment
This study was funded by Biotechnology Research Center, Tarbiz University of Medical Science (Tabriz, Iran). The results presented in this work are based on dataset performed for a doctoral thesis registered at Tarbiz University of Medical Science. The authors are thankful to Dr. Leila Khalili from Sharif University of Technology for her assistance in software formulation of mathematical equations.
Author Disclosure Statement
The authors have no financial interests to disclose.