
Abstract
Targeted therapy using monoclonal antibodies (mAbs) against epidermal growth factor receptor-2 (ErbB2) has been utilized for the treatment of breast cancer, recently. Pertuzumab, one of the anti-ErbB2 mAbs, was approved by FDA in 2012 for the treatment of metastatic breast cancer. The aim of this study was to produce biosimilar version of pertuzumab in Chinese hamster ovary (CHO)-S cell line, and compare its ErbB2-binding and biological activities, with commercial drug, Perjeta. To this end, a dihydrofolate reductase (DHFR)-based strategy was used to produce a CHO-S stable cell pool capable of producing high levels of pertuzumab. A two-phase selection strategy based on increasing concentrations of puromycin and MTX was used for selection of stably transfected cell pools. Finally, three stable CHO-S cell pools were achieved and analyzed for productivity in a simple fed-batch culture system. Results showed that, the pool with Puromycin to the final concentration of 50 μg/mL and MTX to 1000 nM in the selection phase 2 produced and secreted the highest amount of mAb (442.578 mg/L at 8 days) to the culture medium. Assessment of in vitro ErbB2-binding and biological activities of produced pertuzumab revealed its high similarity with Perjeta.
Introduction
B
Pertuzumab (also called Omnitarg, trade name Perjeta, Genentech, Inc.), a humanized mAb that targets near the center of subdomain II of the ErbB2 extracellular domain, blocks the binding pocket, which is necessary for receptor dimerization and signaling, and prevents ErbB2 from homodimer and heterodimer formation.(9,10) FDA approved pertuzumab in 2012 for the treatment of metastatic breast cancer. Several clinical trials have been conducted or are underway to evaluate the antitumor effects of pertuzumab in combination with trastuzumab, ado-trastuzumab emtansine, docetaxel, and lapatinib.(9,11–13)
Mammalian cell lines, including Chinese hamster ovary (CHO), NS0, Sp2/0, HEK293, and PER.C6, have three major abilities that make them suitable for producing mAbs: first, the ability to perform posttranslational modifications, especially glycosylation; second, the ability to produce large amounts of mAb with a consistent quality; and third, the ability to adapt well to culture in large-scale suspension bioreactors.(14–19)
Among the numerous different mammalian expression systems for production of biopharmaceuticals, CHO cells are the most frequently investigated cell lines. This cell line is known to have an unstable genome, which makes it good candidate for gene amplification and other genetic manipulations. Also, CHO cells pose a low risk for the transmission of human viruses, which is an important feature in the production of pharmaceutical proteins.(17) Many biopharmaceutical-producing CHO cell lines were derived from the CHO-DG44, CHO-DUKX-B11, CHO-S, and CHO-K1 lineages. The CHO-S cell line is a stable aneuploid cell line and works based on the dihydrofolate reductase (DHFR) selection platform, although the cell line have a basal level of DHFR activity.(16,20–23)
Although the process of producing stably transfected CHO cells, capable of producing high levels of recombinant proteins, may take several years, for large-scale production of therapeutic mAbs, stable cell generation is still the method of choice.(24) Different strategies have been developed for the selection of stably transfected CHO cell clones that can produce high levels of foreign protein, including gene amplification strategies using DHFR or glutamine synthetase (GS),(25,26) site-specific integration strategies, including recombinase-mediated cassette exchange,(27,28) and fluorescence-activated cell sorting (FACS)-based screening strategies, including antibody-membrane switch technology.(29–31)
The aim of this study was to produce a biosimilar version of pertuzumab in CHO-S cells and compare its ErbB2-binding and biological activities with a commercial drug, Perjeta. In this regard, a DHFR-based strategy using a two-phase selection system based on increasing levels of puromycin and MTX was selected to produce a stable cell pool capable of producing high levels of pertuzumab.
Materials and Methods
Plasmid construction and CHO-S cell transfection
The sequence of heavy chain (HC: 1S78_F) and light chain (LC: 1S78_E) of pertuzumab along with human albumin signal peptide was sequence-optimized using GenScript's multiparameter gene optimization algorithm, OptimumGene™ (NJ). The proper signal peptide and gene-optimized sequences for the production of pertuzumab HC and LC in CHO cells were determined in another study in our laboratory(32) After synthesis, the coding genes were inserted into Invitrogen pCHO1.0 expression vector containing dhfr gene, and 50 μg of linearized recombinant plasmid was transfected to 3 × 10⁷ CHO-S cells, which was a generous gift from Prof Fazel Shokri (Tehran University of Medical Sciences, Tehran, Iran), using 50 μL of Invitrogen FreeStyle MAX Reagent (Invitrogen) according to the manufacturer's instructions. Forty-eight hours after transfection, 1 mL of supernatant was removed and analyzed for pertuzumab production, using sandwich enzyme-linked immunosorbent assay (ELISA). Then a two-phase selection strategy based on increasing levels of puromycin (Gibco) and MTX (Sigma, MO) was used to select stably transfected cell pools, in which the linearized plasmid had integrated into the CHO-S cell genome. Briefly, in selection phase 1, two different levels of selection reagents were used: puromycin to a final concentration of 10 μg/mL and MTX to 100 nM (Pert/10P/100M), and puromycin to a final concentration of 20 μg/mL and MTX to 200 nM (Pert/20P/200M). For control, only puromycin to a final concentration of 10 μg/mL and MTX to 100 nM were added to untransfected CHO-S cells (Cont/10P/100M). Flasks were incubated at 37°C and 8% CO2 in a static incubator and the media were exchanged every 4 days until the viability reached more than 90%. In selection phase 2, each recovered cell pool from selection phase 1 was subjected to two levels of selection medium, puromycin to a final concentration of 30 μg/mL and MTX to 500 nM (30P/500M), and puromycin to a final concentration of 50 μg/mL and MTX to 1000 nM (50P/1000M). Therefore, four selection phase 2 shake flasks was generated: 10–30, 10–50, 20–30, and 20–50, which were incubated on a shaking incubator at 37°C, 8% CO2, and 130 rpm.
The selection was performed using CD FortiCHO Medium (Invitrogen) containing 8 mM Glutamax (Gibco, Japan), a combination of puromycin and MTX, and 1 × anti-clumping agent (Gibco, Canada).
Quantification of secreted pertuzumab in a simple fed-batch culture
A simple fed-batch culture was set up to assess the productivity after selection phase 2 and contains the following: CD FortiCHO™ medium supplemented with 8 mM Glutamax and 1 × anti-clumping agent in 100-mL shaker flasks. The cultures were incubated on a shaking platform both at 35°C and 37°C, 8% CO2, and 150 rpm and fed with glucose (Sigma) to the final concentration of 4 g/L on days 3, 5, and 7 of fed-batch culture. The cell density, viability, and productivity were determined daily, until culture viability drops below 50%. Pertuzumab concentration analysis was performed using sandwich ELISA. The stable cell pool with the highest productivity was selected and secreted pertuzumab was purified by HiTrap protein G HP column (GE Healthcare, Uppsala, Sweden) using AKTA pure FPLC system (GE Healthcare) and UV detection at 280 nm. Purified pertuzumab was quantified by sandwich ELISA and stored for ErbB2-binding and biological activity analysis.
Evaluation of mycoplasma contamination using PCR
Genomic DNA was extracted from 5 × 10⁶ cells of CHO-S stably transfected 20–50 pool using a QIAamp DNA blood mini kit (QIAGEN) according to the manufacturer's protocol. PCR was conducted using Myco-F (GTGGGGAGCAAATYAGGATTAGA) and Myco-R (GGCATGATGATTTGACGTCRT) primers and 100 ng of each genomic DNA, under the following program: 95°C for 10 minutes, 30 cycles of 95°C for 50 seconds, 58°C for 60 seconds, 72°C for 60 seconds, and final extension at 72°C for 10 minutes. The genomic DNA from Mycoplasma pneumoniae was used as positive control. CHO GAPDH was used as the internal control gene to verify the quality of purified DNA and accuracy of PCR.
Evaluation of ErbB2-binding activity of produced pertuzumab
Indirect ELISA
A 96-well ELISA plate (PolySorp, NUNC™, Denmark) was coated with 50 μL of 0.5 μg/mL of the recombinant extracellular part of ErbB2 (SinaBiotech, Tehran, Iran) or 10 μg/mL of cell lysates from two different cell lines, SK-BR-3 (ErbB2-positive cell line) and MDA-MB-231 (ErbB2-negative cell line), in bicarbonate/carbonate coating buffer (100 mM), incubated overnight at 4°C, and blocked with 200 μL of PBS supplemented with 0.05% Tween 20 (Bio-Rad) and 3% nonfat skim milk (Sigma). Fifty microliters of serial concentrations of purified pertuzumab (1 to 1 × 10⁷ ng/L) was used as primary antibody and was incubated for 1.5 hours at room temperature. Perjeta (Roche, Welwyn Garden City, United Kingdom) was used as a positive control. Plate was washed thrice with PBS/0.05% Tween 20. Fifty microliters of 1:60,000 diluted HRP-conjugated, goat anti-human IgG antibody (Catalog No. A0170; Sigma) was added and plate incubated for 1 hour at 37°C and washed as above. Then 50 μL of TMB substrate (Invitrogen) was added per well and incubated at room temperature for 10 minutes, and the reaction was stopped by the addition of 50 μL of 0.25 M sulfuric acid (Merck, Germany). Plate was read on an anthos 2020 microplate reader (Biochrom, United Kingdom) at 450 nm.
Native-PAGE electrophoresis and Western Blotting
To analyze the purity of purified pertuzumab, 10% native-PAGE was used, which was visualized with R250 Coomassie blue. Western blotting in nonreducing condition was performed in two ways. The first method was performed as discussed by Ramezani et al.(32) Briefly, 50 ng of the recombinant extracellular part of ErbB2 (SinaBiotech) was loaded on 12.5% native-PAGE gel. Transferring of separated proteins to polyvinylidene difluoride (PVDF) (GE Healthcare) membranes was performed using the Trans-Blot® Turbo™ Blotting System (BioRad, CA). Blocking of PVDF membrane was performed using PBS supplemented with 0.15% Tween 20 (Bio-Rad) and 5% nonfat skim milk, overnight at 4°C. After washing with PBS-Tween the membrane was incubated with 10 mg/mL of purified pertuzumab mAb and Perjeta (as positive control) for 1.5 hours at room temperature and then incubated for 1 hour with HRP-conjugated, goat anti-human IgG antibody (1:2000 diluted; Sigma). Signals were detected with enhanced chemiluminescence substrate (BioRad) using ChemiDoc™ MP System (Bio-Rad). The second method was the same, but 100 ng of the purified pertuzumab and Perjeta was loaded on 8% native-PAGE gel to determine the molecular size of purified pertuzumab.
Flow cytometric analysis
Indirect surface staining was performed on MCF7, MDA-MB-231, MDA-MB-468, PARI, SK-BR-3SK-BR-3, and SK-OV-3 cells. All cell lines were purchased from National Cell Bank of Iran (NCBI, Tehran, Iran), except for PARI, which is an ErbB2-negative breast cancer cell line, established in Shiraz Institute for Cancer Research (ICR, Shiraz, Iran). All cell lines were maintained in the RPMI 1640 supplemented with 10% FBS, 100 U/mL penicillin, and 100 mg/mL streptomycin, except SK-BR-3SK-BR-3, which was held in RPMI 1640 supplemented with 20% FBS. Detached cells were washed with PBS buffer containing 2% FBS and incubated with 100 mL of 0.1 μg/mL of purified pertuzumab and Perjeta as primary antibodies at 4°C for 1 hour. FITC conjugated mouse anti-human IgG antibody (Catalog No. 555786; BD Biosciences) was used for detection of recovered cells and analysis was performed using a FACS Calibur flow cytometry (BD Biosciences). Data were analyzed by FlowJo 7.6.2 software (FlowJo, LLC, CA).
Evaluation of direct biological activity using MTT assay
To evaluate the effect of pertuzumab on the proliferation of the MDA-MB-231 and SK-BR-3SK-BR-3 cell lines, the MTT assay was performed. Five thousand cells per 100 μL per well into 96-well cell plates were seeded and incubated overnight (∼16 hours) at 37°C and 5% CO2. Then, 50 μL of fresh media containing different concentrations of produced pertuzumab, Perjeta as positive control, Herceptin, the combination of produced pertuzumab and Herceptin, and the combination of Perjeta and Herceptin (0, 0.01, 0.1, 1, 10, 100, and 1000 nM), in equal molar ratio, were added to each well. The plates were then incubated in a 5% CO2 incubator at 37°C for 120 hours. Tetrazolium bromide solution (Sigma) was then added at 0.5 mg/mL final concentration to each well and incubated in the incubator for 4 hours. The media were then aspirated from each well and 150 μL DMSO was added to solve formazan crystals. The plates were then shaken for 20 minutes on a shaker and optical density of each well was measured at 570 nm on a microplate reader (Biochrom anthos 2020, Cambridge, United Kingdom). All the experiments were carried out in triplicates.
Statistical analysis
All the numerical data and graphs were analyzed with GraphPad Prism version 5.03 (GraphPad Software, CA). The data were expressed as mean ± SE. Differences in pertuzumab concentration among stably transfected pools, and between MTT results, were determined by nonparametric Kruskal–Wallis H-test and pairwise comparison was conducted using Dunn's multiple comparisons test. p-Values less than 0.05 among samples were considered to be significant.
Results
The schematic representation of pCHO-pertuzumab construct can be observed in Figure 1. The gene-optimized sequences of Pertuzumab heavy and light chains are available in the Supplementary Data. Figures 2 and 3, show the recovery profile during selection phase 1 and 2, respectively. As can be seen in Figure 2, in control cells (untransfected CHO-S cells), 12 days after selection initiation, all the cells in the culture were killed by the combination of 10 μg/mL of puromycin and 100 nM MTX, while in transfected CHO-S cells, Pert/10P/100M and Pert/20P/200M, although at first viability dropped below 10%, after 11 and 7 days, respectively, recovery was initiated, and after 3 weeks, the cell viability reached more than 90%. According to Figure 3, only 10–50 flask cells did not show signs of recovery after 20 days and the culture was eliminated, while in three other cultures, after 20 days, the cell viability met or exceeded more than 90%. Therefore, at the end of selection phase 2, three different stably transfected pools were achieved, which were named as follows: 10–30, 20–30, and 20–50. First, the pertuzumab production rate was compared between these three pools and the pool with the highest productivity was selected for assessment of ErbB2-binding and biological activities.

Schematic representation of pCHO-pertuzumab construct. CHO, Chinese hamster ovary.

Recovery profile during selection phase 1. The viable cell density and viability were compared during the recovery of two different pools along with control untransfected CHO-S cells in selection phase 1.

Recovery profile during selection phase 2. The viable cell density and viability were compared during the recovery of four different pools in selection phase 2.
Product quantification
The productivity rate from the time of transfection to the end of selection phase 2 in three different pools were compared in Figure 4. The phase 0 in this figure shows the production level 48 hours after transfection, which indicates the transient level of production. Phase 1 shows the 5-day batch culture pertuzumab production level at the end of selection phase 1, in Pert/10P/100M (10 μg/mL of puromycin and 100 nM MTX) and Pert/20P/200M (20 μg/mL of puromycin and 200 nM MTX) pools. These two stable pools were resistant to 10 and 20 μg/mL of puromycin in the culture medium. Phase 2 represents the 8-day simple fed-batch culture at 35°C. These three stable pools were resistant to 30 and 50 μg/mL of puromycin and 500 and 1000 nM of MTX in the culture medium.
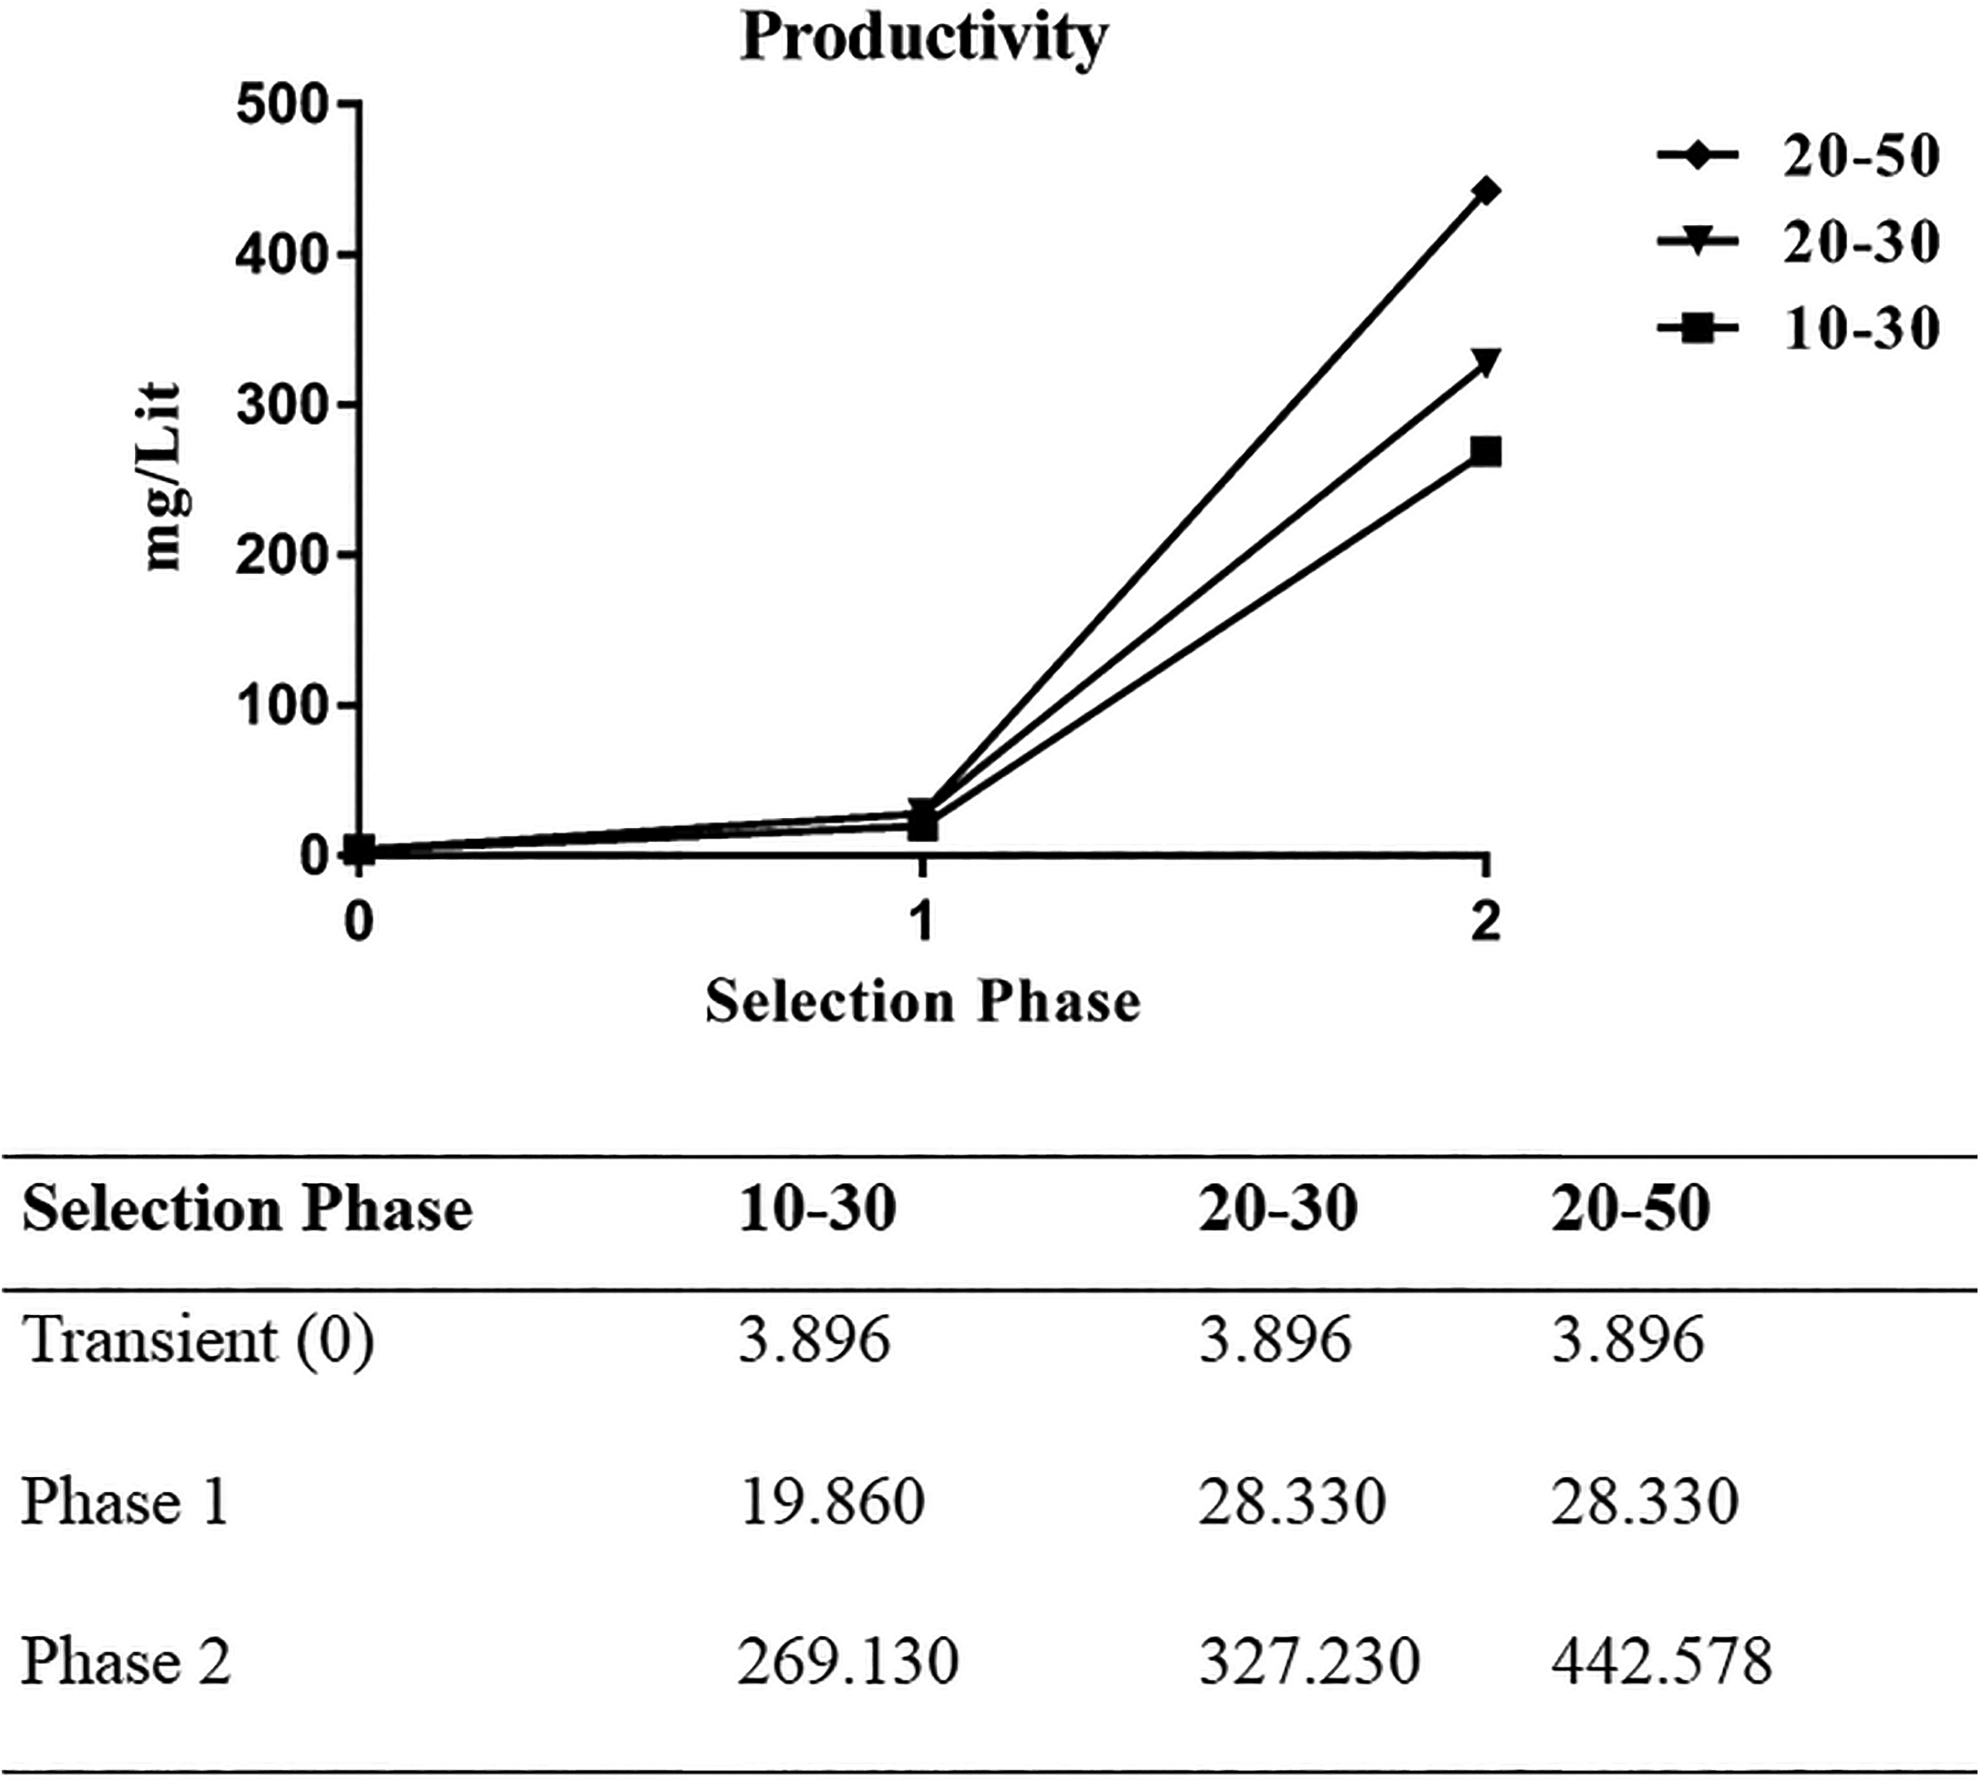
Comparison of productivity level from transient state to the end of selection phase 2. 0: Shows the transient production rate, 48 hours after transfection. 1: Shows the 5-day batch culture pertuzumab production level at the end of selection phase 1. 2: Phase 2 represents the 8-day simple fed-batch culture at 35°C at the end of selection phase 2. 10–30: represents the pool with 10 and 30 μg/mL puromycin at selection phase 1 and 2, respectively. 20–30: represents the pool with 20 and 30 μg/mL puromycin at selection phase 1 and 2, respectively. 20–50: represents the pool with 20 and 50 μg/mL puromycin at selection phase 1 and 2, respectively.
Evaluation of Mycoplasma contamination
Figure 5 shows the result of PCR using Mycoplasma-specific primers on genomic DNA extracted from CHO-S stably transfected 20–50 pool. As can be observed, only the positive control sample, Mycoplasma genome, generated the 416 bp fragment. These results show that this cell line is not contaminated with Mycoplasma.

Mycoplasma contamination evaluation. PCR was performed using Mycoplasma-specific primers on 100 ng genomic DNA extracted from 1. CHO-S stably transfected 20–50 cell pool, and 2. Mycoplasma pneumoniae genome that was used as positive control and generated the 416 bp fragment. 3. PCR using internal control primers for CHO GAPDH on 100 ng DNA extracted from CHO-S stably transfected 20–50 cell pool that produces the 145 bp fragment. M: Fermentas GeneRuler DNA Ladder Mix.
ErbB2-binding activity analysis
Indirect ELISA
Figure 6 shows the results for indirect ELISA using 0.5 μg/mL of the recombinant extracellular part of ErbB2 or 10 μg/mL of cell lysates from SK-BR-3SK-BR-3 and MDA-MB-231 cell lines as coating antigen and serial concentration of purified pertuzumab and Perjeta (1 to 1 × 10⁷ ng/L) as primary antibodies. Statistical analysis revealed no significant differences between membrane binding of produced pertuzumab in CHO-S cell line with Perjeta in binding to recombinant extracellular part of ErbB2 and membrane ErbB2 on the surface of SK-BR-3SK-BR-3 cell line. No nonspecific binding was observed with MDA-MB-231 cell lysate, which is an ErbB2-negative cell line.
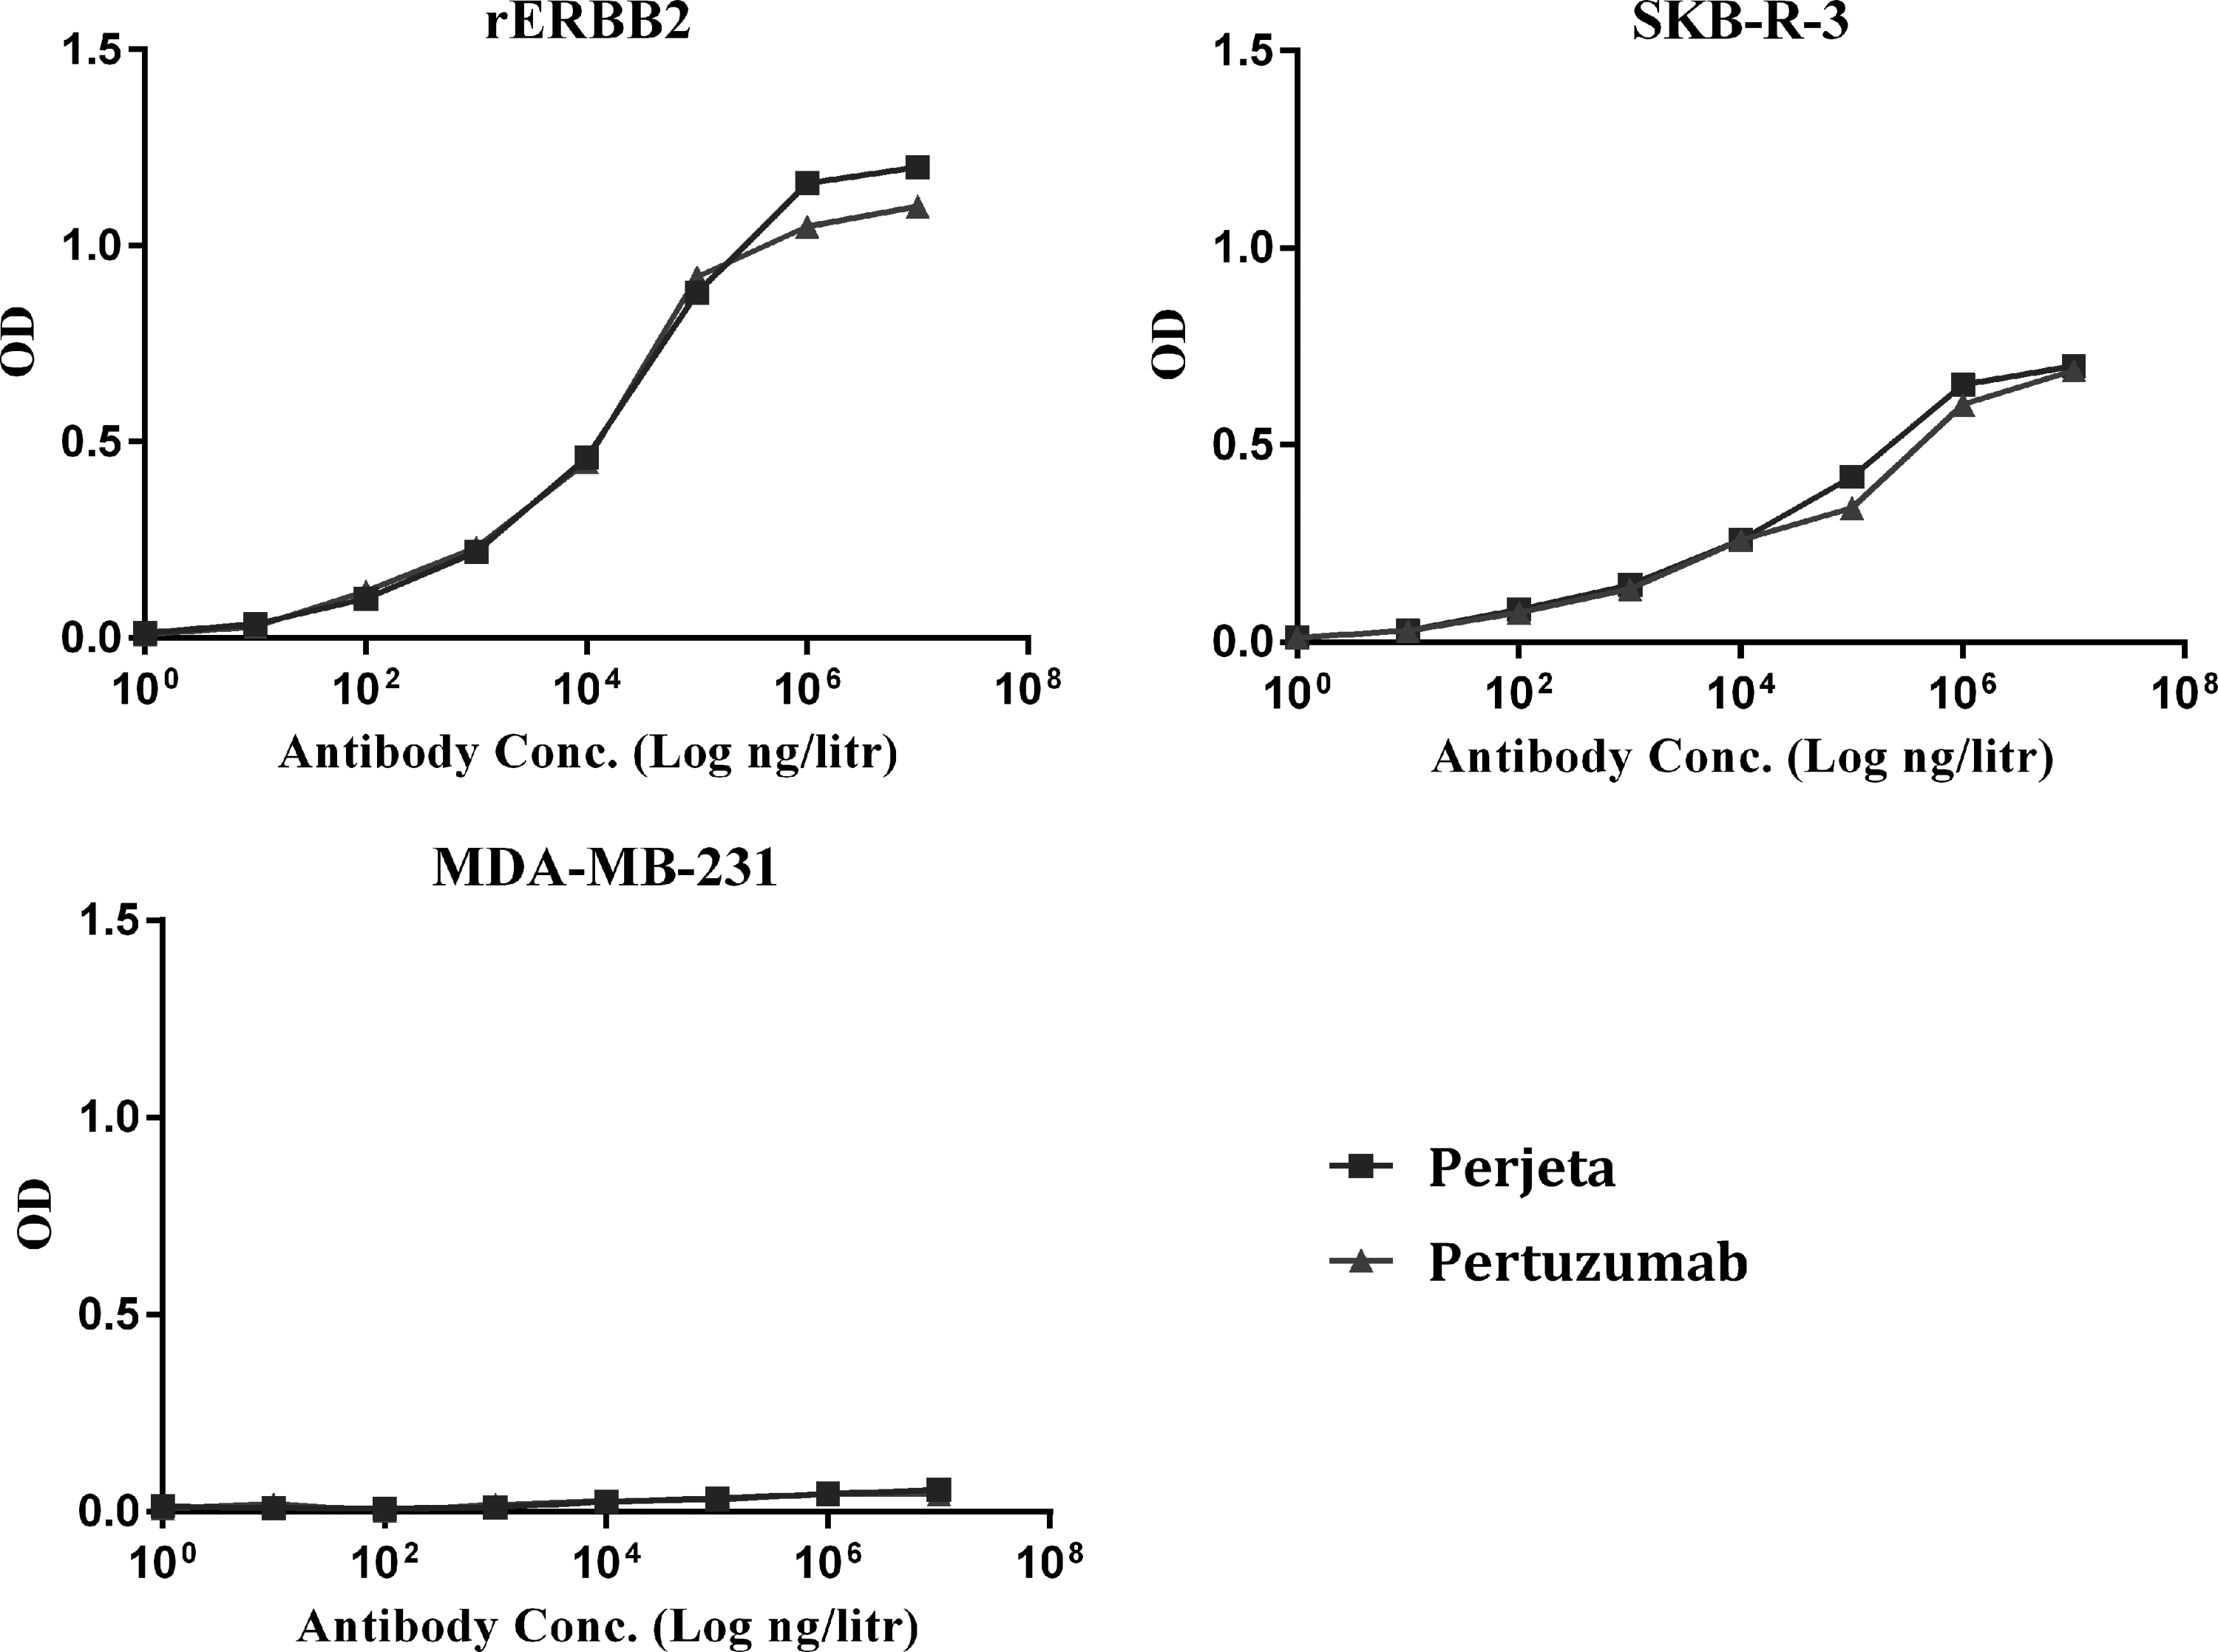
Indirect ELISA using 0.5 μg/mL of the recombinant extracellular part of ErbB2 or 10 μg/mL of cell lysates from SK-BR-3 and MDA-MB-231 cell lines, as coating antigen, and serial concentration of purified pertuzumab from CHO-S stably transfected 20–50 cell pool supernatant and Perjeta (1 to 1 × 10⁷ ng/L), as primary antibodies. Statistical analysis revealed no significant differences between membrane binding of purified pertuzumab from CHO-S cell line supernatant and Perjeta. ELISA, Enzyme-Linked Immunosorbent Assay; ErbB2, epidermal growth factor receptor-2.
Native-PAGE electrophoresis and Western blot analysis
According to Figure 7A, both Perjeta and pertuzumab separated in nonreducing conditions and released the 148 kDa band related to whole antibody. Western blot analysis revealed that the purified pertuzumab from stably transfected CHO-S 20–50 cell pool reacts with the nonreduced form of recombinant extracellular domain of ErbB2 protein and a 75 kDa band was detected (Fig. 7B). Figure 7C shows the Western blot analysis using 1 μg of purified pertuzumab from stably transfected CHO-S 20–50 cell pool as running sample in nonreduced polyacrylamide gel. The 148 kDa band can be observed. Similar results were obtained for Perjeta, which was used as positive control.

Flow cytometric analysis
Figure 8 shows the membrane binding of purified mAb from stably transfected CHO-S 20–50 cell pool to ErbB2 on MCF7, MDA-MB-231, MDA-MB-468, PARI, SK-BR-3, and SK-OV-3 cells. The resulting mean fluorescent intensity (MFI), which was calculated by dividing the MFI of each sample by MFI of control, can be observed in Table 1.
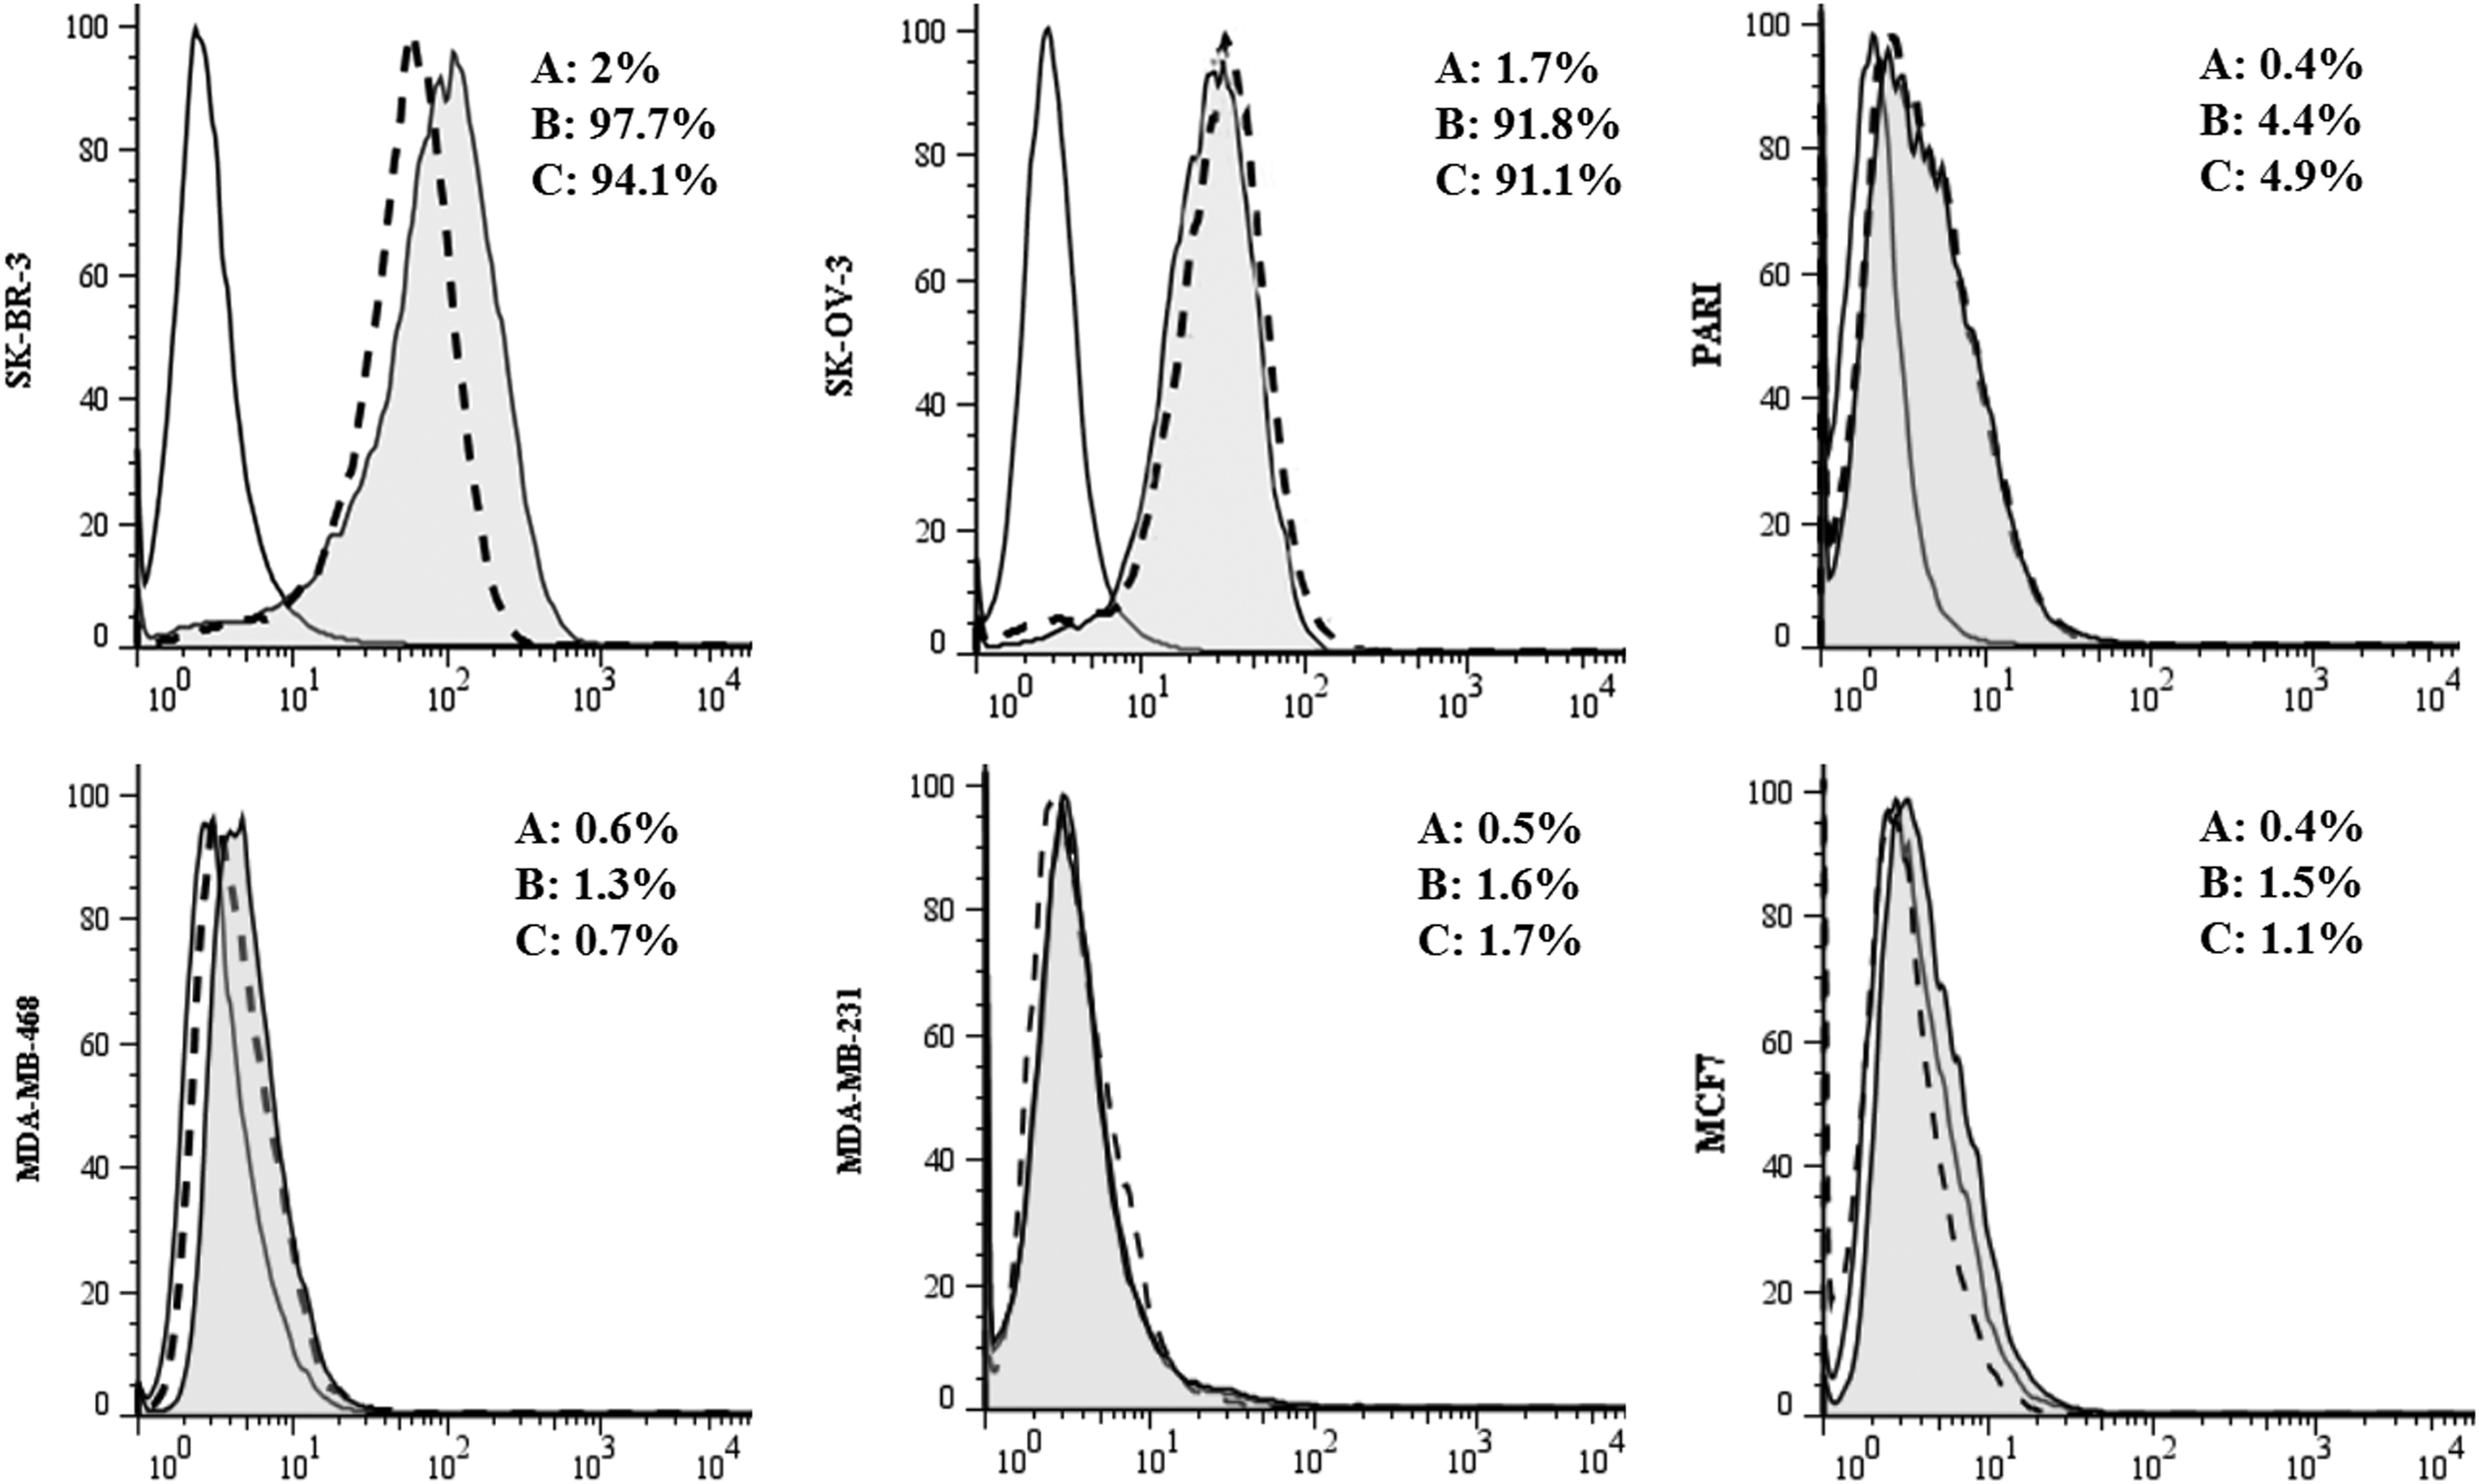
Investigation of membrane binding of purified mAb to ErbB2. Indirect surface staining on SK-BR-3, SK-OV-3, PARI, MDA-MB468, MDA-MB-231, and MCF7 cells using 0.1 μg/mL of purified pertuzumab and Perjeta as primary antibodies. Cells incubated only with secondary antibody were included as control. The membrane binding percentages are shown for each case. Solid peaks showed control
Mean fluorescent intensity of membrane binding of purified mAb to ErbB2 was calculated by dividing the mean fluorescent intensity of each sample by mean fluorescent intensity of control.
CHO, Chinese hamster ovary; ErbB2, epidermal growth factor receptor-2; mAb, monoclonal antibody.
Analysis of direct biological activity of produced pertuzumab using MTT assay
To analyze the in vitro effect of produced pertuzumab from CHO-S 20–50 cell pool on the proliferation of SK-BR-3 and MDA-MB-231 cell lines, a colorimetric assay (MTT assay) was performed (Fig. 9A, B). The combinations of Herceptin with Perjeta or pertuzumab in equal molar ratio, and each antibody alone, were used for calculation of growth inhibition rate. Figure 9C–F show that the dose-dependent growth inhibition curves, which were produced for pertuzumab and Perjeta, are similar and no significant difference was observed. Also, a similar dose-dependent pattern was observed for both the combination of pertuzumab and Perjeta with Herceptin, with no significant difference. On the other hand, significant differences were observed between the inhibition growth rates of these combinations with each antibody at higher molar concentrations (10, 100, and 1000 nM). Also, at molar concentrations more than 100 nM, all cases showed nonspecific proliferation inhibition on the MDA-MB-231 cell growth rate.
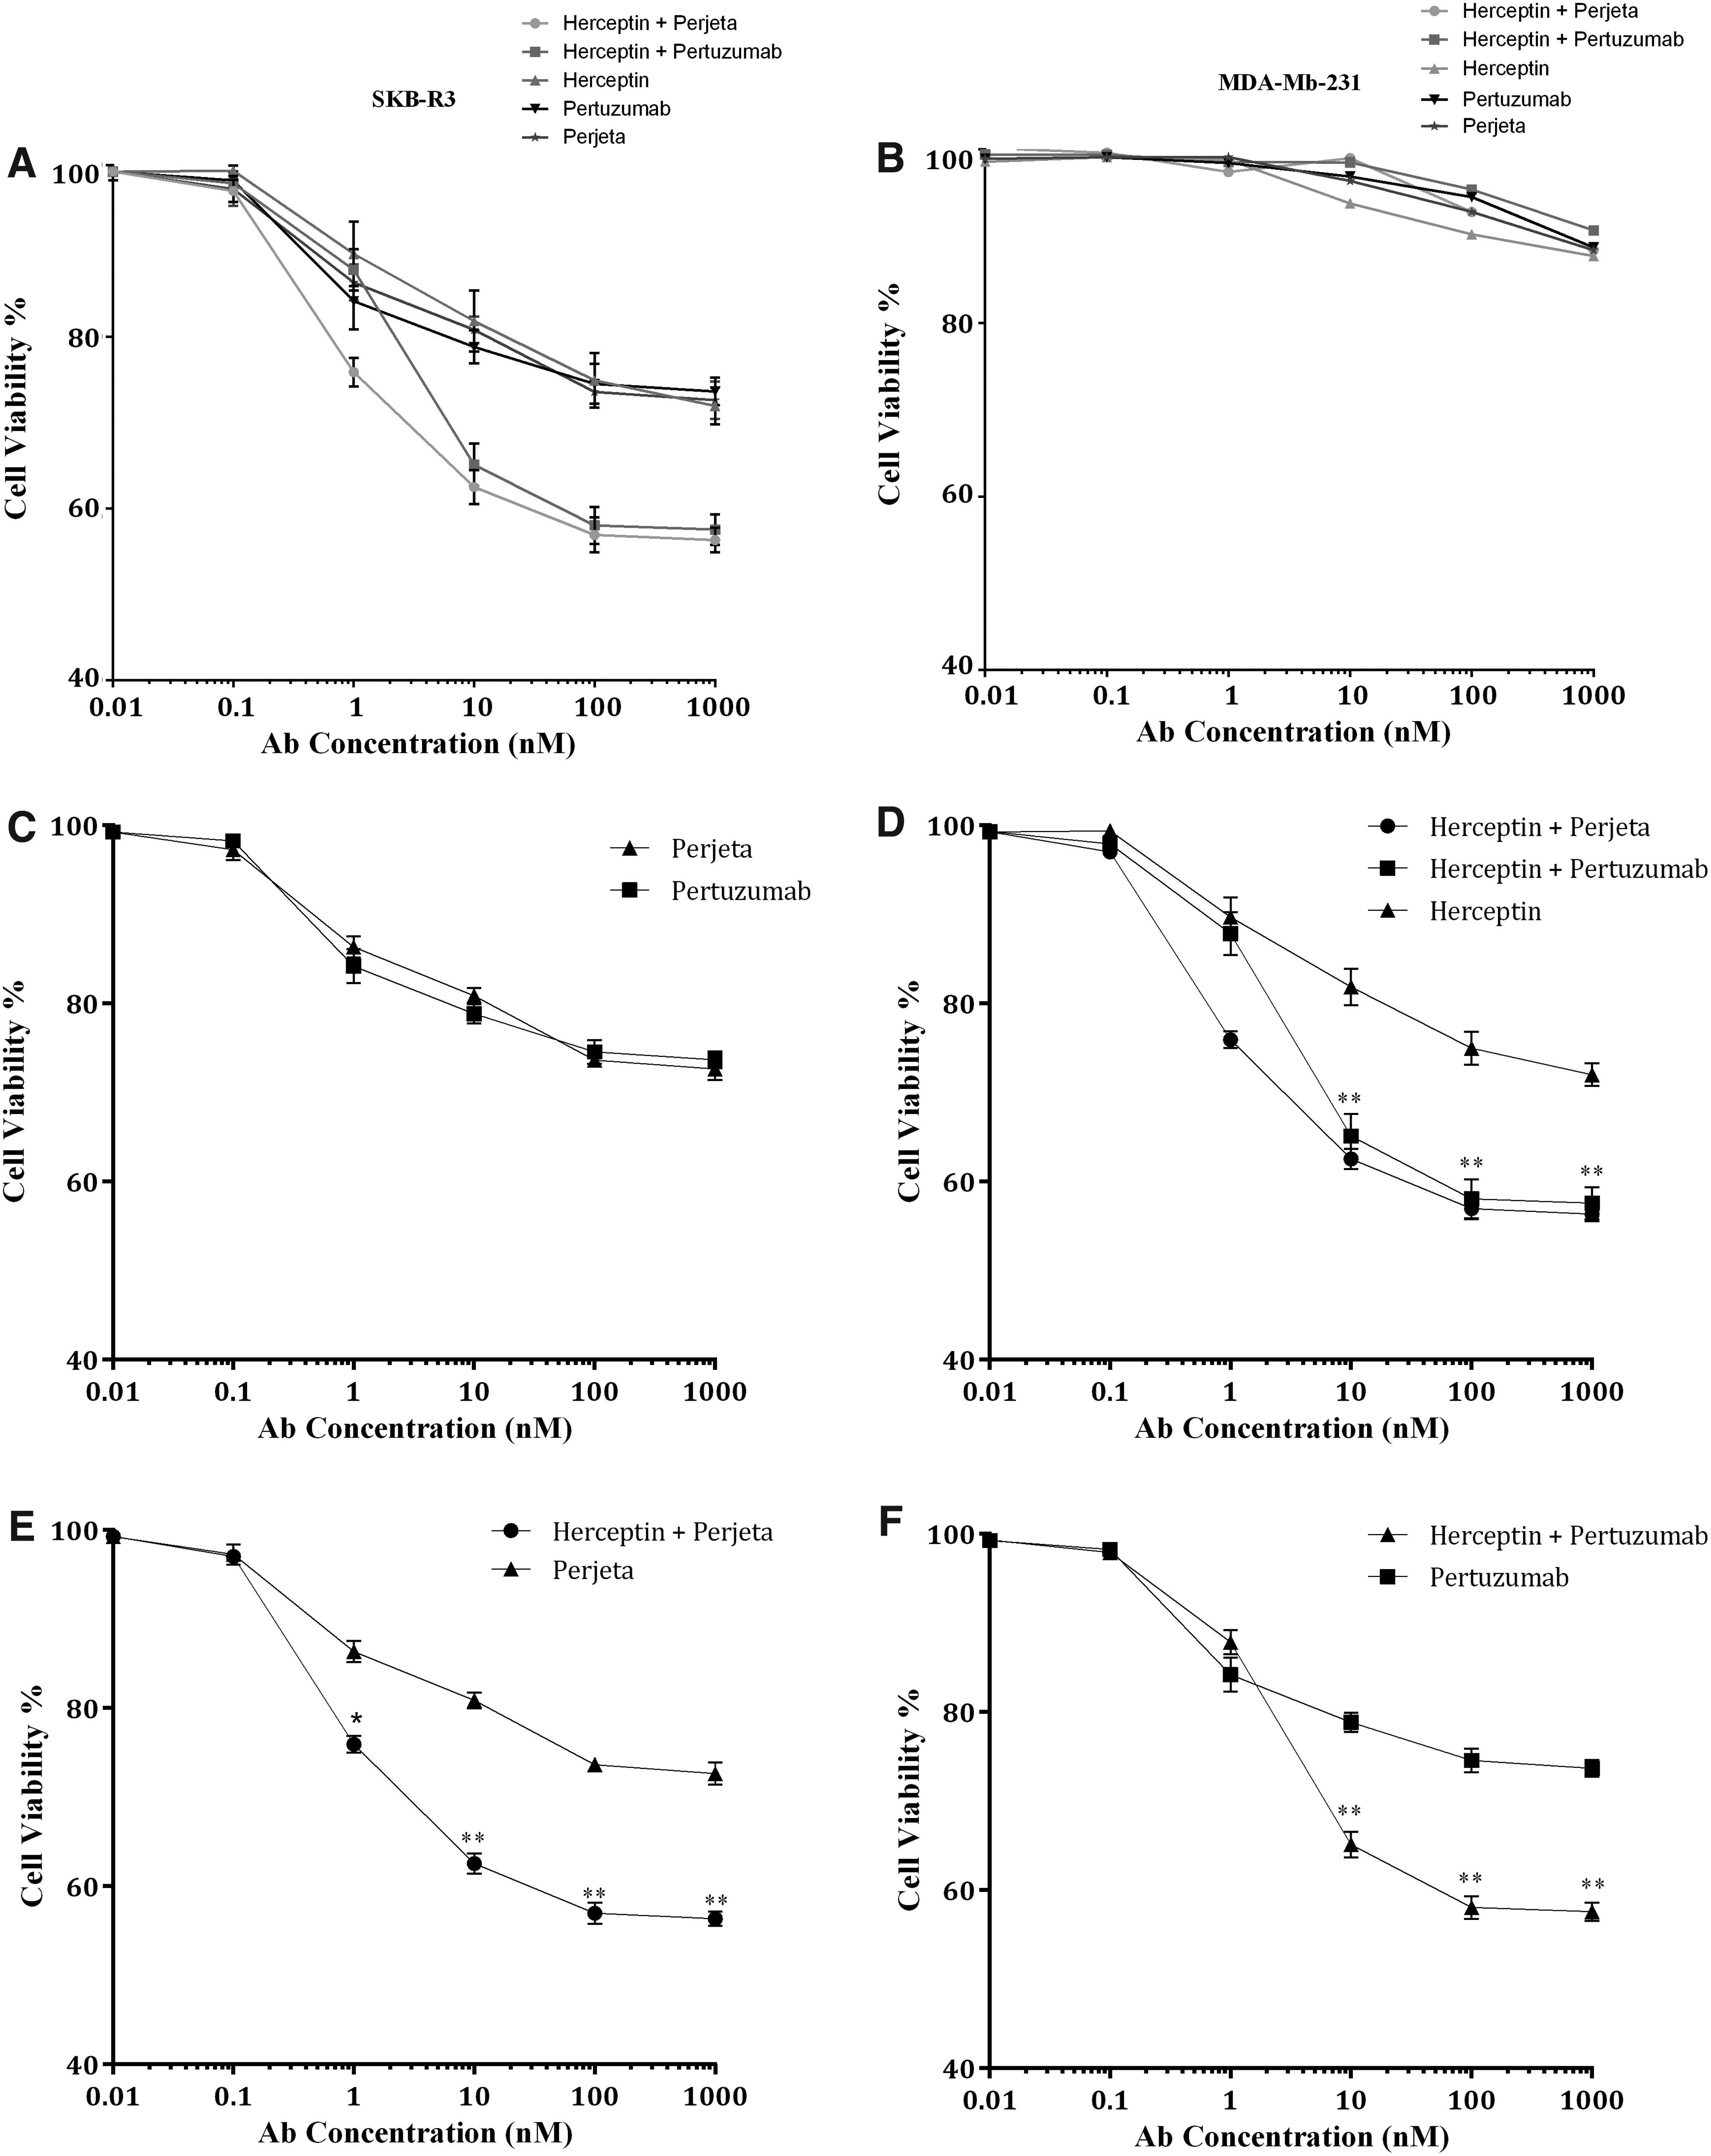
MTT assay for the assessment of in vitro biological activity of produced pertuzumab from CHO-S cell line, Perjeta, Herceptin, and the combination of pertuzumab and Perjeta with Herceptin, in equal molar ratio, on the proliferation of
Discussion
To obtain cell pools that could produce high titers of pertuzumab, a two-phase selection strategy, which can generate up to four pools of stably transfected cells, was used. One pool did not show signs of recovery after 20 days in selection phase 2 and the culture was eliminated, while in three other cultures, after 20 days, the cell viability met or exceeded more than 90%.
To assess the productivity of three stable CHO-S cell pools resulted from selection phase 2, a simple fed-batch experiment was designed at 37 and 35°C. The maximum pertuzumab production rate at 37°C is related to 20–50 culture flask with 150.6 mg/L, which takes place on day 5. The cells could not survive more than 8 days. Culture flasks in the case of 35°C, cells survived in culture for 9 days and the productivity rate exceeded. Similarly, in this temperature, 20–50 pool produced the maximum amount of pertuzumab in supernatant, and here, the concentration of 442.6 mg/L was achieved at 8 days. Our results are consistent with the results of Furukawa and Ohsuye, which reported that decreasing culture temperature below 37°C lead to inhibited cell growth, enhanced cellular productivity of the recombinant protein, maintained high cell viability, suppressed medium consumption, and suppressed release of impurities from the cells.(33)
Also, this result is consistent with Rezaei et al., which investigated the effect of different media composition and temperatures on the production of recombinant human growth hormone by CHO cells and reported that culture temperature below 37°C led to enhanced cellular productivity of the rhGH by threefold.(34) Moreover, Vergara et al. showed a positive effect on the specific productivity of recombinant protein in CHO cells by decreasing specific growth rate at 33°C.(35)
As can be observed in Figure 4, the pattern of pertuzumab productivity level from transient state to the end of selection phase 2 for all three pools demonstrates the amplification of pertuzumab HC and LC coding genes in the genome of the CHO-S cells. Comparison of the production titers of 10–30, 20–30, and 20–50 pools in this figure indicates that there is a direct relationship between the puromycin/MTX level and the rate of protein production.
Evaluation of ErbB2-binding activity
Indirect ELISA results showed no significant differences between membrane binding of produced pertuzumab in CHO-S cell line with Perjeta in binding to recombinant extracellular part of ErbB2 and membrane ErbB2 on the surface of SK-BR-3 cell line. Also, no nonspecific binding was observed with MDA-MB-231 cell lysates, which is an ErbB2-negative cell line. This result indicated that the pattern of ErbB2 binding of produced pertuzumab is similar to that of Perjeta in a wide range of antibody concentrations (1 to 1 × 10⁷ ng/L). The differences between the binding pattern of rErbB2 protein and SK-BR-3 cell lysate could be due to the differences between the concentrations of ErbB2 antigen in these two samples. This sigmoidal curve in different antigen concentrations can be used for the calculation of affinity constant, although the pattern of reactivity with MDA-MB-231 cell lysate revealed that the produced antibody had no nonspecific binding.
According to Western blotting results, purified pertuzumab from stably transfected CHO-S 20–50 cell pool had perfect specificity in binding to nonreduced form of ErbB2 antigen. On the other hand, Western blot analysis using different concentrations of purified pertuzumab (1, 2, 5, and 10 μg) revealed that 1 μg of purified mAb is sufficient as running antigen for conducting immunoblotting (data not shown). The results of Western blot showed that the produced mAb was correctly assembled, and 148 kDa protein was generated using CHO-S stably transfected cell pool. Since the HC fragment has an Fc region and during affinity purification process can bind to protein G, the lack of detectable HC band in this experiment revealed that HC and LC were correctly assembled to 148 kDa tetramer structure. In both experiments, the pattern of reactivity for Perjeta was similar to the pattern of produced pertuzumab.
Flow cytometric analysis of membrane binding of a purified mAb from a stably transfected CHO-S cell to ErbB2 on MCF7, MDA-MB-231, MDA-MB-468, PARI, SK-BR-3, and SK-OV-3 cells can be observed in Figure 8. According to this figure, purified antibody showed around 94% membrane binding on the SK-BR-3, which is an ErbB2+++ cell line, and Perjeta as positive control showed 97% membrane binding. These differences in membrane binding and normalized MFI could be the result of different purity of these antibodies (several types of impurities, such as different levels of salts and different pH levels, are the most important factors affecting the antigen-antibody reaction).(32,36)
Also, both antibodies have around 91% membrane binding on the SK-OV-3 cell, which is an ErbB2++ cell line. The normalized MFI of around 11 was achieved for this cell line. The pattern of membrane binding and normalized MFI revealed that the produced mAb has no nonspecific binding on the surface of ErbB2-negative cell lines. Different numbers of ErbB2 receptor on the surface of SK-BR-3 and SK-OV-3 cell lines led to the observed differences between the MFIs obtained for these two cell lines.
Assessment of biological activity
The in vitro biological activity of produced pertuzumab in CHO-S cell line was analyzed using the MTT assay. As discussed previously, when the ErbB2 dimerization inhibitor, pertuzumab, is used in combination with trastuzumab, significant clinical responses are reported.(37–39) Therefore, in MTT experiments, the antiproliferative effect of pertuzumab in combination with trastuzumab and each antibody alone was analyzed on SK-BR-3 (ErbB2 positive) and MDA-MB-231 (ErbB2 negative) cell lines. As shown in Figure 9, the pattern of biological activity of produced pertuzumab is similar to Perjeta, and no significant difference can be observed. According to this figure, Herceptin, Perjeta, and produced pertuzumab have almost similar pattern of biological activity on the SK-BR-3 and MDA-MB-231 cell lines. This is important to notice that higher molar ratios of these antibodies have nonspecific biological activity and can inhibit the proliferation of ErbB2-negative cells.
On the other hand, when the combination of produced pertuzumab or Perjeta with Herceptin in equal molar ratio, was used, a significantly higher antiproliferative effect was observed. The antiproliferative effect of these combinations is significantly higher than all antibodies alone. It is worth mentioning that, the assessment of biological activity of mAbs like pertuzumab and trastuzumab using the MTT assay, which does not include an Fc-related biological activity, is only suitable for analysis of Fab-related biological activity of the mAb (which may be weak, in the case of pertuzumab and trastuzumab). Our results are consistent with that of Yamashita-Kashima et al., which compared the antiproliferative effect of pertuzumab, trastuzumab, and their combination in NCI-N87, an ErbB2-positive human gastric cancer cell line, using MTT assay, and concluded that pertuzumab could potentiate its antiproliferation activity in combination with trastuzumab.(40)
Blancafort et al. applied MTT experiment to evaluate the biological activity of the combination of trastuzumab and pertuzumab on SK-BR-3 cell line and resulted that 5 μg/mL of pertuzumab and 20 μM of trastuzumab were needed to inhibit the proliferation of 50% of SK-BR-3 cells, while each antibody alone could not achieve 50% inhibition in these concentrations(41) Toth et al. reported that the pertuzumab mAb was less efficient in decreasing the proliferation of BT-474 cell line, than the combination of trastuzumab and pertuzumab.(12) Phillips et al., in the study of treatment of ErbB2-overexpressing cell lines with T-DM1 plus pertuzumab, resulted that pertuzumab could not significantly inhibit the proliferation of SK-BR-3 cell line in vitro, while showed an acceptable biological activity in the inhibition of MDA-MB-175 cell proliferation.(11)
Our further approach will be in vitro comparison of the Fc-related biological activities (ADCC and CDC) of produced pertuzumab with Perjeta. Then, limiting dilution cloning and clone scale-up will be used to obtain homologues stable cell lines capable of producing high levels of pertuzumab mAb.
Conclusion
The aim of this study was to produce the biosimilar version of pertuzumab in CHO-S cells and evaluate its ErbB2-binding and biological activities. For this purpose, a DHFR-based strategy was selected to produce a stably transfected cell pool, capable of producing high level of pertuzumab. In this regard, a two-phase selection strategy based on increasing concentrations of puromycin and MTX was used for the successful amplification of pertuzumab HC and LC coding genes in the genome of CHO-S cell line. Finally, three stable CHO-S cell pools were achieved and analyzed for the productivity in a simple fed-batch culture system. Results showed that, the pool with puromycin to a final concentration of 20 μg/mL and MTX to 200 nM in the selection phase 1 and puromycin to a final concentration of 50 μg/mL and MTX to 1000 nM in the selection phase 2 produced and secreted the highest amount of mAb to the culture medium (442.5 mg/L at 8 days). Assessment of binding and biological activity of produced pertuzumab revealed its high similarity with commercially available pertuzumab, Perjeta.
Footnotes
Acknowledgments
This work was supported by Shiraz University of Medical Sciences (Grant no. 92-6802), Shiraz Institute for Cancer Research (Grant no. ICR-100-509) and Iranian Medical Biotechnology Network.
Author Disclosure Statement
No competing financial interests exist.
References
Supplementary Material
Please find the following supplemental material available below.
For Open Access articles published under a Creative Commons License, all supplemental material carries the same license as the article it is associated with.
For non-Open Access articles published, all supplemental material carries a non-exclusive license, and permission requests for re-use of supplemental material or any part of supplemental material shall be sent directly to the copyright owner as specified in the copyright notice associated with the article.