




Abstract
The relationship between expression of adeABC and minimal inhibitory concentration (MIC) of tigecycline was investigated by RT-PCR and statistical analyses in a population of 106 clinical isolates (MIC range, 0.0313–16 μg/ml) of Acinetobacter calcoaceticus–Acinetobacter baumannii complex. There was a statistically significant linear relationship (p < 0.0001) between log-transformed expression values and log-transformed MIC values, indicating that overexpression of AdeABC efflux pump is a prevalent mechanism for decreased susceptibility to tigecycline in A. calcoaceticus–A. baumannii complex.
Acinetobacter has received a lot of publicity recently mainly because of resistance to multiple antibiotics and its ability to cause a wide spectrum of infections. Four genomospecies of Acinetobacter—1 (A. calcoaceticus), 2 (A. baumannii), 3, and 13–are difficult to separate in the clinical laboratory and have been referred to as the A. calcoaceticus–A. baumannii complex. The AdeABC efflux pump of A. baumannii belongs to RND family of multidrug transporters and contributes to resistance to various classes of antibiotics, including β-lactams, aminoglycosides, and quinolones.6,9,10 In addition to adeABC genes that encode the structural components of the pump, the ade gene cluster includes adeRS genes, which encode the AdeRS two-component system that regulates expression of AdeABC.6,9,10
Tigecycline is generally effective against A. calcoaceticus–A. baumannii complex; however, a number of clinical strains with decreased tigecycline susceptibility have been isolated. As shown in the previous studies, overexpression of AdeABC pump was associated with reduced susceptibility to tigecycline in several clinical isolates (a total of four less-susceptible isolates) of A. calcoaceticus–A. baumannii complex.12,15
This study was performed to assess the relationship between the level of expression of adeABC and the minimal inhibitory concentration (MIC) of tigecycline in a larger set of clinical isolates of A. calcoaceticus–A. baumannii complex to establish the prevalence of AdeABC-mediated mechanism of decreased susceptibility to tigecycline.
Out of the total 106 clinical isolates of A. calcoaceticus–A. baumannii complex used in this study, 69 strains were from tigecycline clinical trials and represented a diverse group of patients from various hospitals and infection sites. Four of those strains, G4904, G5139, G5140, and G5141, were described previously. 15 The additional 37 clinical isolates were obtained from International Health Management Associates and JMI Laboratories. The strains were propagated at 37°C in Luria–Bertani broth or agar. The MIC of tigecycline was determined by standard broth microdilution test.2,3 Tests for tigecycline susceptibility were performed using fresh Muller–Hinton broth (<12 hr old).
Preparation of RNA templates and reverse transcriptase–polymerase chain reaction (RT-PCR) analysis of adeA expression was done as described previously. 15 Relative quantification of the target gene expression (adeA) was performed by iCycler iQ5™ software using normalized expression analysis method, 16S rRNA gene served as a reference gene, and strain G4904 15 served as a reference condition.
Expression of adeA was measured in duplicate in a single experiment, and the average of the two measurements was calculated. The geometric mean expression was calculated for each strain and used in the regression analysis. For 12 strains, adeA expression was below the limit of quantitation by the RT-PCR assay. For these strains, a value of half the minimum value observed across all other strains was substituted for analysis purposes.
The nature of the association between MIC and expression levels was addressed by a linear regression analysis, which assumes a linear relationship between MIC and expression. The analysis was performed using SAS for Windows, version 9.1, using SAS procedure GLM. Statistical significance was established using a conventional p = 0.05 level.
The log2-transformed MIC and log2-transformed adeA expression levels for the 106 strains are plotted in Fig. 1, which reveals an approximately linear relationship, on the log scale, between expression and MICs. There was a considerable variability in expression levels at most MICs, with markedly decreased variability at the lowest MICs (≤0.25 μg/ml) as would be expected as expression levels approach the RT-PCR assay limit of detection. Because linear regression analysis assumes that variability in expression levels among strains is similar at each MIC, the analysis was limited to MIC values ≥0.5 μg/ml. However, qualitative outcome of regression analysis was not affected by including the data for all of the MIC values.
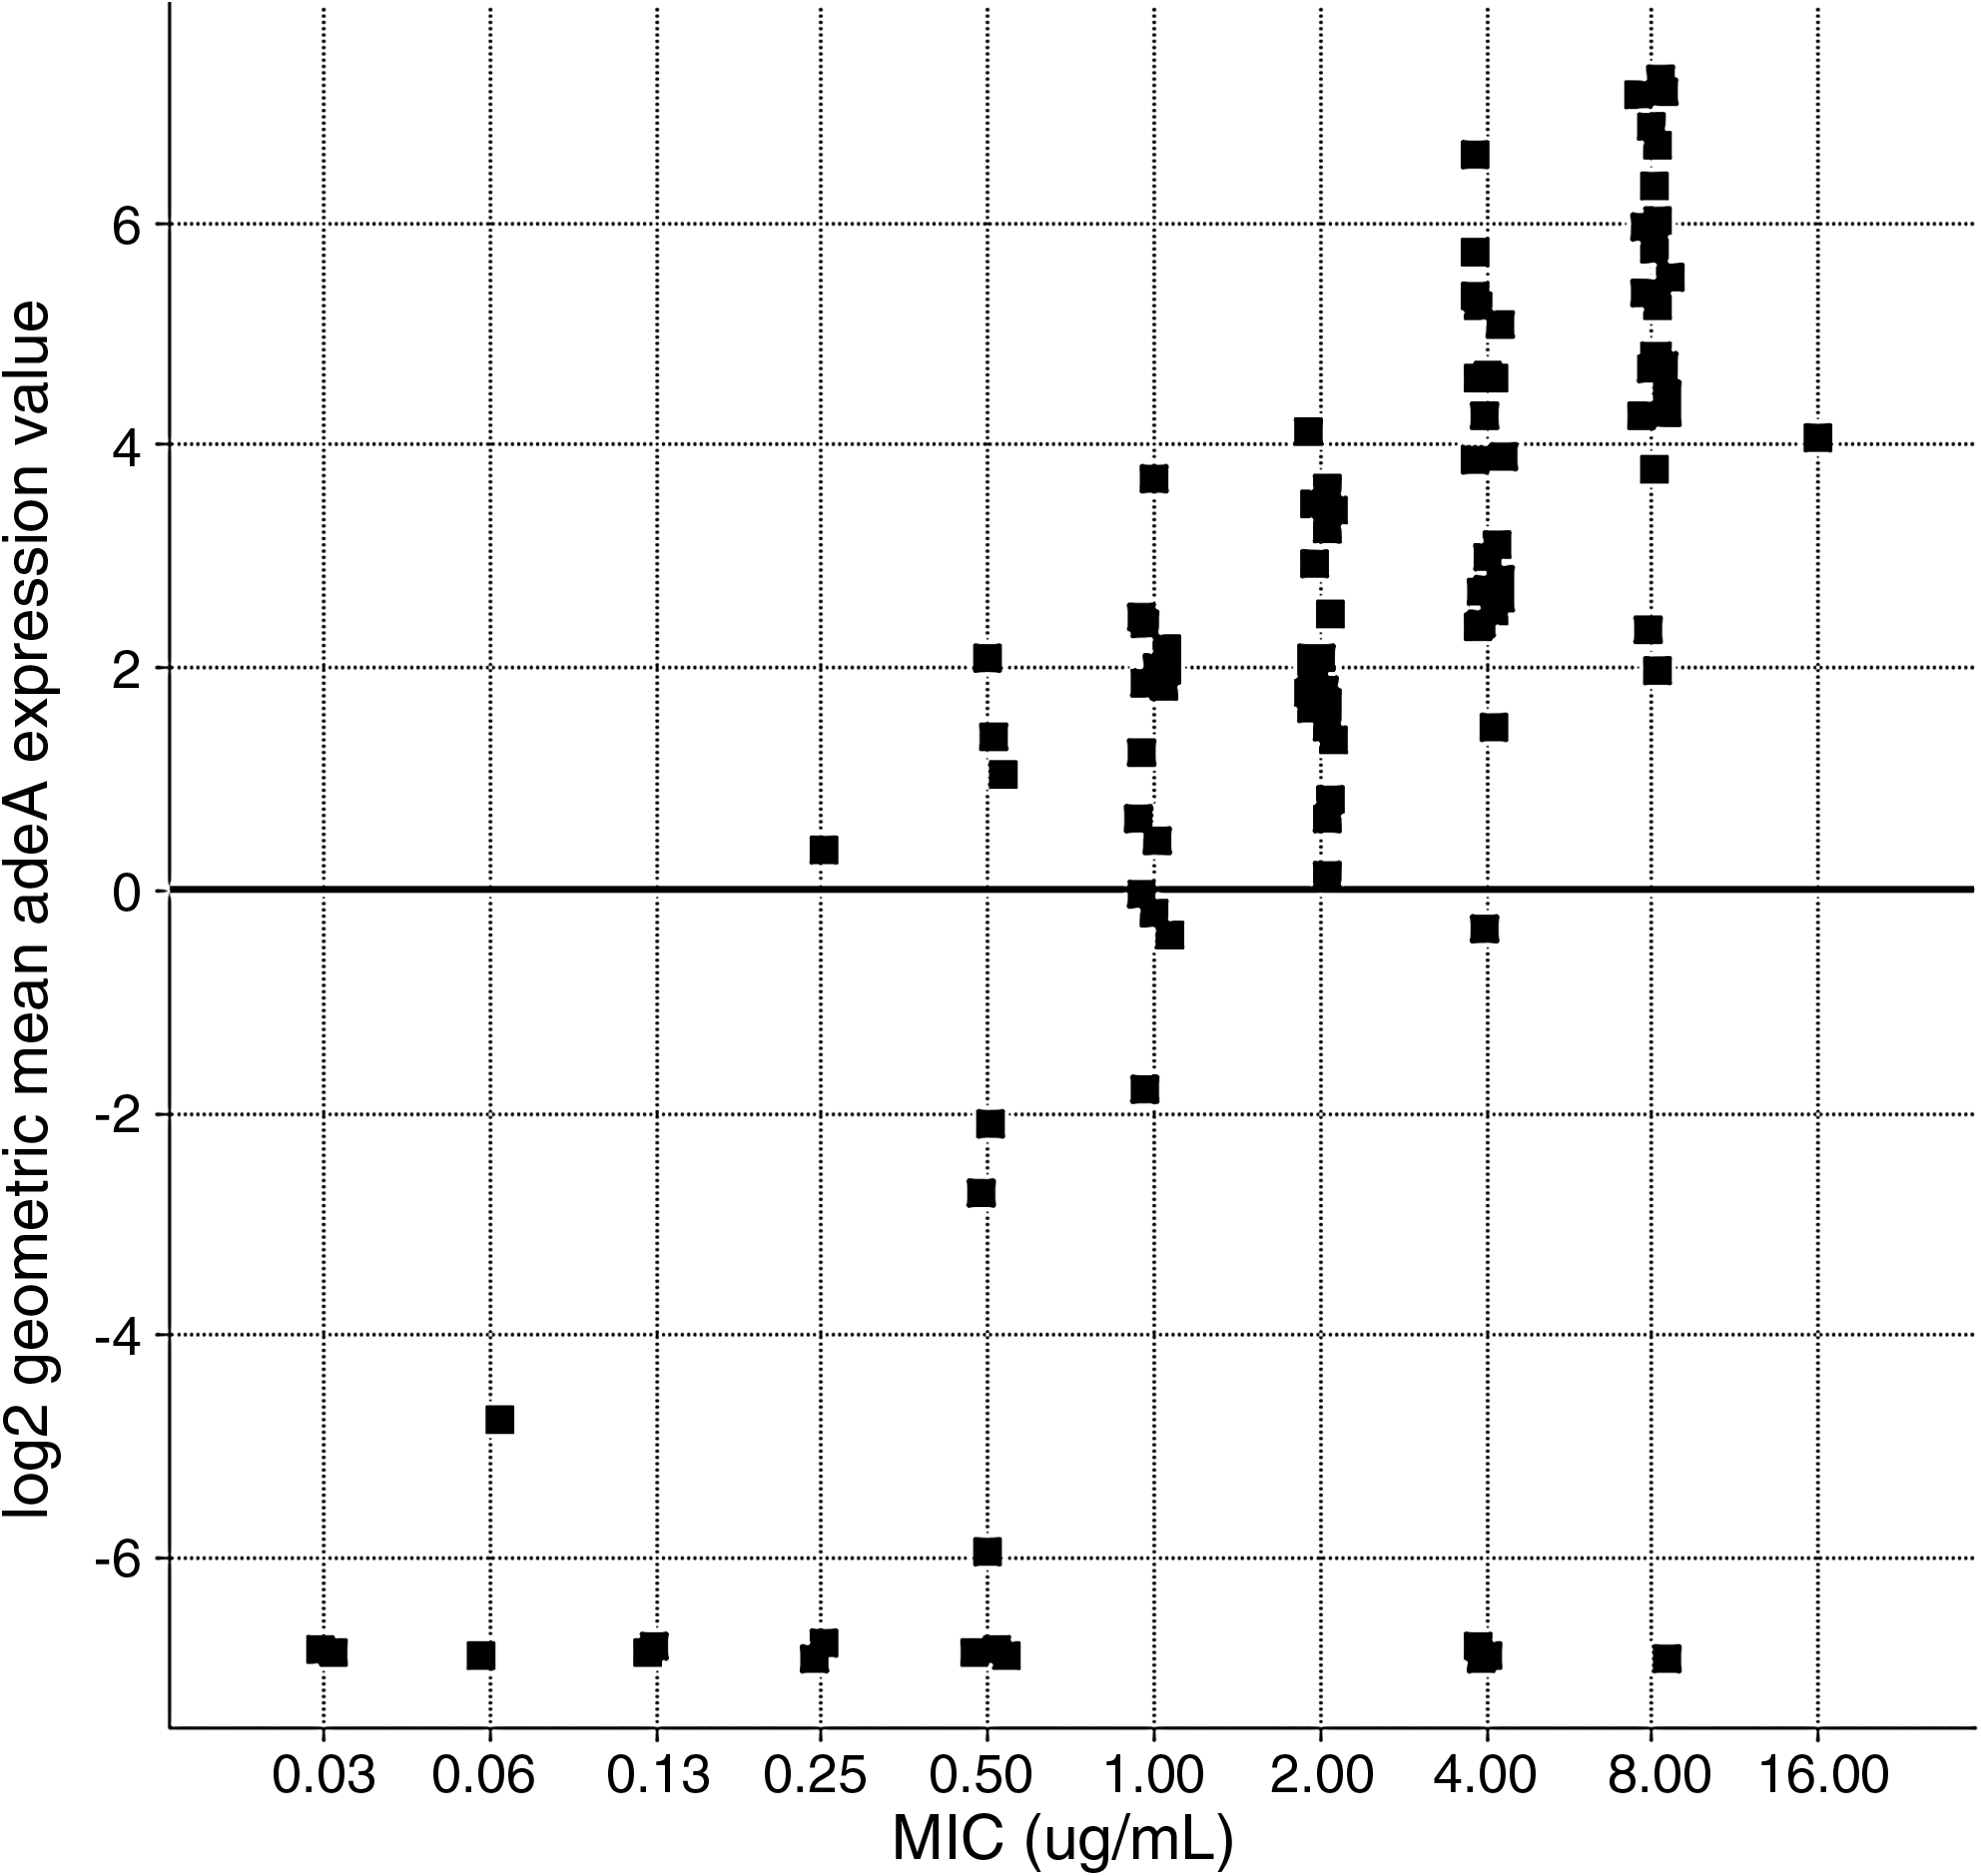
Expression of adeA versus tigecycline minimal inhibitory concentration (MIC). Shown on the vertical axis are log2-transformed geometric mean adeA expression values. The horizontal axis shows tigecycline MIC values plotted on the log scale. Linear regression analysis of adeA expression on tigecycline MIC was performed for MIC values ≥0.5 μg/ml.
Under the assumption of a linear relationship between log2 MIC and log2 adeA expression levels, linear regression analysis provided predicted mean expression levels and associated 95% confidence limits at each MIC. The regression-based estimates, both on the log2 scale and back-transformed to the original scale, are presented in Table 1. The linear regression itself was statistically significant, with a p-value of less than 0.0001.
Predicted log2 expression means and confidence limits are based on linear regression of log2 adeA expression on log2 MIC. Expression relative to G4904 was calculated by back-transforming the log2 means and confidence limits.
Number of strains.
MIC, minimal inhibitory concentration; CL, confidence limits.
In conclusion, log-transformed adeA expression and log-transformed MIC had a statistically significant, positive linear relationship for tigecycline MICs in the range of 0.5 to 16 μg/ml. Because adeA, adeB, and adeC genes are cotranscribed, 10 adeA expression level reflected the expression level of the entire adeABC cluster. This result indicates that overexpression of AdeABC efflux pump is a prevalent mechanism in those clinical isolates A. calcoaceticus–A. baumannii complex that developed decreased susceptibility to tigecycline. Because there was only a single strain with MIC of 16 μg/ml, whether the relationship is truly linear at MICs of 16 μg/ml and above cannot be clearly determined without the data on more strains with the higher MIC values.
As reported previously, although AdeABC system is present in the vast majority of A. baumannii strains, the individual genes from the ade gene cluster may be absent in some mostly fully susceptible isolates. 11 This might explain the absence of quantifiable adeA expression in some of the isolates from this study. Nevertheless, including these strains in the study did not affect the statistically significant outcome of the linear regression analysis. As shown in Fig. 1, in a few isolates that resulted in tigecycline MIC of 4 μg/ml (three isolates) and 8 μg/ml (one isolate), no expression of adeA was detected, suggesting that additional mechanism(s), other than overexpression of AdeABC, might contribute to decreased tigecycline susceptibility in A. calcoaceticus–A. baumannii complex. One candidate is a second RND-type multidrug efflux pump AdeIJK, which was recently identified in A. baumannii. 4 Gene inactivation studies suggested that, together with AdeABC, AdeIJK pump contributed to resistance to tetracycline, minocycline, and tigecycline in a clinical isolate A. baumannii BM4454. 4
Other multidrug efflux pumps that were described in A. calcoaceticus–A. baumannii complex include AdeDE (genomospecies 3) 1 and AbeM (A. baumannii). 16 Further experiments are required to determine the extent of the contribution of AdeIJK and possibly other resistance determinant(s) to decreased tigecycline susceptibility in a large population of clinical isolates of A. calcoaceticus–A. baumannii complex.
Footnotes
Acknowledgments
The authors thank Brian Johnson from International Health Management Associates and Helio Sader from JMI Laboratories for providing a collection of 37 clinical isolates of A. calcoaceticus–A. baumannii complex.
Disclosure Statement
No competing financial interests exist.