
Abstract
This study was conducted to elucidate the accuracy of the current streptomycin epidemiological cut-off value (ECOFF) for Escherichia coli and Salmonella spp. A total of 236 Salmonella enterica and 208 E. coli isolates exhibiting MICs between 4 and 32 mg/L were selected from 12 countries. Isolates were investigated by polymerase chain reaction for aadA, strA, and strB streptomycin resistance genes. Out of 236 Salmonella isolates, 32 (13.5%) yielded amplicons for aadA (n = 23), strA (n = 9), and strB (n = 11). None of the 60 Salmonella isolates exhibiting MIC 4 mg/L harbored resistance genes. Of the Salmonella isolates exhibiting MICs 8 mg/L, 16 mg/L, and 32 mg/L, 1.6%, 15%, and 39%, respectively, tested positive for one or more genes. For most monitoring programs, the streptomycin ECOFF for Salmonella is wild type (WT) ≤32 or ≤16 mg/L. A cut-off value of WT ≤32 mg/L would have misclassified 13.5% of the strains as belonging to the WT population, since this proportion of strains harbored resistance genes and exhibited MICs ≤32 mg/L. Out of 208 E. coli strains, 80 (38.5%) tested positive for aadA (n = 69), strA (n = 18), and strB (n = 31). Of the E. coli isolates exhibiting MICs of 4 mg/L, 8 mg/L, 16 mg/L, and 32 mg/L, 3.6%, 17.6%, 53%, and 82.3%, respectively, harbored any of the three genes. Based on the European Committee on Antimicrobial Susceptibility Testing guidelines (ECOFF ≤16 mg/L), 25% of the E. coli strains presenting MIC ≤16 mg/L would have been incorrectly categorized as belonging to the WT population. The authors recommend an ECOFF value of WT ≤16 mg/L for Salmonella and WT ≤8 mg/L for E. coli.
Introduction
Several mechanisms of resistance have been described in bacterial species belonging to the family Enterobacteriaceae. These are mainly attributed to aminoglycoside-modifying enzymes. 23 The most common genes associated with streptomycin resistance are the phosphotransferase genes encoded by strA and strB.13,14,19 In addition, the aadA gene encode for an aminoglycoside adenylyltransferase that inactivate streptomycin and spectinomycin. 15 aadA genes are widely disseminated among Enterobacteriaceae and generally located on gene cassettes integrated into integrons. 6 Mutations in the rpsL gene encoding the ribosomal protein S12 are also known to confer resistance to streptomycin.7,22,24
In general, streptomycin is used as an epidemiological marker in monitoring programs for antimicrobial resistance in Salmonella and Escherichia coli. In particular, streptomycin resistance in Salmonella is used as an indicator for the presence of the pentaresistance phenotype, exhibiting resistance to ampicillin, chloramphenicol, streptomycin, sulphonamides, and tetracyclines associated with Salmonella enterica serovar Typhimurium phage type DT104. 1
Several proficiency tests involving antimicrobial susceptibility testing have consistently reported discrepancies in the interpretation of results obtained when performing these tests against streptomycin for E. coli and Salmonella.9,10,12 These differences might be the consequence of the epidemiological cut-off values (ECOFF)/breakpoints used for categorizing the strains as wild type (WT)/non-WT. The purpose of ECOFF values is to separate the WT (microorganisms without acquired resistance mechanisms) and non-WT population, which is defined as microorganisms with acquired resistance mechanisms to an agent. 18 According to data collected by the European Committee on Antimicrobial Susceptibility Testing (EUCAST, www.eucast.org), the recommended ECOFF value for streptomycin is WT ≤16 mg/L for both Salmonella and E. coli (data from the EUCAST MIC distribution Web site, last accessed 8 March, 2011). The Clinical and Laboratory Standards Institute has not defined clinical breakpoints for interpretation of minimum inhibitory concentrations (MIC) for streptomycin. As a result, some monitoring programs such as the National Antimicrobial Resistance Monitoring System (www.cdc.gov/narms/) and the Canadian Integrated Program for Antimicrobial Resistance Surveillance (www.phac-aspc.gc.ca/cipars-picra/analys-eng.php) have set their ECOFF values for interpretation at ≤32 mg/L for both organisms.
In a study carried out by Sunde and Norstrom, 21 136 E. coli strains with MICs ≥16 mg/L collected from the Norwegian monitoring program for antimicrobial resistance in bacteria from feed, food, and animals (NORM-VET, www.vetinst.no/eng) were investigated. Streptomycin resistance genes were detected in 65% of the strains with MIC =16 mg/L. Based on the results, it was proposed that WT ≤8 mg/L was as a better cut-off value for streptomycin. A similar study performed by Doran et al. in Salmonella Typhimurium concluded that interpretive criteria for streptomycin MIC results should be susceptible at ≤8 mg/L and resistant at >16 mg/L. 5
The purpose of this study was to establish the most optimal ECOFF MIC values for streptomycin with respect to E. coli and Salmonella and correlate the presence/absence of streptomycin resistance genes with MICs. We have investigated the presence of the most common streptomycin resistance genes described in Enterobacteriaceae (aadA, strA, and strB) in a total of 444 isolates (236 Salmonella and 208 E. coli) exhibiting MIC values ranging between 4 and 32 mg/L. To minimize any possible bias due to geographical clustering of resistance genes or phenotypic trends, the isolates were collected from 12 different countries.
Materials and Methods
Selection of isolates
The European Union Reference Laboratory for Antimicrobial Resistance (EURL-AR) circulated a project proposal to the 27 veterinary and food safety institutes within the network of national reference laboratories for antimicrobial resistance appointed by the European Union. In addition, the Public Health Agency of Canada, Centers for Disease Control and Prevention in the United States, and the Institute for Infectious Disease Control and Prevention in China (Henan province) were invited to participate. Participating institutions were requested to select a maximum of 20 Salmonella and 20 E. coli isolates from their respective national collections. For both genera, every institute was asked to randomly select five isolates from routine monitoring with the following streptomycin MIC values: 4, 8, 16, and 32 mg/L. A total of 12 institutes situated in Germany, Denmark, Norway, Sweden, Spain, Portugal, the Netherlands, France, Italy, Finland, the United Kingdom, and Canada accepted the invitation. The United Kingdom participated in the Salmonella study only. Portugal obtained only one E. coli isolate for each of the following streptomycin MIC values: 8, 16, and 32 mg/L, respectively, and only two Salmonella isolates exhibiting MIC 32 mg/L. France tested four instead of five Salmonella isolates exhibiting MIC 32 mg/L. As a result, a total of 208 E. coli and 236 Salmonella isolates were included in the study.
In addition, each country provided information on the streptomycin MIC distribution for both genera during 2007 or 2008. Countries lacking these data provided the distribution of the populations for periods they had available. MIC distributions reported by Canada were excluded from the analysis since they only reported the number of isolates with MIC ≤32, 64, and >64 mg/L.
Quality control of MIC results obtained by participating institutions
Invitation is annually announced through the EURL-AR network to all national reference laboratories in antimicrobial resistance to participate in a self-evaluating proficiency tests (EQAS external quality assurance system) for antimicrobial susceptibility testing in E. coli and Salmonella. These trials are conducted each year to test if the current methodologies are accurate, adequate, and reliable. The goal is to have all laboratories performing antimicrobial susceptibility testing with a maximum of 5% deviations. Eight strains of each species (E. coli and Salmonella) are selected for each EQAS iteration. Participating laboratories are instructed to perform the susceptibility testing method that is routinely used by their laboratory. After completion of the susceptibility testing of the test strains and the quality control strains, the participating laboratories are instructed to record the obtained results, using MIC values or zone-diameter in millimeters, and categorize each of the tested strains as either resistant (R) or susceptible (S) against each tested antimicrobial agent applying the EUCAST ECOFF values. After submitting the data to the secured Web site, the laboratories obtain an instantly generated individual report evaluating the submitted results where all deviations from the expected interpretations are reported. For the quality control strains, deviations are defined as values that exceed the quality control range of the strain. For both genera Salmonella and E. coli, during the EQAS 2008 and 2009, the overall performance range between 98% and 98.3% correctly categorized isolates, respectively. All laboratories participating in this study routinely performed MIC methods (Sensititre, Trek Diagnostic Systems, Magallan Bioscience or VetMIC™, SVA, Sweden) with the exception of two laboratories that used the agar dilution method and disk diffusion, respectively. In addition, when evaluating the results obtained testing the EQAS strains against streptomycin in the EQAS 2010, only two laboratories failed to obtain the expected MIC value in only one strain of the eight evaluated; these MIC values deviated with a one-step dilution from the expected result. Further, laboratories participating in this study produced between 98% and 100% of correct results. With similar percentage of correct results, the Public Health Agency of Canada has participated in the World Health Organization (WHO) EQAS for Salmonella. The WHO EQAS proficiency test is also carried out annually in the same terms as the one described above. 10
Detection of streptomycin resistance genes
All isolates were examined by polymerase chain reaction (PCR) for the presence of the following genes: aadA (aadA1 and aadA2), strA, and strB. All institutes were requested to follow the same published protocols2,8,17 when they examined their own isolates by PCR. Positive control strains (Salmonella Rissen 0112F31302F and Salmonella Typhimurium P502212 DT104) were provided by the EURL-AR to all participating laboratories. Obtained results were forwarded to the National Food Institute in Denmark for further analysis.
Results
The strA, strB, and/or aadA genes were detected in 32 (13.5%) Salmonella strains out of the 236 strains investigated. Some of the Salmonella strains harbored more than one resistance gene, exhibiting different combinations of the resistance genes investigated (Table 1). None of the 60 Salmonella strains exhibiting MIC of 4 mg/L contained any of the resistance genes tested. Out of 60 Salmonella strains exhibiting MIC values of 8 and 16 mg/L, one (1.6%) and nine (15%), respectively, yielded amplicons for any of the three genes analyzed. In total, 5.5% of these isolates that harbored the resistance genes with MIC 4, 8, and 16 mg/L would be classified as WT population if the ECOFF value is set at WT ≤16 mg/L. In addition, 22 (39%) out of 56 strains exhibiting MIC of 32 mg/L tested positive for one or more of the streptomycin resistance genes. This 39% of the strains would be classified as WT if a cut-off value of WT ≤32 mg/L is used. Of the 32 Salmonella strains positive by PCR, 23 carried aadA genes, 11 harbored strB, and 9 strA.
The gray color represents MIC values above the ECOFF value suggested by the authors.
ECOFF, epidemiological cut-off value; MIC, minimum inhibitory concentration.
For E. coli, the proportion of strains harboring resistance determinants was significantly higher (χ 2 , p < 0.001) than that for Salmonella. Three (3.6%) and nine (17.6%) of the E. coli strains with MIC values of 4 and 8 mg/L, respectively, harbored resistance genes (Table 2). A cut-off value of WT ≤8 mg/L would cause the classification of 11.3% of the strains harboring resistance genes as WT population. In addition, 27 (53%) and 43 (82.3%) of the strains with MIC values of 16 and 32 mg/L, respectively, tested positive for the presence of one or more of the genes. Setting a cut-off value of WT ≤16 mg/L would classified 53% of the strains with MIC 16 mg/L containing resistance genes as WT population. In total, the strA, strB, and aadA genes were detected in 80 (38.5%) of the 208 E. coli strains investigated. The number of strains harboring the aadA, strB, and strA resistance genes was 69, 31, and 18, respectively. Further, some E. coli strains presented different combinations of the resistance genes (Table 2).
The gray color represents MIC values above the ECOFF value suggested by the authors.
ECOFF, epidemiological cut-off value; MIC, minimum inhibitory concentration.
Figure 1 shows the streptomycin MIC distribution for Salmonella and E. coli collected from 11 and 10 different countries, respectively. The Salmonella distribution was based on a total of 9,191 observations and the E. coli was based on 5,171.
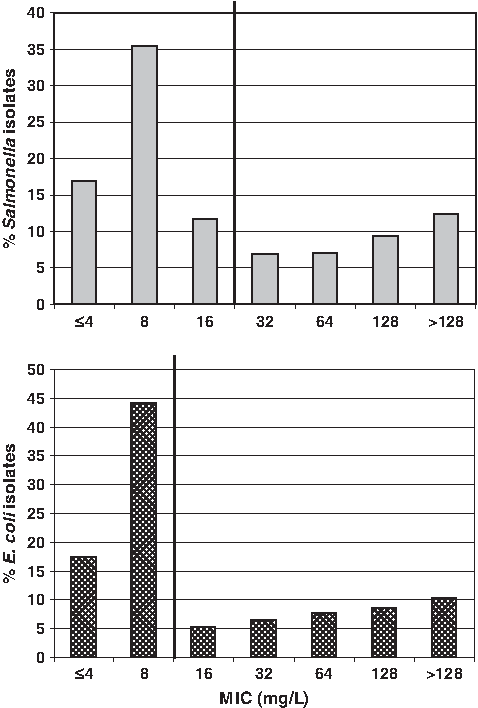
Distribution of the streptomycin MIC for Salmonella and Escherichia coli from the different countries. The Salmonella distribution was based on a total of 9,191 observations from 11 different data sources, whereas the E. coli is based on 5,171 from 10 different data sources. MIC, minimum inhibitory concentration.
Discussion
For most monitoring programs (www.eurl-ar.eu/206-monitoring_reports.htm#can), the streptomycin ECOFF value for both S. enterica and E. coli is WT ≤16 mg/L or WT ≤32 mg/L. Results from this investigation showed that a low proportion of the Salmonella strains presenting MIC values ≤16 mg/L tested positive for one or more of the three resistance genes. A cut-off value of WT ≤32 mg/L would have resulted in misclassification of 39% of the strains with MIC 32 mg/L, as these strains contained streptomycin resistance genes but would have been categorized as belonging to the WT population. In addition and based on the guidelines recommended by EUCAST, 53% of the E. coli strains with an MIC of 16 mg/L would have been classified as belonging to the WT population, even though they harbored streptomycin resistance genes.
According to results obtained in this study, the aadA gene appeared to be the most common streptomycin resistance gene for both Salmonella and E. coli exhibiting MICs between 4 and 32 mg/L. This is perhaps not surprising as previous studies have suggested that the aadA genes can be involved in conferring low-level resistance to streptomycin.20,21 It has been shown that E. coli strains with an aadA cassette as the second cassette within the variable region of integrons had MICs of 4 and 8 mg/L. 20 Studies from the United States have also described aadA cassettes within integrons in streptomycin-susceptible Salmonella and E. coli.25,26 In addition, if the aadA gene cassette is positioned in a class 1 integron, the expression level may be influenced by the proximity of the promoter. The MIC can also be influenced by copy number of the gene cassette and also the potency of the promoter and the presence or absence of a second promoter.4,11 In addition, the serovar distribution in the Salmonella sample may drastically influence the relative frequencies of the genes under investigation.
The presence of both strA and strB was observed in a number of strains, especially in E. coli. However, in this study no apparent correlation was observed between the MIC value and presence of a specific gene or gene combination. Still, a high proportion of the strains did not test positive for any of the three genes. However, other mechanisms of resistance, such as mutations in the rpsL gene encoding the ribosomal protein, S12 are also known to confer resistance to streptomycin.7,22,24 Studies in our laboratories (National Food Institute, Denmark) performed in a selection of E. coli and Salmonella strains have not detected any mutations in the isolates (data not shown). It is possible that other yet unknown mechanisms mediating increased tolerance to streptomycin are present in the strains without any known streptomycin resistance genes, especially the strains with MICs between 16 and 32 mg/L. Hence, there are some limitations with the methods since resistance genes can be present but may not be expressed, and expression of the genes may also be driven by promoter strength and copy number. 23 Further, the primers used in this study only amplified an internal part of the resistance genes. There is a general assumption that the presence of amplicons implies the presence of a functional gene, but this might not always be the case.
This study and previous investigations have now shown that resistance genes can be present in strains with low streptomycin MICs such 4, 8, and 16 mg/L.5,20,21 For some antimicrobial agents there is a clear separation between the WT and non-WT population; this is probably not the case for streptomycin. Based on these observations, it is possible that the MIC distribution of the streptomycin WT population overlaps with the distribution of the non-WT population. If this is the case, setting an ECOFF will be challenging and will result in misclassification in either way. The fact that different streptomycin resistance genes appear to be disseminated and that various combinations of them can be present within the same strain may also contribute to a wide variation of MIC values, including those close to or within the predicted WT population. The MIC span of 4 to 32 mg/L may represent an interface area between the WT and non-WT population for both E. coli and Salmonella.
To summarize, based on the streptomycin MIC distribution for Salmonella and E. coli collected from 12 different countries and comparison of them with the presence or absence of the described genes, the authors of this study have agreed to recommend an ECOFF value of WT ≤16 mg/L for Salmonella and WT ≤8 mg/L for E. coli. In this study the definition of these two ECOFF values resulted in the misclassification of 11.3% of the E. coli strains harboring resistance genes and exhibiting MICs 4 and 8 mg/L and 5.5% of the Salmonella strains exhibiting MICs 4, 8, and 16 mg/L. Taking into account that the reproducibility of antimicrobial susceptibility methods performed in the same strain could affect the MIC value obtained one fold dilution either way, this percentage of misclassified organisms could slightly vary. In addition, differences in the methods used for antimicrobial susceptibility testing may also cause differences in the results. In this study two of the laboratories performed agar dilution methods and the rest used commercially available plates with double dilutions of the antimicrobials on them. However, in each laboratory, the same MIC method was used for analyzing both Salmonella and E. coli strains, indicating that there are differences in the presence of streptomycin resistance genes between the two genera.
The results from this survey emphasize the complexity of establishing a clear ECOFF value for streptomycin due to a large proportion of strains exhibiting high MIC values despite the lack of a known mechanism of resistance, and the fact that strains with low MICs can contain resistance genes. Further work should be undertaken to reveal novel mechanisms conferring resistance to aminoglycosides.
The establishment of a common ECOFF based on the evaluation of both MIC distribution of the population and characterization of resistance genes is vital to facilitate a global harmonization of surveillance programs. For monitoring programs the defined ECOFF should minimize the misclassification of organisms harboring resistance genes into the WT population and vice verse.
Footnotes
Acknowledgments
The authors would like to thank Gunnar Kahlmeter for his advice. European Commission to the EURL-AR; European Union Reference Laboratory on Antimicrobial Resistance (Agreement No SANCO/2006/FOOD SAFETY/029).
Disclosure Statement
None to declare.