
Abstract
Introduction
Recently, different molecular techniques such as random amplified polymorphic DNA, enterobacterial repetitive intergenic consensus (ERIC), BOX element (BOX), repetitive extragenic palindrome (REP), pulsed-field gel electrophoresis (PFGE), and multilocus sequence typing (MLST) have been utilized for subtyping Salmonella Typhi strains.3,7,18,35 Among these methods, random whole-genome analyses, especially by ERIC–polymerase chain reaction (PCR) techniques, have been shown to provide good discrimination and good reproducibility in the serotype Enteritidis. 22 There are several reports8,28 on serotyping, phage typing, and antibiogram analysis from Northern India, but the strains have not been typed at the molecular level, yet. The present study was therefore planned to deduce the antimicrobial susceptibility and the precise genetic relatedness among the isolates of typhoidal Salmonella using ERIC and REP-PCR, recovered from Chandigarh and Delhi (northern part of India).
Materials and Methods
Bacterial strains and growth conditions
The study was carried out with 102 Salmonella isolates, including Salmonella Typhi (97) and Salmonella Paratyphi A (5) isolates. All isolates included in this study were recovered from random, sporadic and unrelated cases of typhoid fever. With the help of a biostatistician, using EPI-INFO software and taking population size into consideration, the sample size for Salmonella Typhi was calculated (80% power). Of these 102 isolates, 49 isolates were procured from the Government Medical College and Hospital (GMCH), Chandigarh; 5 isolates from the Maulana Azad Medical College (MAMC), New Delhi; and 48 isolates from the All India Institute of Medical Sciences (AIIMS), New Delhi, India. The isolates were revived on nutrient agar plates and were grown overnight with aeration for 18 hr at 37°C in a nutrient broth (Hi Media, Mumbai, India) and identified as Salmonella Typhi or Salmonella Paratyphi A by biochemical tests. All the cultures were maintained on nutrient agar slants and preserved at −20°C by making 20% glycerol stocks.
Antimicrobial sensitivity testing
Antibiotic sensitivity profile of all the strains was checked using HiMedia (Mumbai, India) Octodisc-GII Minus, Combi 508, and Combi 513 by the method of Bauer et al. 4 The average inhibitory zone diameter was compared with the standards provided by the CLSI guidelines. 9 Minimum inhibitory concentrations for ciprofloxacin and nalidixic acid were determined using E-strips (AB Biodisk, Solna, Sweden). The percentage of antimicrobial resistance among CHD and DLH isolates was compared by Chi-square or Fisher's exact test, whichever was applicable. A difference was considered significant with a p value<0.05.
Multiple antimicrobial resistance index
Multiple antimicrobial resistance (MAR) index was calculated and was defined as a/b, where a represents the number of antibiotics to which isolate is resistant, and b represents the total number of antibiotics tested. 16
Genomic DNA isolation
For molecular characterization, the genomic DNA of all the isolates was extracted using the Bacteria Genomic Prep Mini Spin Kit (GE Healthcare, Buckinghamshire, United Kingdom) according to the manufacturer's instructions. All the genomic DNA samples were electrophoresed at 70–80 V for 45 min. in 1X TAE buffer, using 1% agarose gel containing ethidium bromide. Samples were loaded using a 6X loading dye. DNA bands were qualitatively analyzed using Gel vision DC (Biotron Healthcare, Mumbai, India), and purified DNA was stored at 4°C. DNA was quantified by using Nanodrop 1000 (Thermo Scientific, Mumbai, India).
rep-PCR analysis
The isolates were analyzed by rep-PCR using two methods, that is, ERIC and REP-PCR.
Enterobacterial repetitive intergenic consensus polymerase chain reaction
For ERIC-PCR, the pair of 22-mer primers, ERIC1R (5′-ATGTAAGCTCCTGGGGATTCAC-3′) and ERIC 2 (5′-AAGTAAGTGACTGGGGTGAGCG-3′), was used, and amplified by PCR. 34
REP–polymerase chain reaction
For REP-PCR, primers used for amplification were F-REP-1 (5′-IIIICGICGICATCIGGC-3′) and R-REP-2 (5′-ICGICTTATCIGGCCTAC-3′).
PCR amplification
Standard protocols using above primers for ERIC-PCR and REP-PCR were developed after a number of standardization experiments. Amplification was carried out in a reaction mixture of 25 μl containing 100 ng of template DNA, 1× buffer, 3 mM MgCl2, 750 μM dNTPs, 2 μM of each primer, 2 U of Taq polymerase (Hi-fidelity™, Fermentas, Mumbai, India), and 10% dimethyl sulfoxide using an automated thermal cycler (Quanta Biotech, Biotron Healthcare) with initial denaturation at 94°C (8 min), followed by 35 cycles of denaturation at 94°C (1 min), annealing at 49°C (1 min, for REP-PCR-40°C), and extension at 65°C (8 min), and a final extension was done at 65°C (16 min).
Gel analysis
Ten microliters of each PCR product was analyzed electrophoretically using a 1% agarose gel containing ethidium bromide, in 1× TAE buffer at 70–80 V for 1–2 hr. All the gel images were analyzed under UV light in a gel documentation system (Gel vision DC; Biotron Healthcare). Band sizes, band attributes, and standard molecular weights were assigned according to the 100-bp and 1-Kb molecular weight markers (Fermentas).
Dendrogram construction
For cluster analysis of all the isolates, a dendrogram was constructed by using NTSYS pc2.0 (Exeter software, New York, NY) software by unweighed pair-group method arithmetic mean (UPGMA).
Calculation of Simpson's diversity index
Numerical index of the discriminatory ability was calculated by applying the Simpson's Index of Diversity equation.
14
The D value (discriminatory index) given by the Simpson's Index of Diversity equation is as follows:
D=numerical index of discrimination
N=total number of strains in the sample population
S=total number of types described
nj=number of strains belonging to the jth type.
Results
Antibiotic sensitivity
Analysis of antibiogram data revealed that all the CHD isolates were found to be sensitive to chloramphenicol and cotrimoxazole, as well as to ceftriaxone, ceftazidime, cephalexin, cephalothin, gentamicin, amikacin, oxytetracycline, and furazolidone (Table 1). On the other hand, resistance to ampicillin, norfloxacin, ciprofloxacin, gatifloxacin, cephotaxime, cefuroxime, and netilin was found to be more prevalent in CHD isolates as compared to DLH isolates. However, a similar pattern of resistance to nalidixic acid was observed in the isolates from both CHD (49.0%) and DLH (38.2%). Collectively, from both the areas, 86.27%, 40.1%, and 38.2% resistance was observed for nalidixic acid, norfloxacin, and ciprofloxacin, whereas 1.96%, 15.6%, and 6.8% resistance was observed for traditional first-line antibiotics, that is, chloramphenicol, ampicillin, and cotrimoxazole, respectively. These isolates were found to constitute 35 profiles (Table 2). However, when these were analyzed according to the antibiotic classes, the number of profiles was reduced to 27 (Table 3). The majority (n=84) of isolates had an MIC to nalidixic acid of 32 μg; five additional isolates had MIC values >32 μg. For ciprofloxacin, 35 isolates were found to have MIC of 4 μg. Most of the isolates (n=61) had an MIC <4 μg, and very few isolates (n=6) were found to have an MIC of 16 μg.
CHD, Chandigarh; DLH, Delhi; MAR, multiple antimicrobial resistance.
Multiple antimicrobial resistance index
Multiple antimicrobial resistance (MAR) indices obtained were in the range of 0.05–0.44. A maximum index of 0.44 was found with an isolate of S. enterica serovar Typhi that was obtained from AIIMS, New Delhi. An MAR index of 0.05, 0.16, and 0.22 was obtained for the Paratyphi isolates (Table 2). However, MAR indices of all the isolates obtained on the basis of classes were 0.09, 0.18, 0.27, 0.36, 0.45, 0.54, and 0.72 (Table 3), and only one isolate with 0.72 as MAR index, which denotes resistance to almost all the antibiotic classes. Thirteen isolates showing an MAR index of 0.18 revealed a resistance to two groups of antibiotics. Most of the isolates showed an MAR of 0.09, thereby revealing resistance to one class of antibiotic that was quinolone.
Enterobacterial repetitive intergenic consensus polymerase chain reaction
Amplicons obtained by ERIC-PCR were in the range of 250–3000 bp. Two major clusters A and B were obtained at a 64.5% similarity level (Fig. 1). Clusters A and B could be subdivided into A1, A2 and B1, B2. The major cluster B, including B1 and B2, consisted of all the isolates from the Delhi region, whereas clusters A1 and A2 consisted of 57 isolates, a major fraction (49) of which was from the Chandigarh region. Further, it can be clearly seen from the dendrogram that all the isolates taken from the MAMC hospital, Delhi, were grouped together in a separate cluster within the major cluster B1. Notably, at >80% of similarity, four Paratyphi A isolates separated themselves from the Salmonella Typhi strains. Among the Paratyphi strains, two were in the same cluster and had the similar antibiogram. Interestingly, all the strains having a similar antibiotic profile did not cluster together in the dendrogram. However, some of the isolates with a similar antibiogram had fallen in the same cluster. Keeping all the conditions same, the results obtained were reproducible and were repeated twice for confirmation.
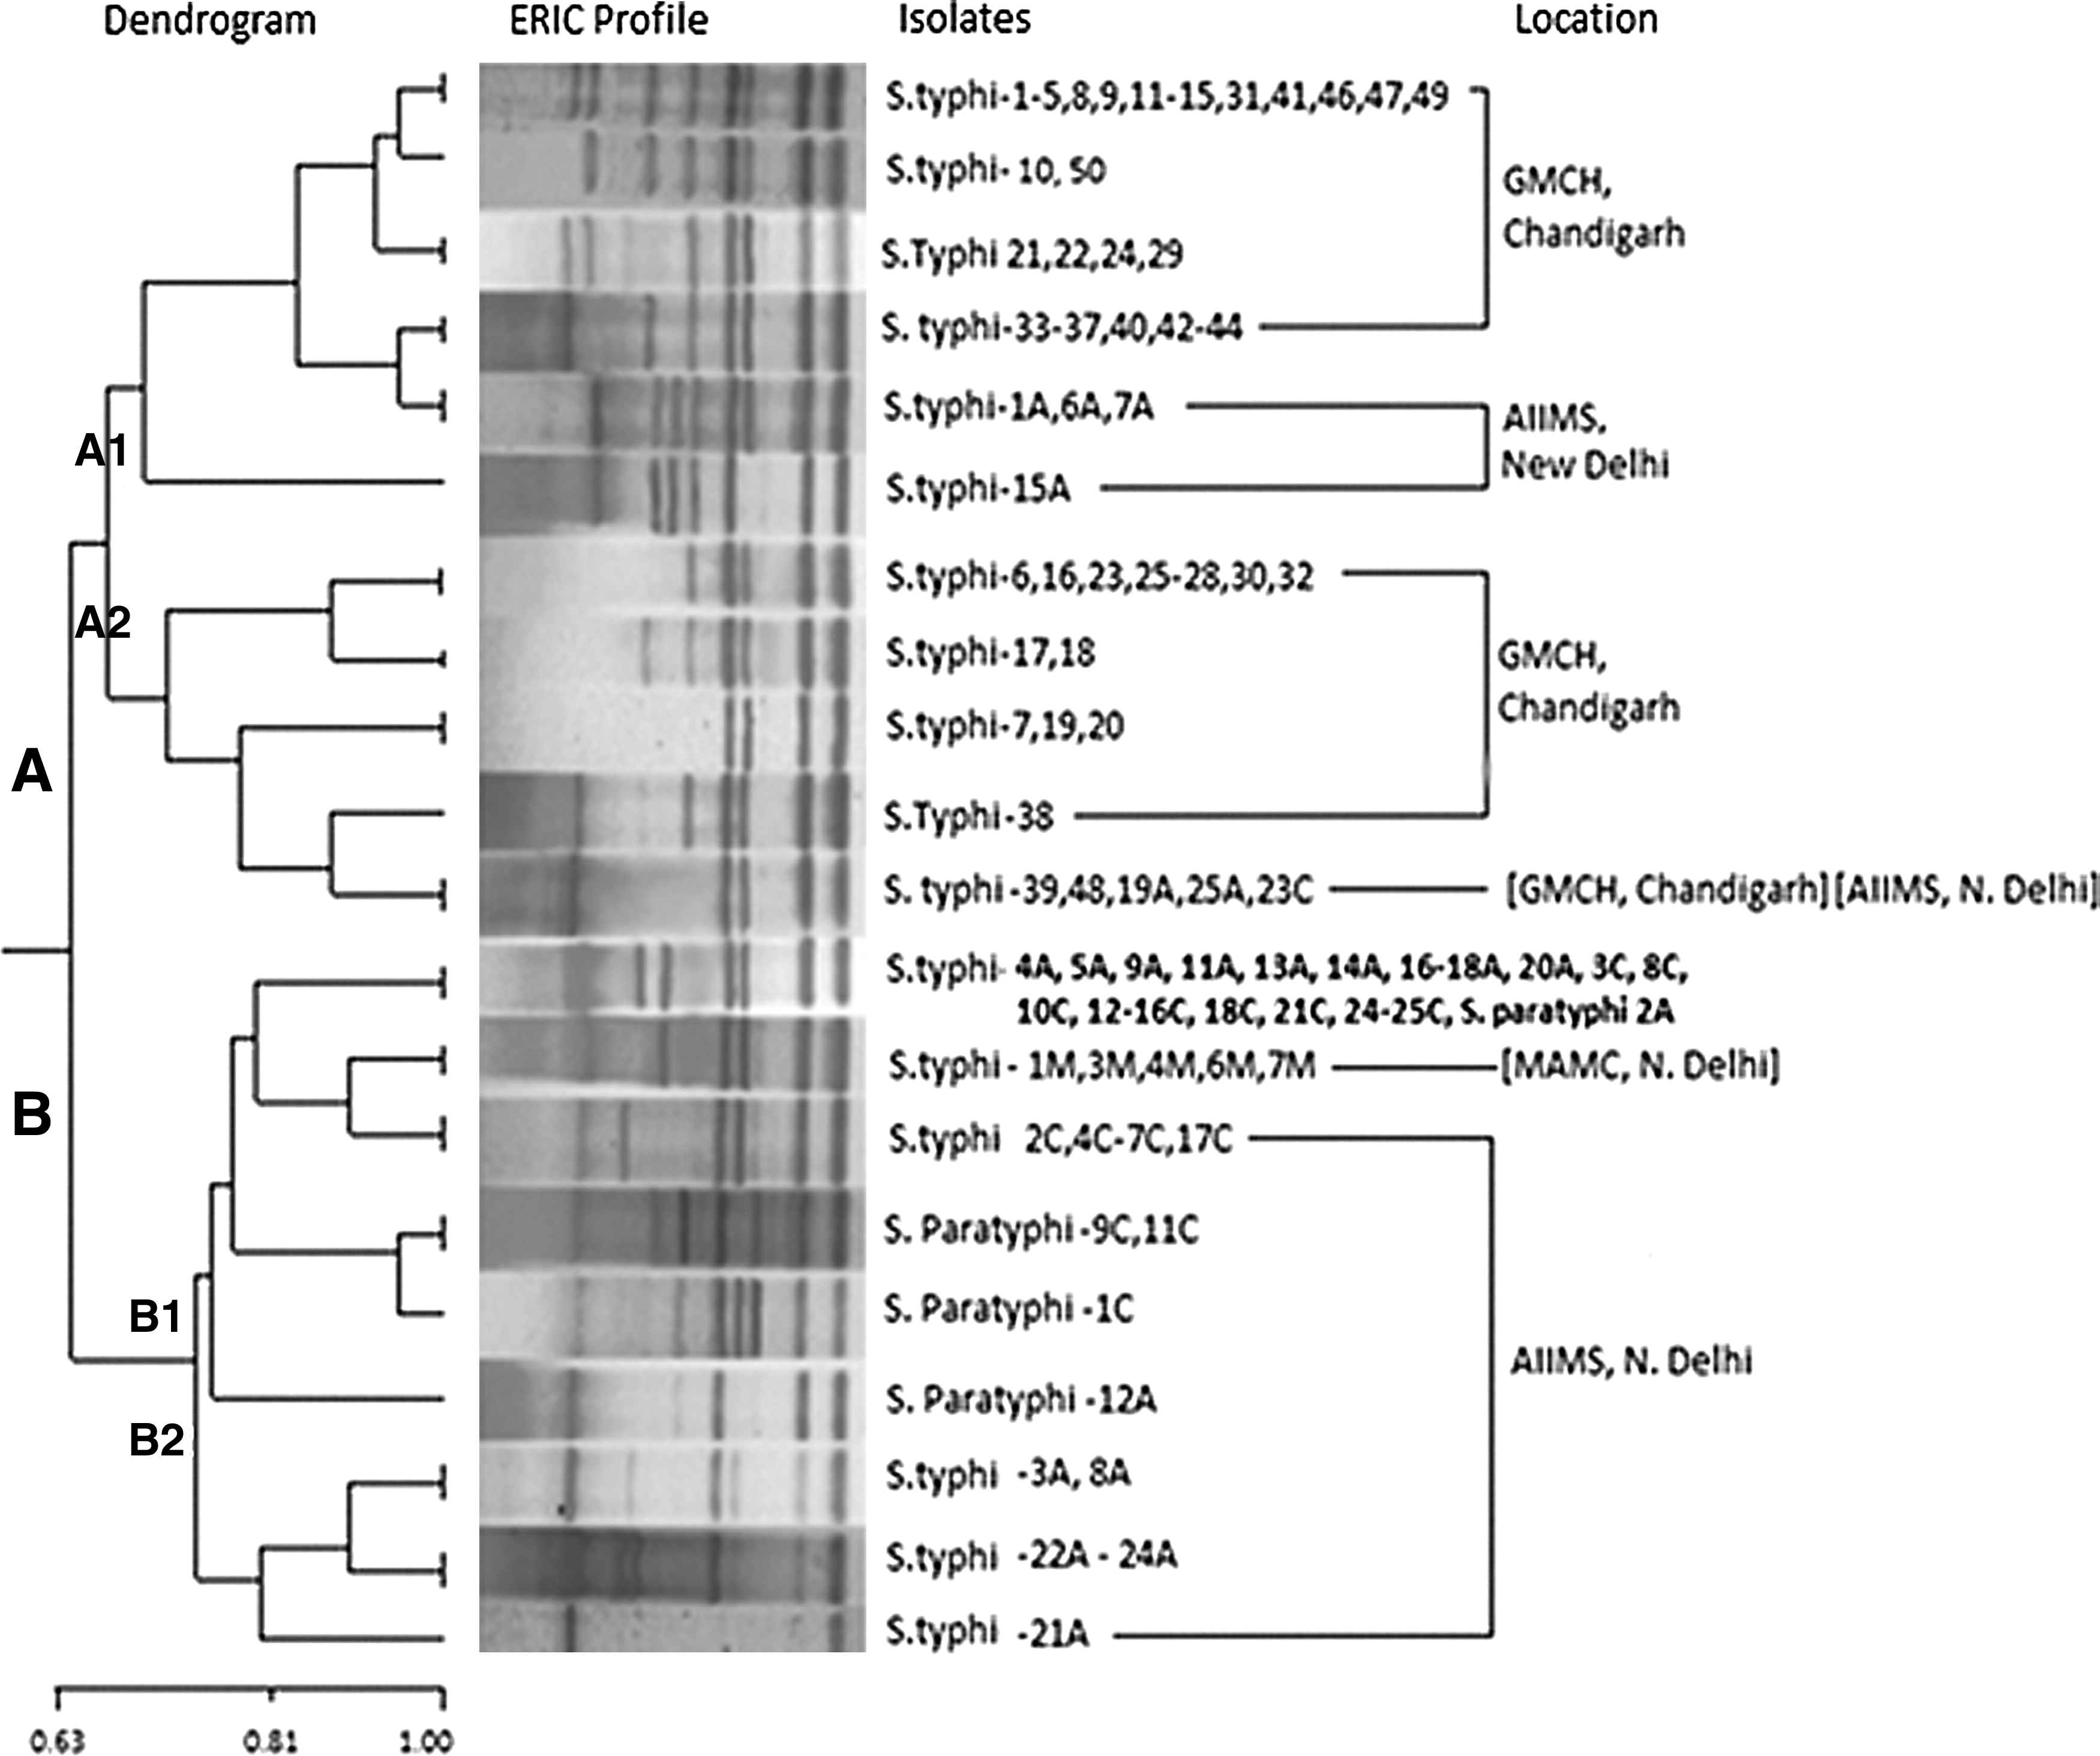
Enterobacterial repetitive intergenic consensus (ERIC)–polymerase chain reaction (PCR) dendrogram exhibiting the clonal relatedness among the Salmonella isolates (n=102). The percentage of similarities between the fingerprints was calculated using the Jaccard coefficient, and the clustering was done by UPGMA. Scale bar depicts the percentage of similarity.
REP–polymerase chain reaction
Using REP-PCR, at 0.39 percentage of similarity level, isolates grouped themselves in two major clusters A and B. Amplicons obtained were in the range of 250–5000 bp. Cluster A consisted of most of the isolates from the Delhi region, and cluster B consisted of majority of the isolates from the Chandigarh region. All the MAMC isolates were found to be clustered together (Fig. 2).
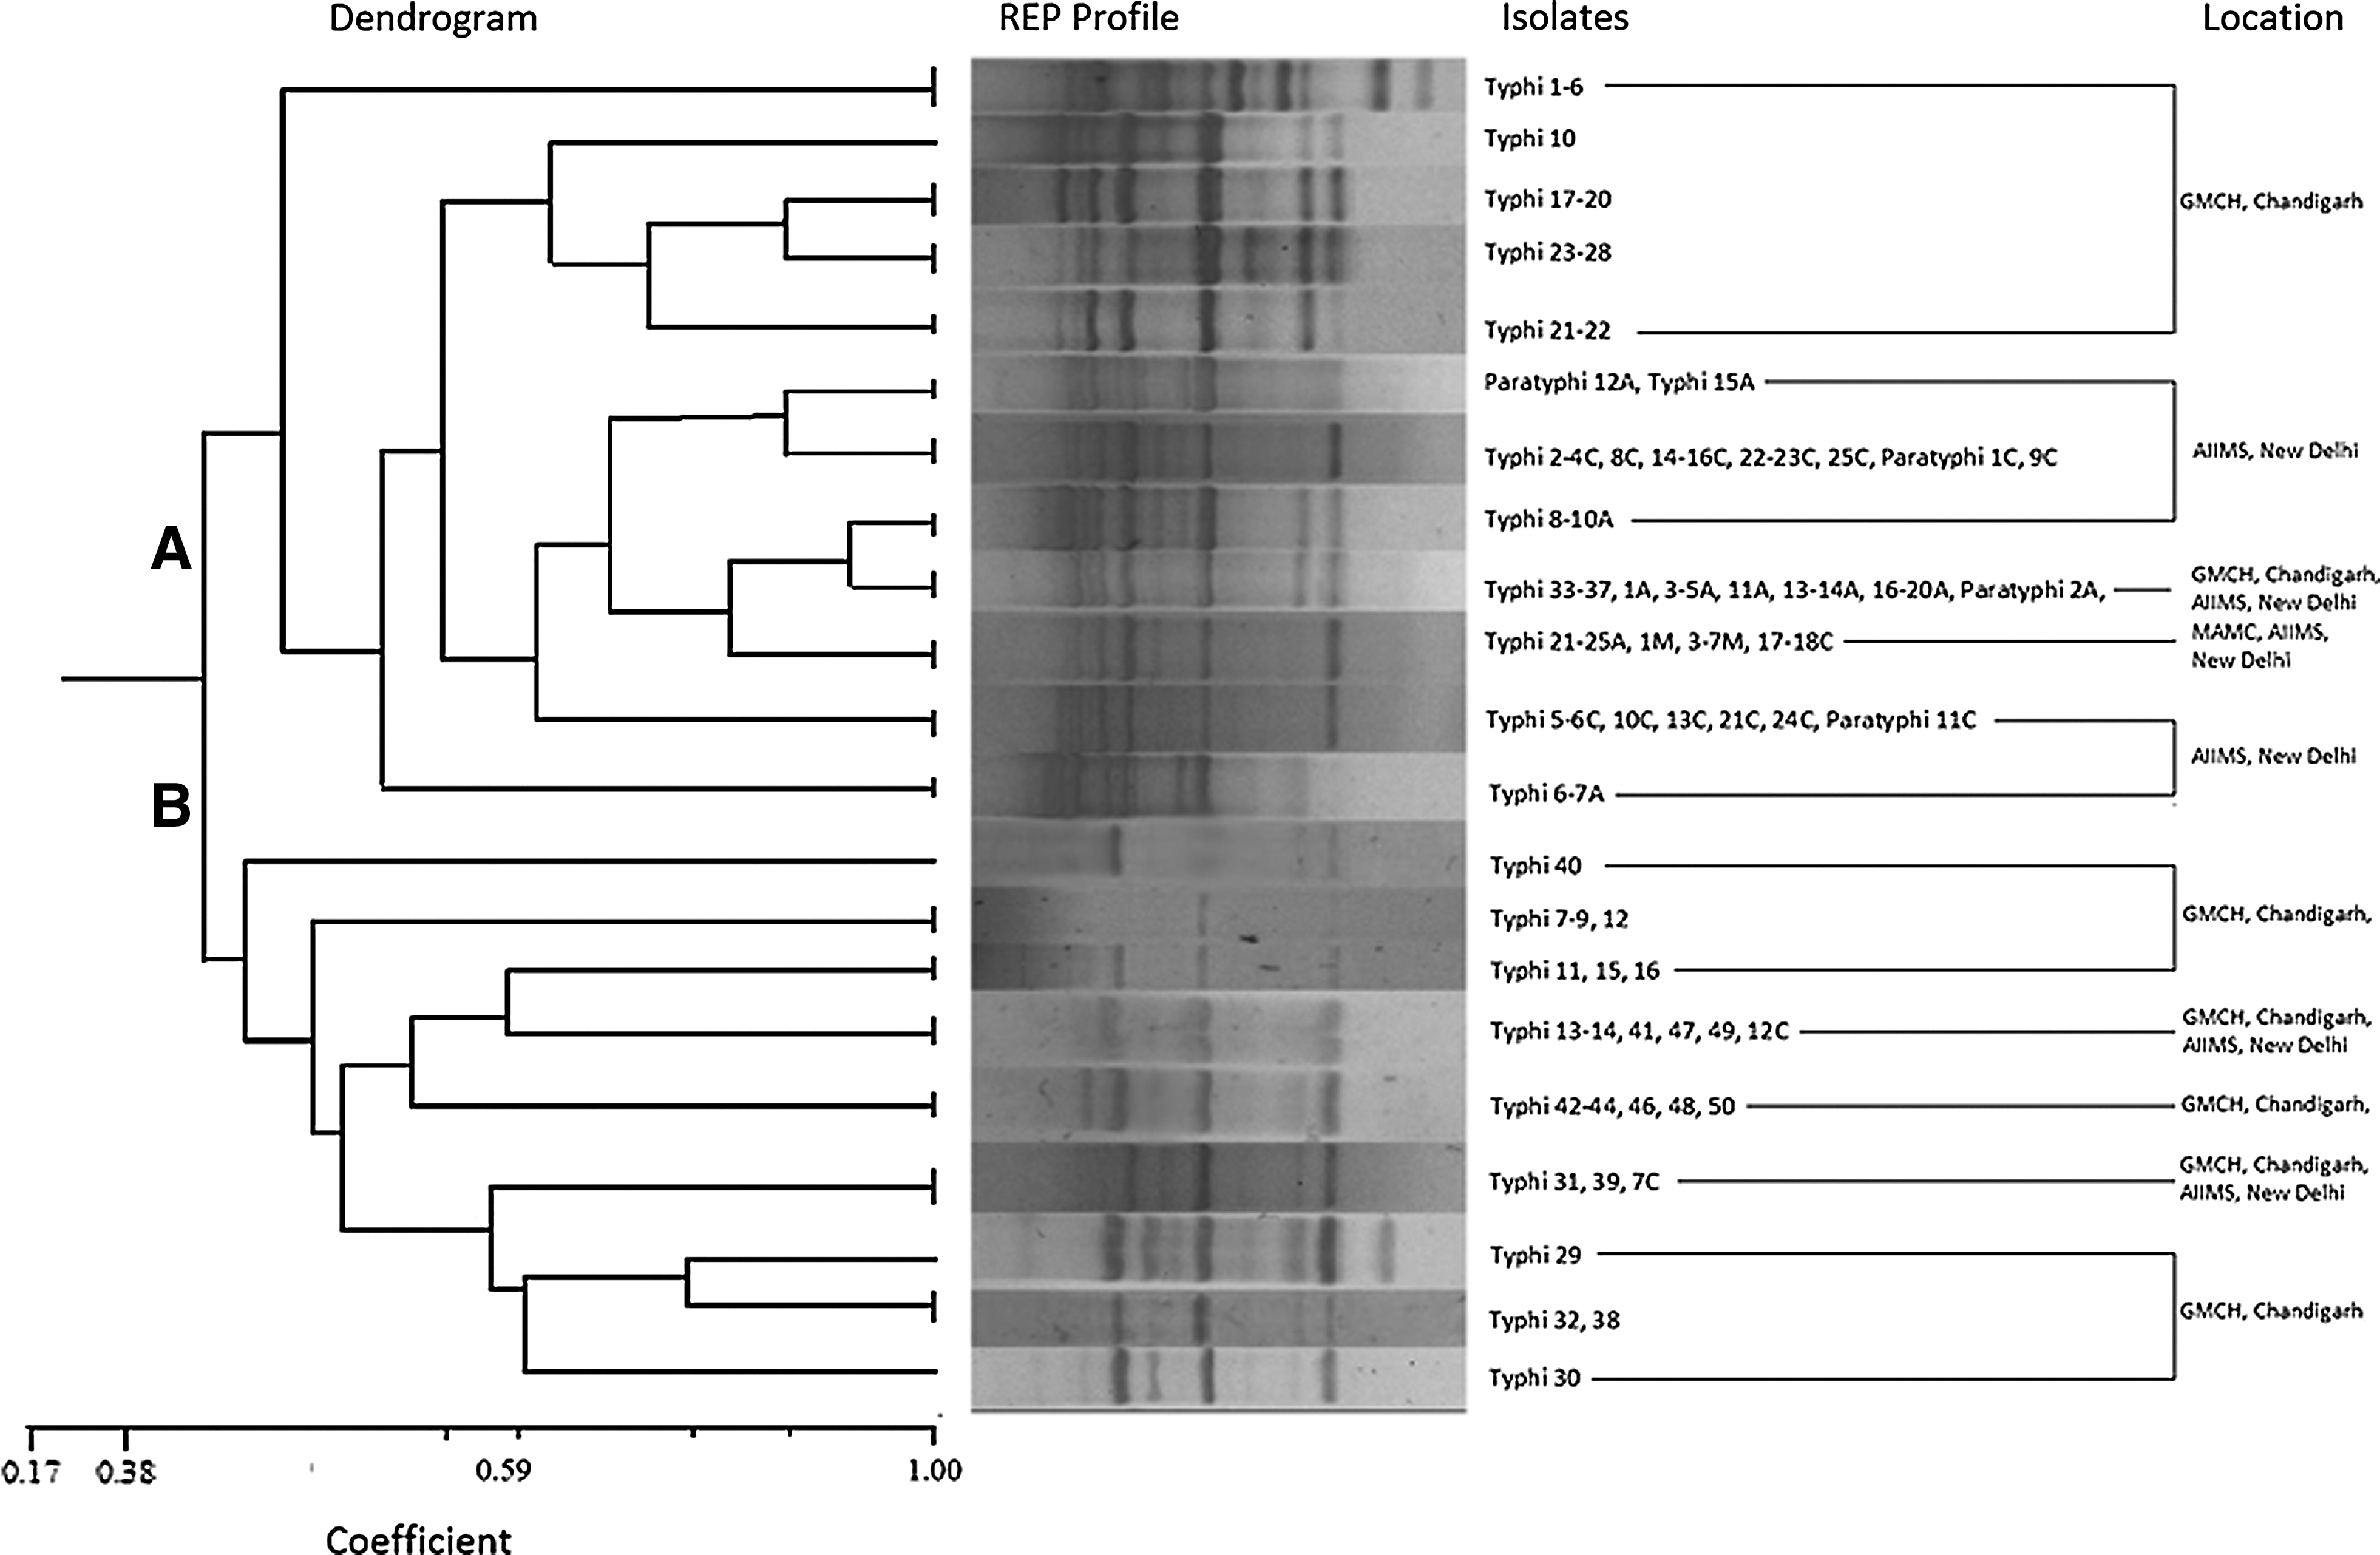
REP-PCR dendrogram exhibiting the clonal relatedness among the Salmonella isolates (n=102). The percentage of similarities between the fingerprints was calculated using the Jaccard coefficient, and the clustering was done by UPGMA. Scale bar depicts the percentage of similarity.
Calculation of Simpson's diversity index
Simpson's index of diversity is able to distinguish between isolates, and in the present study after analyzing the patterns, DI was calculated to be 0.890 and 0.92 using the ERIC PCR and REP-PCR techniques, respectively.
Discussion
Changing trends in the antimicrobial susceptibility pattern prompted us to characterize drug-resistant Salmonella Typhi and Paratyphi A isolates using ERIC and REP-PCR from Northern India. Re-emergence of sensitivity to traditional first-line antibiotics such as chloramphenicol and cotrimoxazole was observed in the current study, which is in concordance with other reports.1,12,25,32 A decrease in sensitivity to 3rd generation cephalosporin cephotaxime, along with quinolones such as nalidixic acid, ciprofloxacin, and norfloxacin, was observed, with decrease being more pronounced in CHD isolates for the latter. In the past, resistance used to be common to the ACCoT type; however, after calculation of MAR in the present study, most of the isolates have been observed to show quinolone resistance. Previously also, such a trend has been reported from various parts of the world.11,13,17,27,30,36 This may be attributed to increase in the selective pressure on the bacterial population resulting from uncontrolled usage of quinolones leading to the emerging resistance. It has also been suggested that nalidixic acid resistance may be considered as a marker for decreased sensitivity to ciprofloxacin.2,26 Interestingly, in the current study, this association appears to be applicable to CHD isolates only. Emerging resistance in the case of Paratyphi A isolates (though fewer in number) is also indicated. Therefore, in view of the changing sensitivity pattern and etiology of enteric fever in North India, continued surveillance and monitoring of antimicrobial sensitivity of Paratyphi A are needed. In light of the changing pattern to antibiotic sensitivity, it is also indicated that there is a need to revisit the therapeutic regimen before advocating the antibiotic therapy.
Further, molecular characterization of these isolates using ERIC and REP-PCR revealed the amplicons in the range of 250–3000 bp and 250–5000 bp with DI of 0.89 and 0.92, in contrast to the amplicons obtained in the range of 100–3500 bp using ERIC-PCR in an earlier study from the eastern part of Uttar Pradesh and western part of Bihar, India. 22 This reflects the variability within different parts of India. Isolates from the Chandigarh region have been found to be present in cluster A in contrast to Delhi isolates grouped in cluster B, which may be due to the differences in the genotypes of the isolates from the two places. It is reflected that these isolates are not clonal in nature, and during their emergence, they might have gained mutations or acquired plasmid due to which they have fallen in separate clusters. Within the cluster B, a similar band profile was obtained for all the isolates collected from MAMC, reflecting that these isolates are derived from same clone without any genetic deviations. With REP-PCR also, MAMC isolates were grouped together. Isolates that were grouped in the same cluster using ERIC could be distinguished by REP-PCR. The diversity observed in isolates from different parts may be attributed to the fact that they were isolated from random, sporadic, and unrelated cases of typhoid fever. This is in agreement with the suggestion that the Salmonella Typhi genome organization is highly plastic and undergoes extensive chromosomal rearrangements. 19 It has been proposed earlier that Salmonella mutants can transiently increase their mutation rate, which allows genetic variation to occur immediately after infection when a pathogen needs to survive, invade, and colonize the human host. 22 However, validation of effectiveness of these typing schemes through comparison to a gold standard scheme, that is, PFGE and analysis of isolates from a known outbreak, would provide an additional insight into the discriminatory power of these assays. A correlation of biological traits, genetic diversity, and antibiotic resistance will further help in understanding the evolution of the organism and for developing appropriate strategies to control Typhi-serotype infections.
Footnotes
Acknowledgement
Funding: This work was supported by a grant from the Indian Council of Medical Research (ICMR), New Delhi, India.
Author Disclosure Statement
All authors have none to declare. There is no conflict of interest in connection with the submitted manuscript.