
Abstract
Escherichia coli isolates (n=438) from six different broiler chicken flocks (all in, all out) with known consumption of antimicrobials were investigated for their antimicrobial resistance and the prevalence of extended-spectrum β-lactamase (ESBL) phenotypes. E. coli were isolated from chicken at the third and fifth week of age and tested for antimicrobial resistance during the course of fattening. Resistance to sulfamethoxazole+trimethoprim, which was used in four flocks within the first days of life, decreased significantly in all six flocks between the third and fifth week of broiler chicken's life (mean 65.9% vs. 54.3%). By contrast, resistance to spectinomycin increased significantly in all six flocks within the same period (mean 36.1% vs. 57.0%); doxycycline resistance increased significantly in five of six flocks (mean 19.2% vs. 41.7%), although both substances were not used for treatment. Of the sulfonamide resistance genes sul1, sul2, and sul3, sul2 was most frequently found (up to 60%). The prevalence of sul2 increased significantly between weeks 3 and 5, if the chicken were treated with sulfamethoxazole + trimethoprim in the first days of life. If sulfamethoxazole + trimethoprim was not used, then the prevalence of sul2 decreased significantly in the same period. The prevalence of sul1+qacEΔ1 (classical class 1 integrons) was significantly higher in E. coli from sulfamethoxazole + trimethoprim–treated flocks (9.63%), compared to untreated flocks (2.92%). The detection of phenotypes that potentially indicate plasmid-borne AmpC-β-lactamases was inversely associated with sulfamethoxazole + trimethoprim treatment. ESBL phenotypes were found without selective enrichment in four of six flocks. Of all isolated E. coli, 1.8% (n=8) had an ESBL phenotype. ESBL strains differed in their accompanying resistances and/or enterobacterial repetitive intergenic consensus sequences. In conclusion, clonal dissemination seems not to be a major cause of ESBL detection on a chicken farm with all-in all-out production mode.
Introduction
In addition to the prevalence of ESBL-producing strains, also the amount and frequency of antibiotic use in poultry is lively discussed. 1 Since the selective power of antimicrobials differs by agent, 31 it would be interesting to follow the development of resistance in different antibiotic regimes. Therefore, we investigated the antimicrobial resistance and the ESBL phenotype of E. coli isolated unselectively from six flocks of fattening chicken at two stages of life. Resistance data were connected to data on antimicrobial consumption at the chicken houses as provided by official recordings of drug dispense. With regard to the ongoing discussion on antibiotic treatment of poultry, this should clarify whether and which antimicrobial resistance rates increase during fattening. ESBL isolates were investigated for phylogenetic relatedness, in order to throw light on whether ESBL strains spread clonally between different chicken houses on the same farm, and whether they are reduced or eradicated by disinfection measures between different production turns.
Materials and Methods
Chicken (breed: Ross) were purchased on day one of life from one hatchery and fed for 33 (turn 1), 37 (turn 2), or 31 days (turn 3) on a conventional chicken farm in a non-experimental setting (field study). Chicken were kept in two different houses (A and B) on the same farm in three different turns (resulting in six different flocks, two flocks in each time period). The number of day-old-chicken was 2×20,000 in turn 1, 2×16,500 in turn 2, and 2×19,750 in turn 3, due to a maximum stocking rate of 23 chicken per m2 in short-term fattening (turn 1 and turn 3), and of 16–18 chicken per m2 in long-term fattening (turn 2). Chicken houses were nearly identically built and equipped, apart from the point that house A was equipped with a redox-based water conservation system. Both houses were housed by chicken prior to the investigation and were cleaned and disinfected and left empty for 14–21 days prior to the investigation and between turns. The same staff was working in houses A and B.
E. coli (n=438) were isolated from feces taken from the floor when the chicken were in their third and fifth week of life. At each sampling time, 10 collective samples of 5 g each were taken per chicken house by one person using sterile gloves and one-time equipment. In each chicken house, these samples were taken at 10 different places along the two water lines (distance about 24 m). Of each collective sample, a subsample of 1 g was suspended in physiologic salt solution (salinity 0.9%), followed by serial dilution (1:10), and finally cultured on Gassner-agar; up to four morphologically different isolates per agar plate (and thus per collective sample) were identified by biochemical tests as previously described. 19 The mean number of isolates from one flock at one sampling time was 37 (range 28–40). The antimicrobial susceptibility of the isolates was assessed by microdilution in cation adjusted Mueller–Hinton broth (CAMHB) according to DIN 58940-81. Overnight cultures of E. coli were suspended in 5 ml of sodium chloride until reaching a concentration of McFarland 0.5. Of the suspension, 100 μl was transferred in 13 ml of CAMHB. Antibiotic-coated microtiter plates—purchased from Sekisui-Virotech (Rüsselsheim, Germany)—were inoculated with 100 μl of CAMHB suspension using the Micronaut Sprint® dispenser. After inoculation, microtiter plates were covered with transparent plastic film, shaken for 5 min on a plate shaker and incubated at 37°C for 20±2 hr. Purity was confirmed by streaking an aliquot of the CAMHB suspension on standard nutrient agar containing defibrinated sheep blood. The conformance with the DIN-defined inoculum range (1–5×10⁵ cfu/ml) was initially confirmed by colony forming units (cfu)-counting using the plate count method according to Gedek. 16 Quality was assured by daily tests of E. coli DSM 1103. Unusual resistances were confirmed in a second microdilution test. For antimicrobial agents, breakpoints, and epidemiologic cut-off values see Table 1.
Reference: http://mic.eucast.org, last accessed February 19, 2013.
EUCAST breakpoints not applied, since these breakpoints would have included the wild type population.
Only tested in eight putative extended-spectrum β-lactamase strains (Fig. 3).
Trimethoprim: sulfamethoxazole ratio=5:1.
Referring to sulfamethoxazole.
EUCAST breakpoint not applied, since this refers to a sulfamethoxazole/trimethoprim ratio of 19:1.
For trimethoprim: sulfamethoxazole=1:19.
n.d., not determined.
Isolates were diagnosed with an ESBL phenotype if they had a minimum inhibitory concentration (MIC) value of one of the indicator substances (ceftazidim or cefotaxim) of >1 mg/L and an indicator: indicator+inhibitor MIC ratio of ≥8. Clavulanate (4 mg/L) was used as inhibitor. Isolates were diagnosed with an inhibitor resistant phenotype, if indicator MIC values were >1 mg/L, but the indicator:indicator+inhibitor MIC ratio was below 8.
During the investigation period, two antibiotics that are effective against E. coli were used; one of them was a sulfonamide. Thus, in order to further investigate sulfonamide resistance, we searched the same isolates for sulfonamide resistance genes and class 1 integrons by polymerase chain reaction (PCR), using primer sequences (fw/rv; annealing temperature) TTCGGCATTCTGAATCTCAC/ATGATCTAACCCTCGGTCTC 25 ; 55°C, for sul1, CGGCATCGTCAACATAACC/GTGTGCGGATGAAGTCAG 25 ; 56°C, for sul2, GAGCAAGATTTTTGGAATCG/CATCTGCAGCTAACCTAGGGCTTTGGA 29 ; 55°C, for sul3, GGCTTTACTAAGCTTGCCCC/AGCCCCATACCTACAAAGCC; 57°C for qacEΔ1. 4 PCR products were visualized by agarose gel electrophoresis using positive controls as previously described22,33 and template-free PCR ingredients as a negative control.
To assess the epidemiology of ESBL strains, these strains were further characterized by enterobacterial repetitive intergenic consensus (ERIC)-PCR as previously described, 22 using primer-pair ERICR1: 5′ATGTAAGCTCCTGGGGATTCAC3′ and ERIC2: 5′AAGTAAGTGACTGGGGTGAGCG3′. 39
Data on antimicrobial use were provided from the official recordings of drug dispense (§4 AATV; §13 TÄHAV). In case of antibiotic treatment, all antibiotics were contemporarily applied with the drinking water in both chicken houses. Medication with antimicrobials is described in Table 2.
IU, international units.
Statistical significance was calculated using chi-squared test; Fisher's exact test was used instead of chi-squared test for expected numbers below 5 per cell.
Results
Significantly more antibiotic resistant E. coli were isolated from feces of chicken at the age of 5 weeks, compared to the age of 3 weeks (Table 3). This was significant in eight cases, and was seen by tendency in another eight cases, while resistance decreased from week 3 to 5 in only five cases (significant for sulfamethoxazole + trimethoprim and colistin). Resistance increased most clearly for cephalosporines, doxycycline, and spectinomycin. Whenever a significant increase from week 3 to 5 was seen, this increase was consistent in a mean of 5 flocks (range 4–6); resistance to spectinomyin increased consistently in all three turns of both chicken houses (Fig. 1). No direct link was seen between antimicrobial resistance and antimicrobial consumption, since neither doxycycline nor cephalosporines nor spectinomycin was used in any of the production turns. By contrast, colistin resistance was moderate (0–10.5%), although colistin was used in all three production turns.
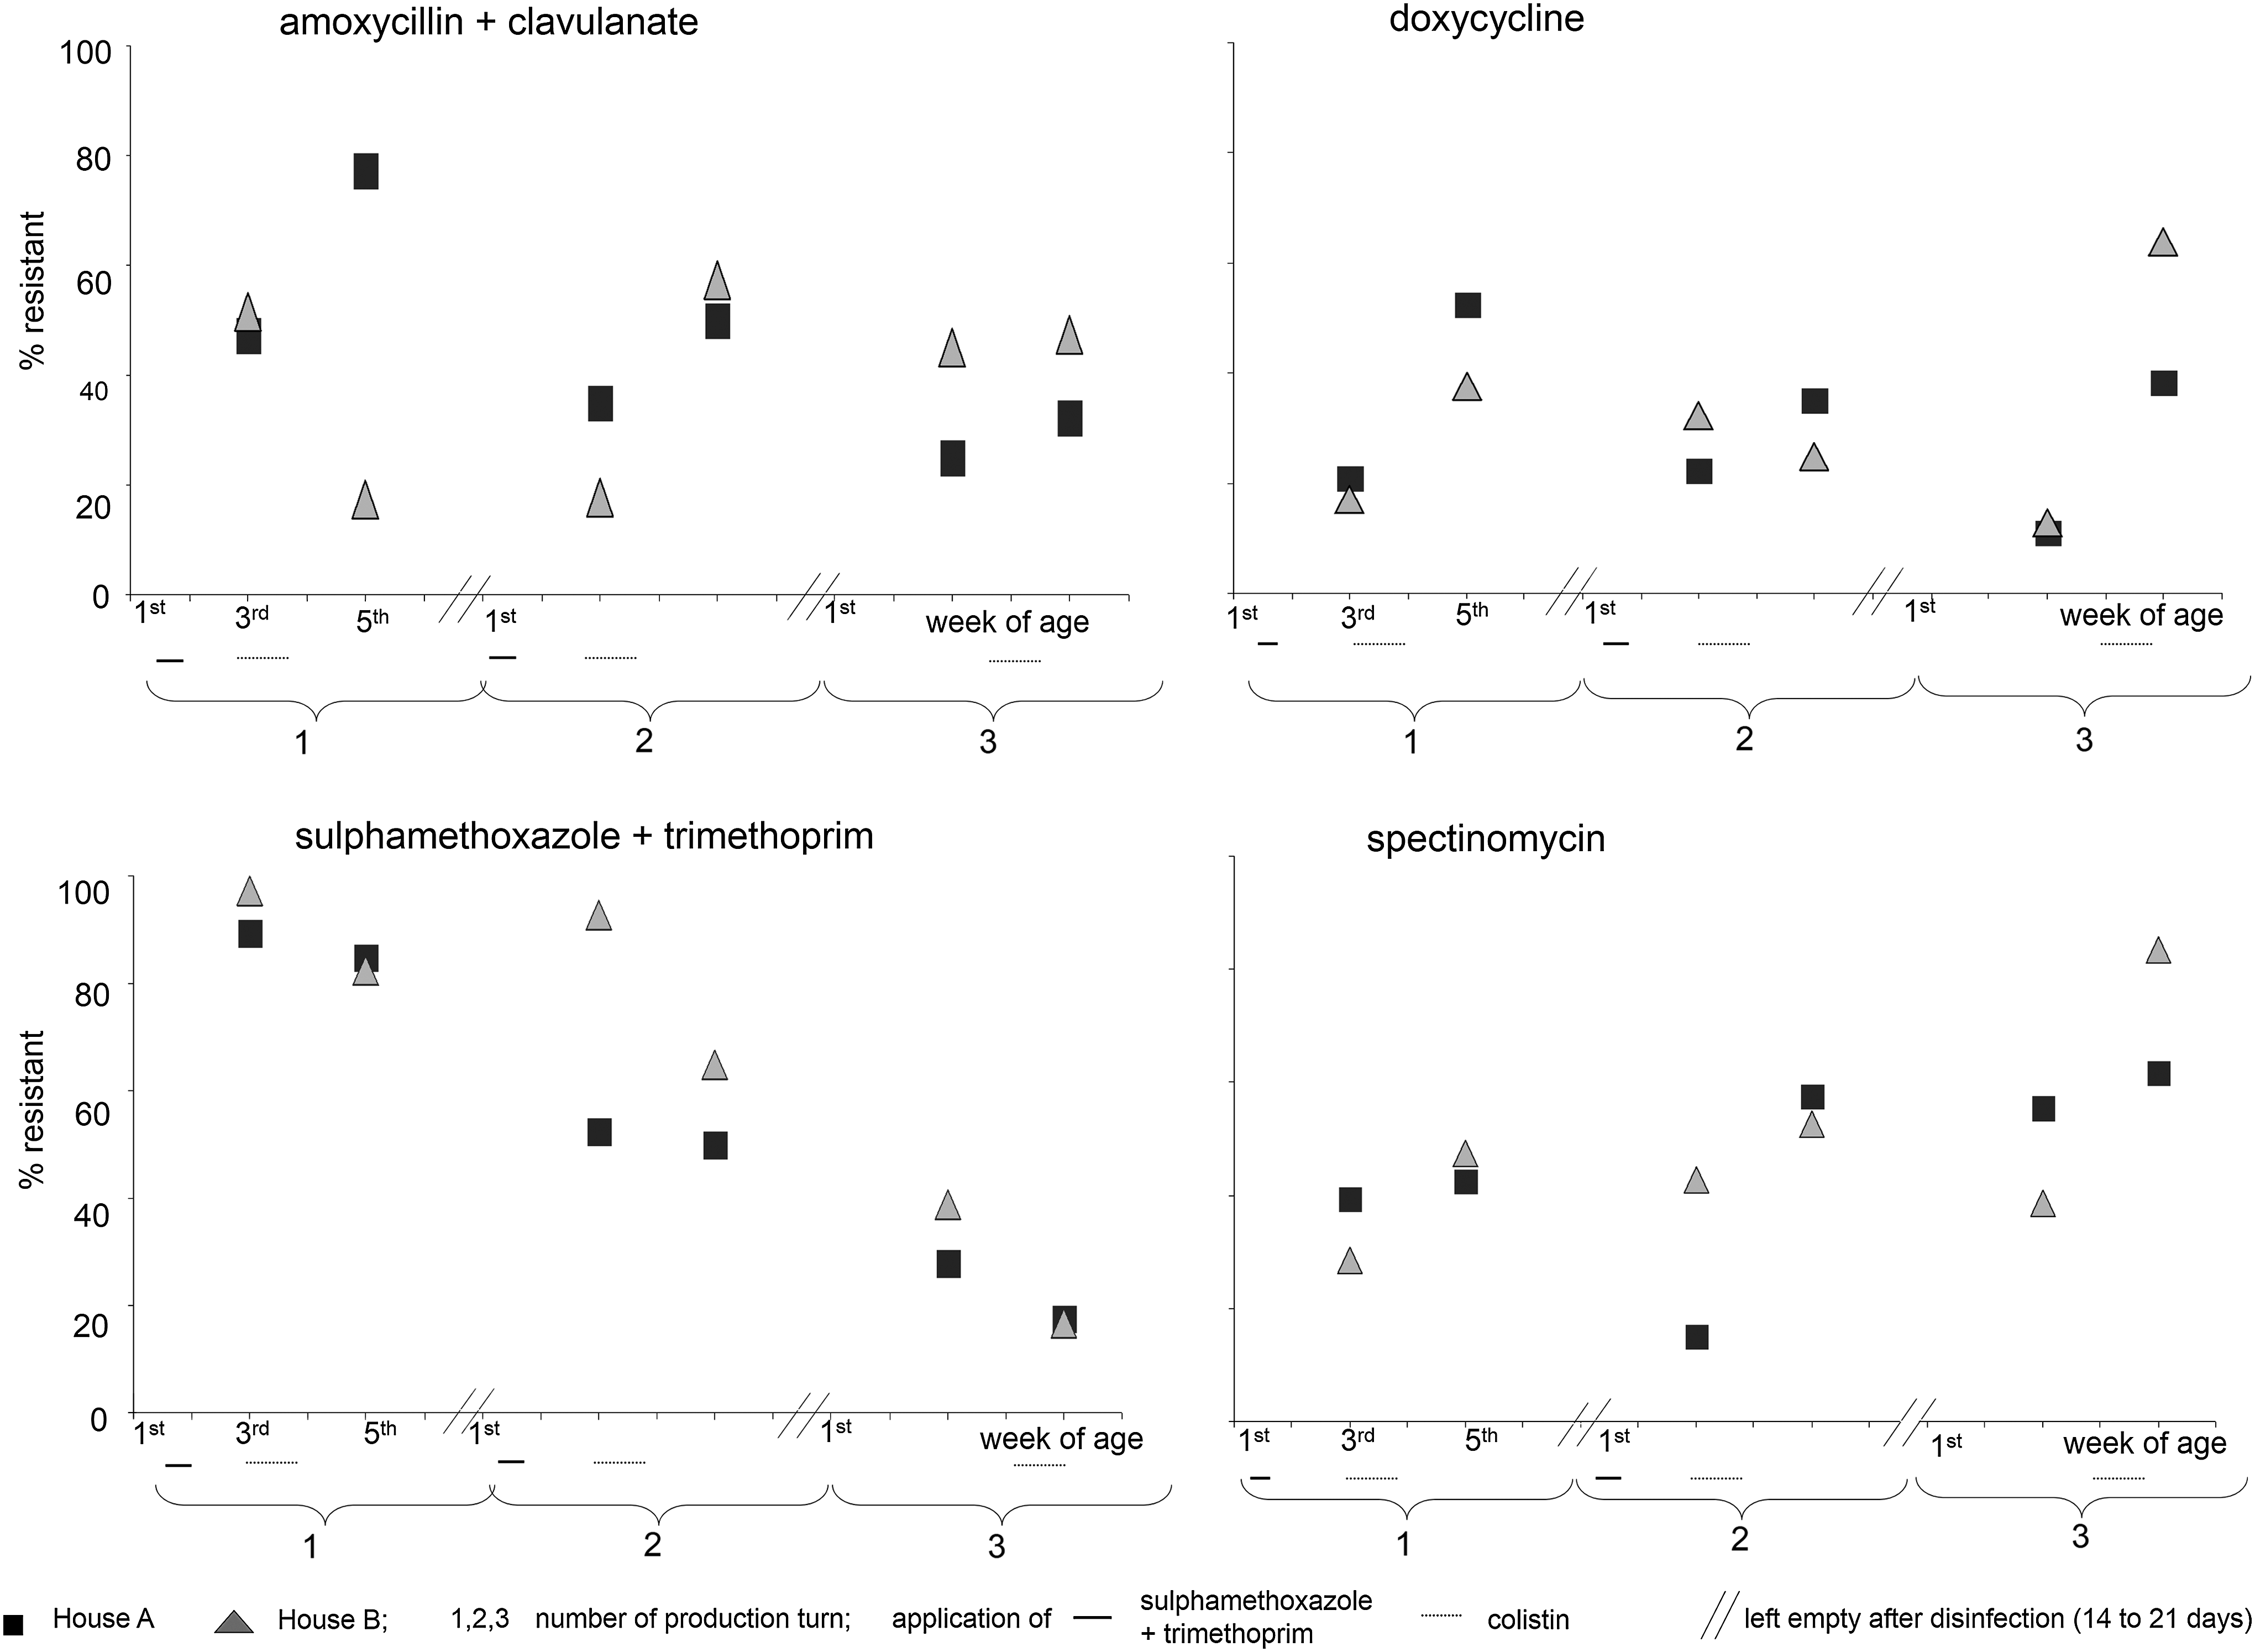
Antimicrobial resistance (%) of Escherichia coli isolated from different houses and production turns on one broiler chicken farm.
Antimicrobial susceptibility missing to 100%: intermediately resistant.
Boldface antimicrobial agents and figures are those with significant differences (p<0.05).
Differs significantly from the third week of life in a chi-squared test.
Significantly more E. coli of house B were resistant to sulfamethoxazole + trimethoprim, compared to E. coli isolated from house A (65% vs. 55%). All other resistance rates differed only marginally or occasionally between house A and B. sulfamethoxazole + trimethoprim was applied in all chicken of the first two production turns in houses A and B within the first week of life. In these production turns, sulfamethoxazole + trimethoprim resistance rates decreased significantly from 97% to 83% (turn 1) or from 93% to 65% (turn 2) between the third and fifth week of life in house B, while sulfamethoxazole + trimethoprim resistance rates remained stable in house A (Fig. 1). Although in turn 3 sulfamethoxazole + trimethoprim was not applied and the level of sulfamethoxazole + trimethoprim resistance was already significantly lower at the first time of sampling, resistance rates decreased further from 28% to 18% in house A and from 38% to 17% in house B (Fig. 1).
The occurrence of sul2 genes increased significantly (p<0.001) between the third and fifth week of life, if chicken were treated with sulfamethoxazole + trimethoprim in the first days of life (Fig. 2). By contrast, the prevalence of sul2 decreased significantly (p=0.01) between the third and fifth week of life in both flocks that were never treated with sulfamethoxazole+trimethoprim. The occurrence of sulfonamide resistance genes did not clearly correlate with phenotypic sulfamethoxazole+trimethoprim resistance (Fig. 2).
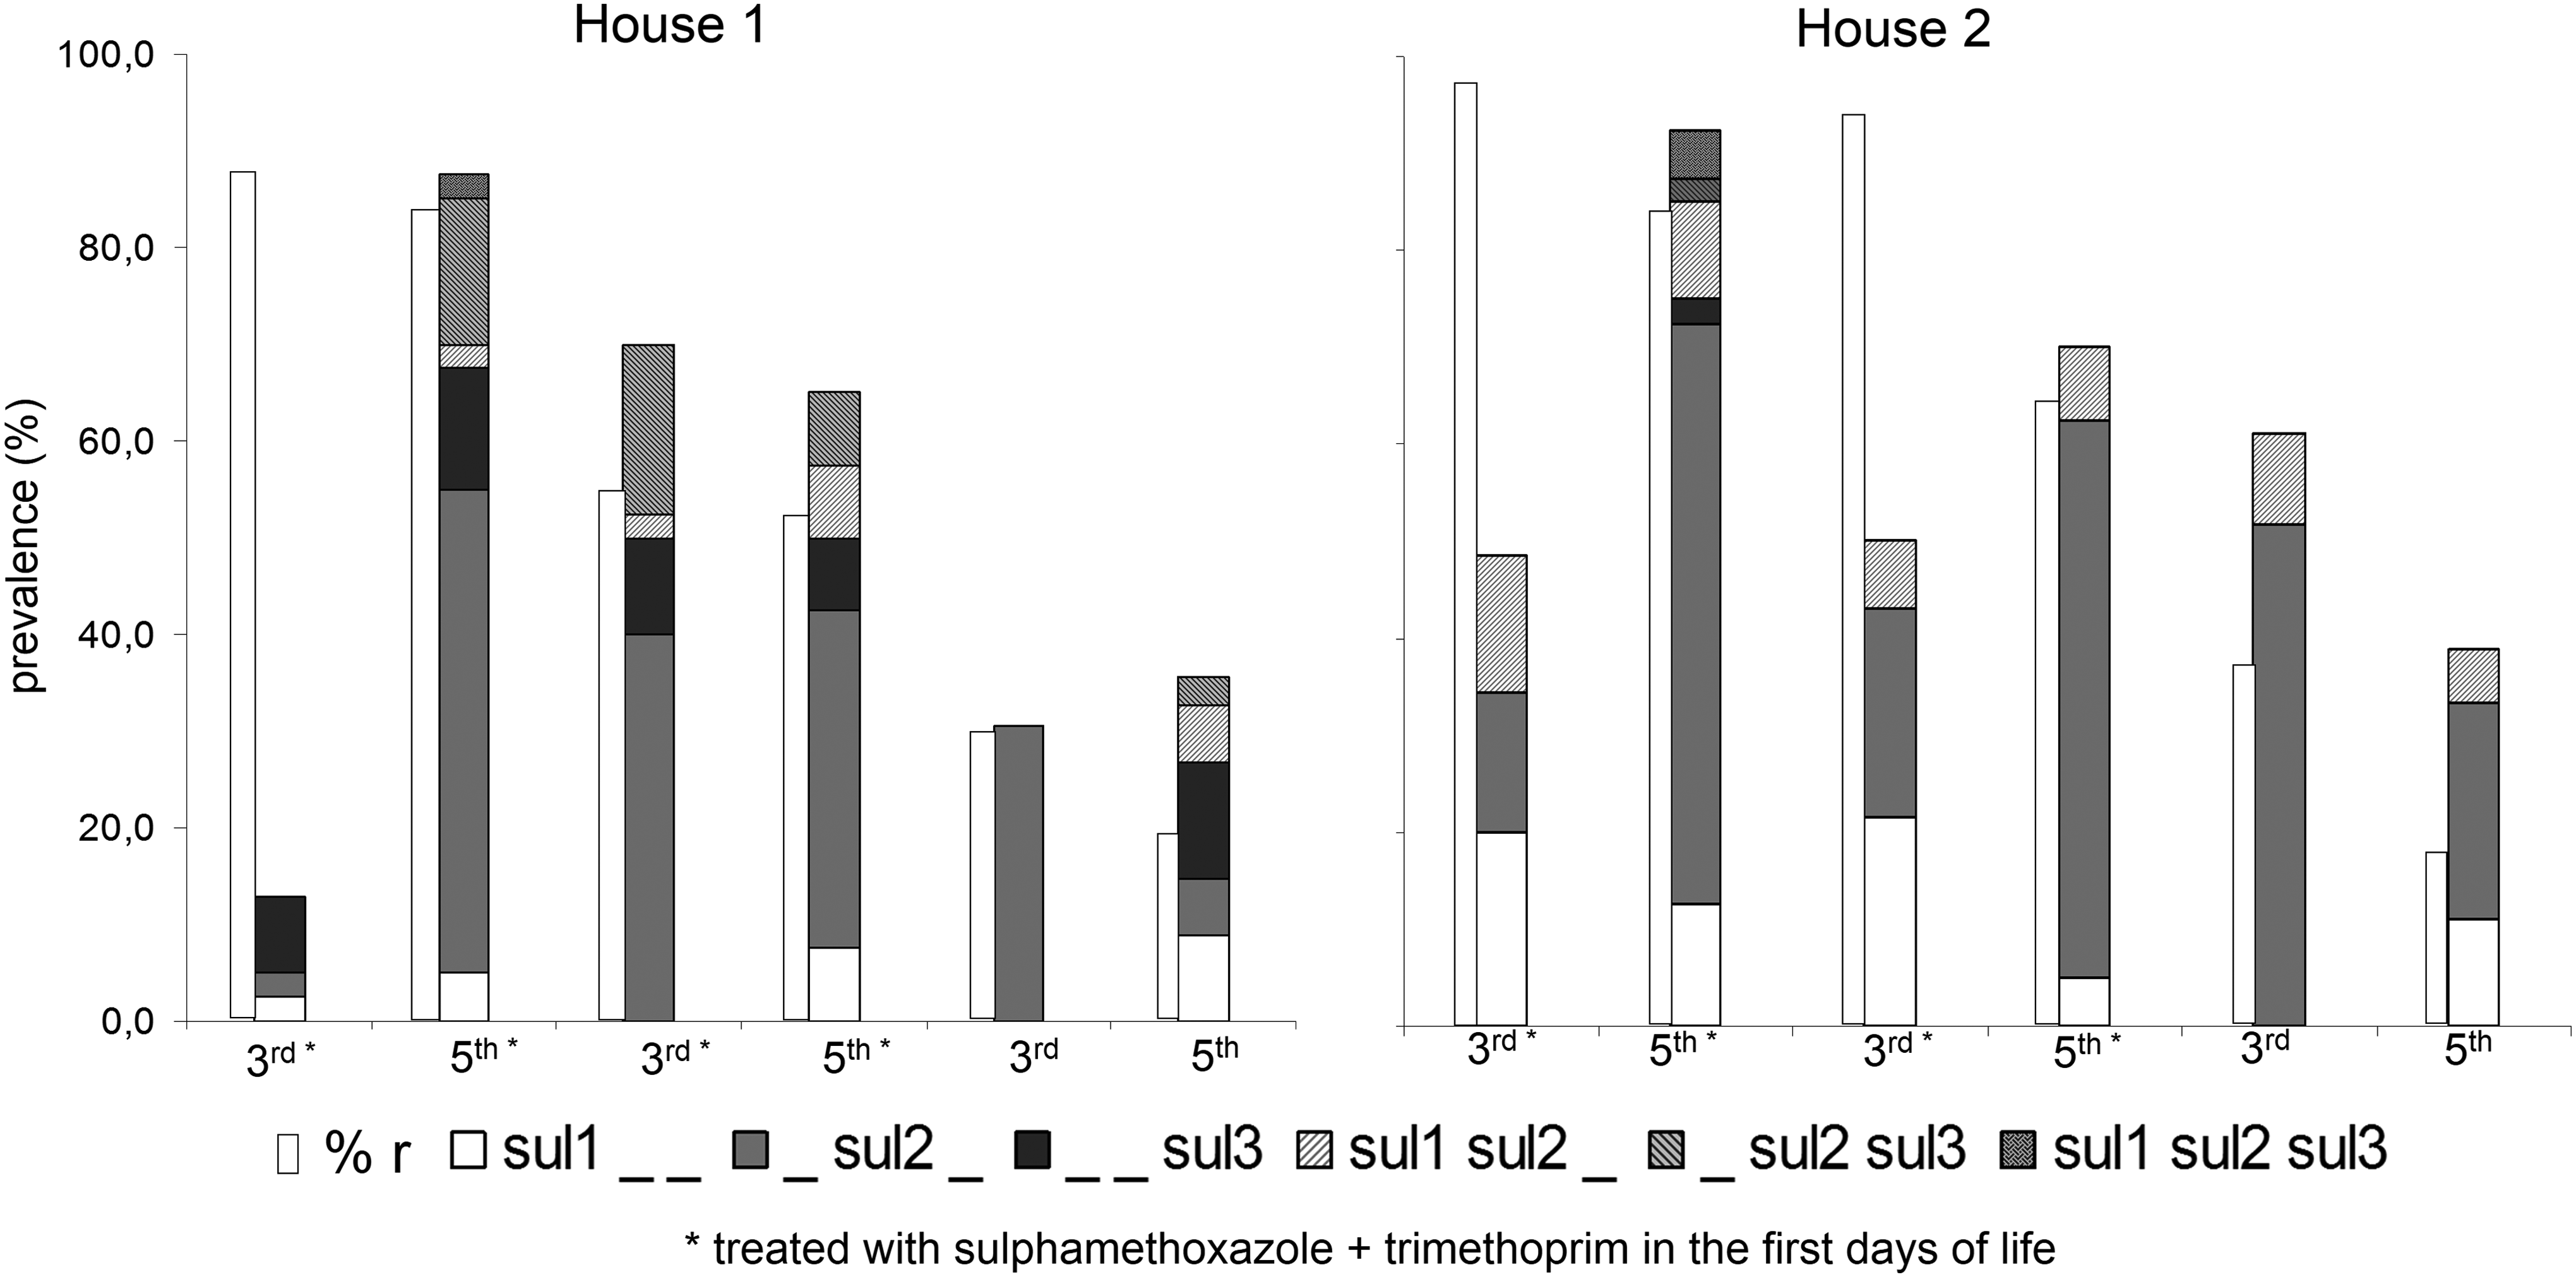
Prevalence of sul genes and sulfamethoxazole + trimethoprim resistance in Escherichia coli isolated from chicken with and without sulfamethoxazole + trimethoprim treatment in the first days of life.
The prevalence of qacEΔ1 increased significantly from week 3 to 5 (mean: 8.4% vs. 17.1%, p=0.007), and was significantly higher in sulfamethoxazole+trimethoprim–treated flocks, compared to flocks that were raised without sulfamethoxazole+trimethoprim treatment (mean 15.5% vs. 7.1%, p=0.015). The combination of qacEΔ1 and sul1 (indicative for classical class 1 integrons) was significantly (p=0.014) more prevalent in isolates from sulfamethoxazole+trimethoprim–treated flocks (9.63%), compared to untreated flocks (2.92%). In contrast to the distribution of qacEΔ1 alone, the combined presence of sul1 and qacEΔ1 increased only insignificantly between the third and fifth week of chicken's life (p=0.085).
The diversity of sul gene profiles was significantly higher in house A, compared to house B. This was mainly due to a significantly higher prevalence of sul3 in house A; 14.8% of E. coli from house A and 2.3% from house B were positive for sul3 (p<0.001). The detection of sul3 was significantly associated with the use of sulfamethoxazole + trimethoprim (Fig. 2, p<0.001).
During the investigation period of 17 weeks, eight ESBL isolates were found without selection, resulting in a prevalence of 1.8% within all E. coli isolates (2.2% in house A and 1.4% in house B), or of 13.3% within all 60 collective samples (16.6% in house A and 10% in house B). Of the six divided chicken flocks, four were positive for ESBL strains (turn 1 and turn 3 in both chicken houses). Turn 2 appeared to be negative for ESBL strains in both chicken houses. The prevalence of ESBL strains did not increase during fattening (1.9% vs. 1.8% at 3 and 5 weeks of age, respectively).
The accompanying phenotypic resistances of ESBL strains differed even between isolates of one chicken flock (Fig. 3). Five of eight ESBL strains were sulfamethoxazole+trimethoprim resistant; the three sulfamethoxazole+trimethoprim–susceptible ESBL strains were isolated from the two sulfamethoxazole+trimethoprim–free raised flocks. The eight ESBL strains were further characterized by ERIC-PCR. Even if only dominant bands were considered, only three isolates appeared to be closely related. The related ERIC types were found in the first and third production turn of house A and in the first production turn of house B. Two other ESBL strains of house B differed clearly from the first strain, from all strains in house A, and among each other (Fig. 3).
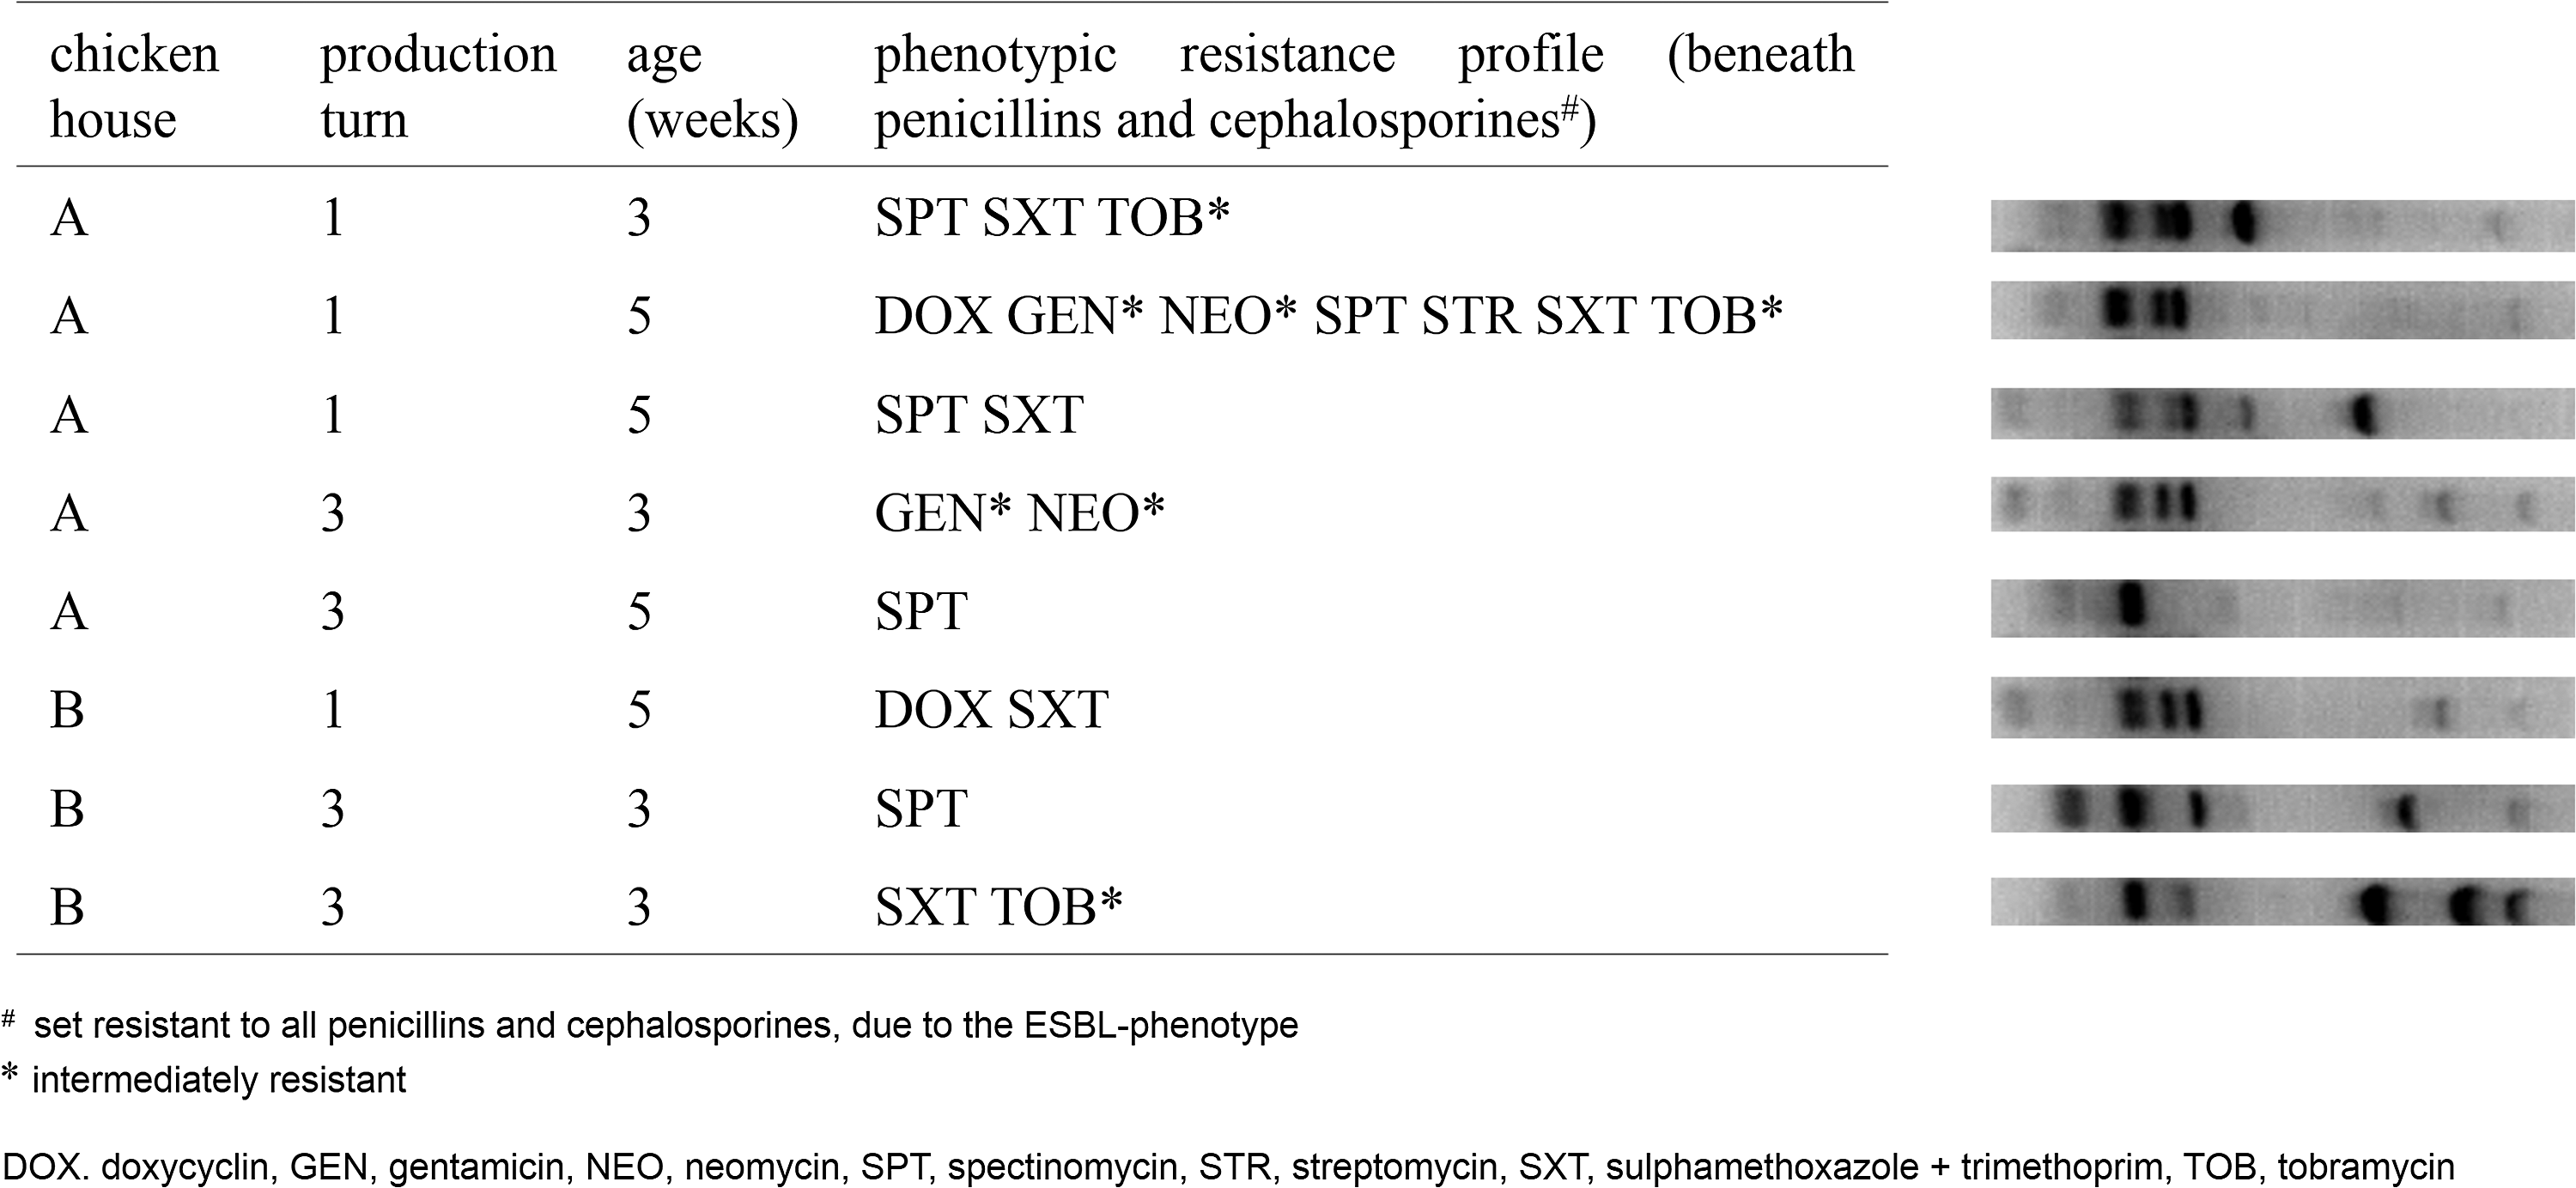
Phenotypic-resistance profiles and relatedness of enterobacterial repetitive intergenic consensus (ERIC) types of extended-spectrum β-lactamase strains (n=8) isolated from broiler chicken.
In addition to the ESBL strains, 47 E. coli (10.7%) were positive in the indicator test (mainly with ceftazidim), but had an indicator:indicator+inhibitor ratio below 8. The prevalence of these strains was significantly (p<0.001) higher in the third turn (33 of 138, 23.9%) than in the first turn (5 of 154, 2.6%) or second turn (9 of 155, 5.8%). Only an insignificant increase of this phenotype from the third until the fifth week of life was seen (9.1% vs. 12.2%).
Beneath this inhibitor-resistant phenotype and the ESBL strains mentioned above, a high percentage of the E. coli was resistant to amoxicillin + clavulanate and/or other cephalosporins than the indicator substances, and these resistance phenotypes increased significantly from the third until the fifth week of life (Table 3).
Discussion
Within the investigation period, the poultry farm applied up to three antibiotics (sulfamethoxazole + trimethoprim, benzyl-penicillin, and colistin; Table 1). Benzyl-penicillin, is, due to intrinsic resistance, not directed against E. coli and is therefore negligible for the selection of resistant E. coli. With regard to sulfamethoxazole + trimethoprim, Murray et al. observed a very rapid decrease of sulfamethoxazole+trimethoprim resistance within 4 days after the end of therapy. 27 In our study, resistance to sulfamethoxazole+trimethoprim remained high until the third week of life, and decreased considerably between the third and fifth week of life, although sulfamethoxazole + trimethoprim was already administered in the first days of life. It is interesting that the resistance decreased at all, since Enne et al. 13 found sulfamethoxazole + trimethoprim resistant strains to persist despite a huge decrease in sulfonamide prescription. However, the authors attribute this mainly to antibiotic coselection, which was not given in our study. Interestingly, the correlation between phenotypic sulfamethoxazole+trimethoprim resistance and the occurrence of sul genes was very low, especially in the third week of life (Fig. 2). In contrast to DIN 58940-4, EUCAST refers to the trimethoprim concentration, not the sulfonamide concentration for assessing sulfamethoxazole + trimethoprim resistance. All resistant isolates had MICs>4 mg trimethoprim/L (EUCAST breakpoint). This EUCAST breakpoint refers to a trimethoprim-sulfonamide ratio of 1:19, and thus corresponds to a sulfamethoxazole concentration of >76 mg/L, while the DIN breakpoint was >64 mg sulfamethoxazole/L. However, in the present study, almost all E. coli that were classified as resistant by using the DIN breakpoint had MIC values >128 mg sulfamethoxazole/L (data not shown). This excludes that the observed resistance rates are an artifact caused by methodological bias. However, we found a large percentage of sulfamethoxazole + trimethoprim–resistant strains where no sul genes were detectable, indicating a major role of mutation-based (chromosomal) sulfonamide resistance mechanisms.37,38 Nevertheless, the prevalence of sul2 increased significantly in flocks that were treated with sulfamethoxazole + trimethoprim, but decreased in flocks without sulfamethoxazole + trimethoprim treatment. A loss of sul2 genes in the absence of selective pressure seems feasible: of four sul2-coding plasmids that were investigated by Enne et al. 12 in the absence of sulfonamides, three imposed fitness costs on the host, and the fitness advantage of the fourth plasmid was only 4%.
The diversity of sul genes—and mainly the prevalence of sul3—was higher in house A, compared to house B. This might be connected to the water conservation system, which was present only in house A, and did significantly (p<0.001) reduce the enterobacterial load in the drinking water (data not shown), thus maybe impeding distinct successful clones of E. coli from spreading effectively within the flock, thereby allowing a higher diversity of isolates.
At the fifth week of life, in both houses significantly more isolates of turn 1 were resistant to sulfamethoxazole + trimethoprim, compared to turn 2. Chicken of turn 1 experienced 4 days of sulfamethoxazole + trimethoprim treatment, while chicken of turn 1 experienced 3 days of treatment. The prolongation of treatment is considered as one of the factors that increase the frequency of resistance,2,10 but differences might also be assigned to a different initial microbiome of the day-old-chicken. Different phylogenetic types of E. coli are present even within one animal, 32 which might additionally differ considerably in their initial resistome and therefore in their selectability. 22
Despite the fact that all chicken were treated with colistin, the prevalence of colistin-resistant strain was moderate, although chicken were sampled right during colistin application (turns 1 and 3) and 2 days after the end of colistin application (turn 2), respectively. Colistin resistance is generally very rare in poultry-derived E. coli up to now,11,35 just like in human E. coli isolates.14,21 Colistin resistance decreased within 2 weeks after colistin application, resulting in a prevalence of 0.0% (four flocks) to 2.5% (two flocks) in the fifth week of life. Thus, selective pressure remains—for the time being—without severe consequence, maybe due to a below-threshold prevalence of resistant strains, 2 but this might be a rope of sand and should not encourage the use of this valuable human reserve antibiotic in poultry. 15
Resistance to spectinomycin and doxycycline increased significantly with age in all three production turns, despite the fact that both substances were not used on the farm. Colistin would not have been able to exert coselection, since it did not exert selection. However, resistances to spectinomycin and doxycycline are indeed coselectable by sulfonamides. 26 The prevalence of sul2 genes increased significantly following sulfamethoxazole + trimethoprim use despite decreasing phenotypic sulfamethoxazole+trimethoprim resistance. The detection of sul2 is associated with strA-strB,20,31 and was also found to be significantly linked to tetB. 36 The prevalence of classical class 1 integrons—which, theoretically, would be even more relevant for the spreading of co-resistances (e.g., spectinomycin resistance encoded by aadA1)—increased significantly, too, but on a much lower level (from 2.9% to 9.6%). Thus, basically resistance against spectinomycin and doxycycline might have been coselected by sulfamethoxazole + trimethoprim. However, this theory of coselection does not provide a coherent explanation for the pronounced increase of spectinomycin and doxycycline resistance in turn 3 (house B). Further investigations would be needed to fully explain the success of doxycycline- and spectinomycin-resistant E. coli in chicken flocks without selective pressure posed by antibiotics.
ESBL strains were detected without ESBL-selective media from 8 of 60 collective samples (13.3%). Randall et al. 30 found that 8% of pooled caecal samples yielded strains with an ESBL phenotype. The phenotypic resistotype of the ESBL isolates in our study was considerably varied. This is in accordance to Bortolaia et al., 5 who found the genetic environment of ESBL-encoding genes to be highly variable.
ESBL strains belonged to six different ERIC types, indicating that the majority of ESBL strains were not closely (or even less clonally) related. Pulsed field gel electrophoresis investigations and multilocus sequence typing gave similar results with other strains from epidemiologically unrelated sources in the past.5,28,30 In the present study, all isolates derived from six flocks on one single farm. Bortolaia et al. 5 found a certain diversity of ESBL-producing isolates from identical flocks by amplified fragment length polymorphism (AFLP), with up to eight different AFLP types in one single flock, but also identical clonal types in two different flocks. Accordingly, one ERIC type of our study was repeatedly found in the present investigation: twice in house A (turns 1 and 3) and once in house B (turn 1). Using a non-selective and non-enriching sampling procedure, we could not exclude that the strain was present—but overlooked—in the second production turn, too. Due to the fact that day-old-chicken of all production turns were purchased from the same hatchery and were looked after by the same staff, it remains unclear whether this clonal type was repeatedly introduced or not eliminated by disinfection. The fact that this type was found in two separated houses might rather indicate repeated introduction. Accordingly, Bortolaia et al. 5 describe one isolate from a parent flock that shared the AFLP profile with isolates of two different broiler flocks.
All flocks were positive for isolates with a reduced susceptibility to ceftazidim or cefotaxim that was not restorable by clavulanate. Such an inhibitor-resistant phenotype could be attributed to plasmid-borne AmpC-β-lactamases or to inhibitor-resistant variants of TEM-type β-lactamases. 3 Interestingly, the prevalence of this phenotype was not selected by sulfonamides, since the prevalence in the sulfonamide-free raised flocks of turn 3 was significantly higher (p<0.001), compared to turns 1 and 2. Incompatibility of plasmids might be one possible explanation for this inverse association: genes encoding AmpC-β-lactamases are often found on plasmids of the IncI1 group in animal-borne E. coli, 7 as are sul1 and sul3 genes 40 ; inhibitor resistant TEMs are often encoded by IncFII-borne genes, 7 as are sul2 genes. 40 Further molecular investigations would be necessary to verify this hypothesis.
In addition, a considerable number of the E. coli isolates were resistant to amoxicillin + clavulanate and/or to non-ESBL-indicator cephalosporins, but susceptible to indicator cephalosporins. This might suggest a high prevalence of chromosomally encoded AmpC enzymes and non-ESBL-β-lactamases6,8 in poultry.
Conclusions
High antimicrobial resistance levels were found within 438 E. coli isolates of six flocks on one chicken farm. Use of sulfamethoxazole + trimethoprim was associated with phenotypic sulfamethoxazole + trimethoprim resistance, but also with the detection of classical class 1 integrons and the prevalence of sul2 and sul3. Without selective enrichment, ESBL strains were found in a considerable part of samples (13.3%), although with a low prevalence among all E. coli (1.8%). Although data from only six flocks should be carefully interpreted, a high diversity of ERIC types indicates that clonal dissemination seems not to face the charge for the main ESBL load in the investigated flocks raised by all-in, all-out production. Instead, a pool of different strains—with different accompanying resistances—seems to lie in wait for their turn.
Footnotes
Acknowledgments
We would like to thank our excellent laboratory staff Cornelia Oehme, Angelika Barreiro-Gebhardt, and Barbara Fritz.
Disclosure Statement
The authors declare they have no conflicts of interest.