
Abstract
Increasing the resistance of Gram-negative pathogens to antibiotics that inhibit protein synthesis is of great concern. In life-threatening situations, an early detection of antibiotic resistance may improve patient outcome. A rapid assay for the identification of antibiotic resistance to gentamicin, tobramycin, and tigecycline has been designed and tested in clinical strains of Acinetobacter baumannii, Pseudomonas aeruginosa, and the Enterobacteriaceae Escherichia coli and Klebsiella pneumoniae. Exponentially growing cultures were incubated with 0.5 mg/L mitomycin C (MMC) for 2 hr (10 mg/L for A. baumannii), which induced significant cell enlargement as visualized under the microscope. Addition of the appropriate antibiotic dose 15 min before the addition of MMC prevented elongation when the strain was susceptible to the antibiotic, thereby inhibiting protein synthesis. Cell enlargement was not precluded in the antibiotic resistant strains, where protein synthesis had not been successfully inhibited. In comparison with the standard dilution-based antibiogram, the sensitivity of the assay was 100% and the specificity ranged between 96.0% and 100%. Results were obtained after 2 hr and 45 min from exponentially growing cultures. The procedure is easy, reliable, and demonstrates the suitability of the evaluation of simple morphological changes, which are protein synthesis dependent, for the rapid detection of antibiotic resistance.
Introduction
T
Resistant strains of these Gram-negative pathogens to most antibiotics, including aminoglycosides and tetracyclines, are increasing and raising alarm worldwide. 4 Resistances to the relatively recent tigecycline are less common at this moment.5–7 The acquisition of resistance may result from chemical modification, efflux out of the cell, or decreased binding due to target alteration or to ribosomal protection. 8 In life-threatening infections, identification of resistant bacteria as soon as possible may prevent treatment failure and significantly improve patient outcome. In some cases, an assessment of simple morphological changes from bacteria has been demonstrated to be suitable as a fast indicator of resistance after careful optimization. 9
Mitomycin C (MMC) is a bifunctional alkylating agent that mainly induces DNA interstrand cross-links, being specific for a guanine in the sequence 5′-CpG-3′ in the minor groove of DNA.10,11 This genotoxic stress triggers a strong activation of the bacterial SOS response, a broad and complex regulatory network to address DNA damage. 12 The SOS response relies on the induction of the expression of genes that are mainly involved in the different DNA repair pathways, such as homologous recombination, nucleotide excision repair, and translesion synthesis. 13 The response is triggered through the generation of single-stranded DNA, which recruits the RecA protein. RecA nucleofilaments catalyze the auto-proteolysis of the repressor LexA, leading to derepression of genes belonging to the SOS regulon.
One of the characteristic phenotypic consequences of the SOS response induced by MMC is the cell elongation. The SOS-inducible protein SulA (or SfiA) inhibits the FtsZ protein, which is necessary to constitute the contractile Z ring at the site of the future septum, and subsequent bacterial division.14–16 The prevention of cytokinesis would allow for DNA repair before the cell divides. MMC-induced SOS response may also inhibit cell division by an lexA-dependent but SulA-independent mechanism, when the sfi-dependent pathway is inoperative. 17
Overall, the SOS-related MMC-induced elongation response requires a short-term transcriptional activation and consequent ribosomal translation. Thus, the inhibition of protein synthesis would prevent some of the outcomes of the induced SOS response. In this study, we explore the suitability of the evaluation of the MMC-induced SOS-linked cell elongation as a simple and rapid pointer of susceptibility resistance to the antibiotic inhibitors of protein synthesis, gentamicin, tobramycin, and tigecycline, in infections by highly relevant Gram-negative pathogens.
Materials and Methods
Bacterial strains and minimum inhibitory concentration determination
Clinical isolates of E. coli, K. pneumoniae, A. baumannii, and P. aeruginosa were collected at the University Hospital A Coruña between 2001 and 2015. Around 100 isolates per species and per antibiotic were studied for gentamicin, tobramycin, and tigecycline. Tigecycline was not evaluated in P. aeruginosa due to its intrinsic resistance. This antibiotic was only studied in 22 E. coli isolates since resistant strains were not identified. The minimum inhibitory concentrations (MICs) were ascertained by automated microdilution (MicroScan Walkaway, Siemens) and corroborated by E-test (AB Biodisk, Biomerieux) according to the manufacturer's instructions, with susceptibility defined by using Clinical and Laboratory Standards Institute (CLSI) criteria. 18
Induction of cell elongation
Bacteria cultured on solid media plates were used to inoculate a 2 ml Mueller-Hinton broth culture, and they were incubated at 37°C for 90 min. Afterward, the bacteria were diluted to an OD600 of 0.1 in Mueller-Hinton broth and incubated at 37°C in 200 μl tubes with MMC for 120 min in a final volume of 30 μl. To establish the minimum MMC concentration that positively induces cell elongation without significant cell loss, two strains of each species were incubated with 11 increasing doses ranging from 0 to 200 mg/L for E. coli, K. pneumoniae, and A. baumannii, and from 0 to 50 mg/L for P. aeruginosa. To assess cell length, a previously described protocol was used. Briefly, after incubation with MMC, the bacteria were diluted to a concentration of 1 × 10⁷ microorganisms/ml in Mueller-Hinton broth, included in a thin agarose microgel on a slide, dehydrated in increasing ethanol baths, dried, stained with the fluorochrome SYBR Gold, and examined under a fluorescence microscope. The aforementioned protocol results in crisp images and without a confusing background, allowing a confident evaluation of cell length.
Determining resistance by using cell elongation
The antibiotic (6 μl) was added to the culture 15 min before the addition of the MMC treatment and maintained for 2 hr of incubation. After incubation, the bacteria were processed to evaluate cell length, as described earlier. Control cultures without antibiotic and MMC, with antibiotic only, and with MMC only were always processed simultaneously. Controls without antibiotic and MMC, and with antibiotic only, provide the basal cell length of each specific strain. The culture with MMC establishes the elongation size. The culture with the antibiotic co-incubated with MMC reveals whether there is prevention or not of the MMC-induced cell enlargement.
The relationship between the prevention of MMC-induced cell elongation and CLSI breakpoint concentrations of the antibiotics was empirically established after processing a subset of strains comprising a wide range of MICs, including susceptible, intermediate, and resistant strains exposed to progressively increasing antibiotic doses. The CLSI breakpoint concentrations of tigecycline are not established for A. baumannii, so the same breakpoints as those for Enterobacteriaceae are used in the clinic. Several strains with MICs that were close to the CLSI breakpoints for susceptibility and resistance were employed. Antibiotic concentrations that suppress MMC-induced cell enlargement in the susceptible but not in the intermediate and resistant strains were determined. It should be noted that the suppression of MMC-induced cell elongation is considered when the bacterial size is not significantly different from that of the control untreated culture.
The concentrations of antibiotics were optimized such that a strain categorized as susceptible by following CLSI criteria must demonstrate abolition of cellular elongation after incubation with the lowest concentration of antibiotic established as the susceptibility breakpoint when using the parameter of elongation-suppression. Notably, a non-susceptible strain should not show any abolition of the MMC-induced elongation with the established breakpoint concentration of antibiotics.
Once implemented, the breakpoint concentration for the elongation-suppression criterion that correlates with the CLSI susceptibility breakpoint for each antibiotic and bacterium, the collected isolates were blindly processed. For each isolate, four cultures were established, as indicated earlier: (1) a control culture with neither antibiotic nor MMC, (2) a control culture with the established breakpoint dose of antibiotic only, (3) a culture with MMC only, and (4) a culture with the antibiotic and MMC.
Data analysis
Images were captured with an Apogee KX32 ME camera, and image analysis was performed by using Visilog 5.1 software (Noesis, Gifsur Yvette, France), measuring 100 cells per assay. Data were analyzed by using the SPSS Statistics 21 software package for Windows (IBM). A t test was employed for comparison between groups. Statistical significance was defined as p < 0.05.
Receiver operating characteristic (ROC) curves were constructed with the results obtained during the validation assay. The area under the curve (AUC) values indicate the global classification ability of the test. Validation indexes were estimated by using the Epidat 3.1 software package (Consellería de Sanidade, Xunta de Galicia, Spain, and Panamerican Health Organization, Washington, DC).
Results
MMC-induced bacterial elongation
Exponentially growing cultures were exposed to increasing MMC concentrations for 120 min (Fig. 1). Bacterial cell size was always heterogeneous for each dose. Measures of cell length in E. coli and in K. pneumoniae evidenced a progressive increase in the mean length until 0.5–1 mg/L followed by a progressive decrease. Cell concentration was progressively diminished from 1 mg/L in both species. Thus, 0.5 mg/L MMC concentration was selected for the future experiments with antibiotics since it is the minimum dose that provides the highest enlargement, increasing the basal mean length from near three times to four times in both species, while maintaining the cell number.

Dose response of MMC-induced cell elongation in two strains of Escherichia coli (first line), Klebsiella pneumoniae (second line), Pseudomonas aeruginosa (third line), and Acinetobacter baumannii (last line). MMC dose is in mg/L (horizontal axis). Bacterial cell length is in μm (vertical axis). The data are shown as box and whisker plots. The horizontal line in the box corresponds to the median, the lower line of the box is the first quartile, the upper line of the box is the third quartile, and the whiskers (the end of the vertical lines) are maximum and minimum data values. The dots outside the box represent abnormal values. MMC, mitomycin C.
P. aeruginosa also showed a progressive increase in mean length until 0.5 mg/L, with the size being initially maintained and then shortening. Nevertheless, given the effect on cell number, 0.5 mg/L MMC was also selected for P. aeruginosa. A. baumannii required incubation with a higher range of MMC concentration to produce an increase in mean cell length. The highest increase with respect to background was observed after 10 mg/L, that is, 1.5–2 times. Doses higher than 25 mg/L strongly reduced cell numbers, so 10 mg/L MMC was utilized.
Determining resistance by using cell elongation
The rationale of the procedure to discriminate susceptible from non-susceptible strains is illustrated in Fig. 2. Two E. coli strains, one susceptible to gentamicin (S: MIC: 1 mg/L) and one resistant to it (R: MIC: 32 mg/L), were incubated with gentamicin 4 mg/L (CLSI breakpoint of susceptibility) 135 min, 0.5 mg/L MMC 120 min, and gentamicin 135 min together with MMC during the last 120 min. Gentamicin alone did not change the basal cell length (basal-S: 1.10 ± 0.25 μm; basal-R: 1.16 ± 0.23 μm; gentamicin-S: 1.12 ± 0.18 μm; gentamicin-R: 1.23 ± 0.22 μm; mean ± SD). MMC treatment induced a significant cell enlargement (MMC-S: 4.21 ± 1.41 μm; MMC-R: 3.98 ± 1.21 μm). Incubation with gentamicin followed by MMC suppressed the cell enlargement in the susceptible strain (gentamicin+MMC-S: 1.13 ± 0.21 μm), but it did not prevent the elongation in the resistant strain (gentamicin+MMC-R: 4.02 ± 1.23 μm).
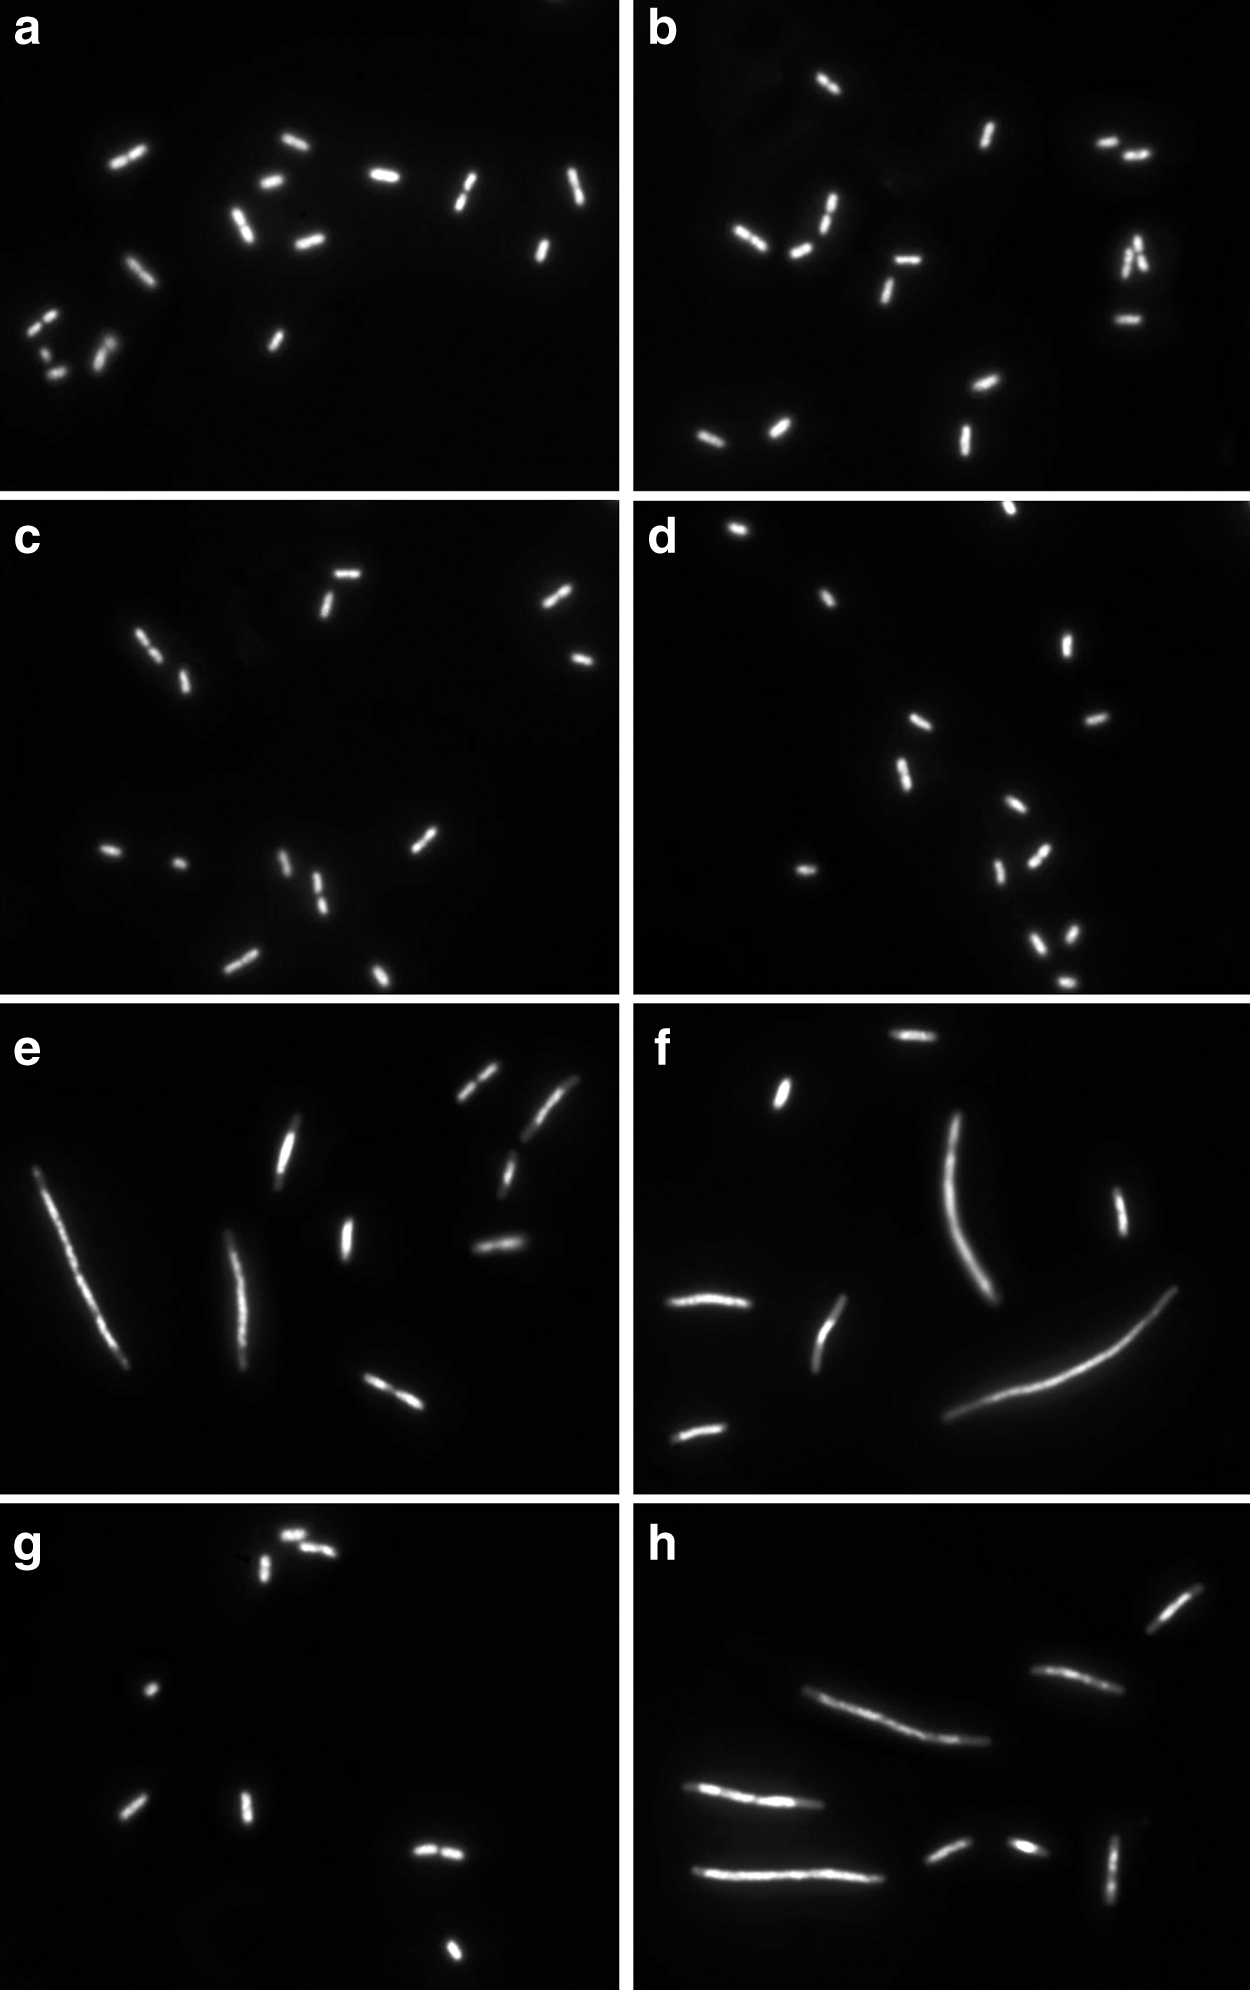
E. coli strains susceptible (left, MIC: 1 mg/L) and resistant (right, MIC: 32 mg/L) to gentamicin.
Figure 3 shows the dose response for the suppression of MMC-induced cell enlargement by increasing concentrations of gentamicin, ranging from 0.25 to 16 mg/L, in four strains with increasing MICs (1, 4, 8, and 32 mg/L) of E. coli. According to the CLSI criteria, the first strain is susceptible; the next strain is at the susceptibility breakpoint; the next strain has intermediate resistance; and the last strain is categorized as resistant. No differences in cell length were detected among the different concentrations of gentamicin in the bacteria cultures that were incubated only with the antibiotic. For clarity, only one dose of the gentamicin-alone treated cultures is shown.

Cell length measures (μm) of E. coli (left) and P. aeruginosa (right) strains with different MICs for gentamicin. First row corresponds to susceptible strains (Sa), both with MIC 1 mg/L; second row contains strains at the limit of susceptibility (Sb), both with MIC 4 mg/L; third row consists of intermediate strains (I), with MIC 8 mg/L for E. coli and 6 mg/L for P. aeruginosa; and final row consists of resistant strains (R), with MICs 32 mg/L and 256 mg/L for E. coli and P. aeruginosa, respectively. Each strain shows cell length (vertical axis) measured in, from left to right (horizontal axis), control cultures (C), cultures incubated with gentamicin (G), 0.5 mg/L MMC, and with increasing doses of gentamicin (0.25, 0.5, 1, 2, 4, 8, and 16 mg/L) together with 0.5 mg/L MMC (G+M). Cultures incubated with the different concentrations of gentamicin alone showed no significant differences in cell length, so for clarity purposes only one is enclosed (G). The data are presented as box and whisker plots. The horizontal line in the box indicates the median, the lower line of the box is the first quartile, the upper line of the box is the third quartile, and the whiskers (the end of the vertical lines) are maximum and minimum values. Abnormal values are presented as dots outside the box.
In E. coli, a clear partial suppression of MMC-induced cell elongation was generally evident after a gentamicin dose of 0.5 × MIC. This suppression was total, that is, no statistically significant differences with respect to the length of the control, when the gentamicin concentration was similar to the MIC in the susceptible strains and 2 × MIC in the rest of strains. The presumed gentamicin dose that may discriminate susceptible from non-susceptible strains based on the criterion of prevention of MMC-induced cell elongation would be similar to the breakpoint of susceptibility indicated by the CLSI, based on the criterion of cell growth inhibition (4 mg/L).
Four strains of P. aeruginosa (MICs: 1, 4, 6, and 256 mg/L) were also incubated with the same concentrations of gentamicin (Fig. 3). According to the CLSI criteria, the first strain is susceptible; the next strain is at the breakpoint of susceptibility; the next strain is intermediate; and the last strain is resistant. P. aeruginosa showed a higher sensitivity to gentamicin for the prevention of MMC-induced elongation. The total suppression was achieved by gentamicin at concentrations near 0.5 × MIC. The gentamicin doses employed did not ever modify the MMC-induced enlargement in the resistant strain. Using a concentration similar to MIC could incorrectly assign some non-susceptible strains as susceptible ones, according to the CLSI. As a consequence of these results, the breakpoint concentration that distinguishes susceptible from non-susceptible strains by using the criterion of prevention of MMC-induced cell elongation would be 2 mg/L, which would correlate with the CLSI breakpoint of 4 mg/L, based on cell growth inhibition.
After similar dose–response assays, the breakpoint concentrations of gentamicin, tobramycin, and tigecycline that discriminate susceptible from non-susceptible strains according to the CLSI guide were established for the MMC-induced cell enlargement suppression assay. These doses were similar or lower than the corresponding CLSI breakpoint of susceptibility, except for tobramycin in E. coli and P. aeruginosa, which required 2 × the CLSI breakpoint dose (Table 1).
AUC, area under the ROC curve; CLSI, Clinical and Laboratory Standards Institute; NS, non-susceptible; ROC, receiver operating characteristic; S, susceptible.
Assay validation
Table 1 summarizes the results obtained with blindly processed clinical isolates, in comparison with the standard antibiogram. Tigecycline was not evaluated in P. aeruginosa since there is intrinsic resistance. Due to the lack of resistant strains for tigecycline, only 22 isolates were studied in E. coli, with all of them being correctly identified as susceptible. The AUC in the ROC analysis evidenced a practically absolute discrimination of non-susceptible strains by using the identified breakpoints of antibiotic concentration. Sensitivity was 100% and specificity ranged from 96% to 100%. Only one false positive strain was found for tobramycin and another one for tigecycline, in K. pneumoniae. P. aeruginosa also revealed one false positive for gentamicin and for tobramycin. Two false positive strains for gentamicin and for tobramycin were found in A. baumannii. False positives of resistance are not very relevant, and all of them showed MICs close to the breakpoint concentration of susceptibility. False negatives of resistance are more dangerous, but only one has been detected for tigecycline in A. baumannii, and showing an MIC of 2 mg/L, that is, the breakpoint dose of resistance using the similar breakpoint than for Enterobacteriaceae.
Discussion
In a previous report, we showed that the lytic response induced by a brief incubation with lysozyme in Enterococcus faecalis or a mixture of Triton X-100, lysozyme, and EDTA in Streptococcus pneumoniae was regulated by protein synthesis. 19 When the bacteria were previously incubated with antibiotic inhibitors of protein synthesis, the lytic response was greatly suppressed in the susceptible strains where ribosomal protein synthesis had been inhibited. Nevertheless, the lytic response was much less suppressed in the resistant strains, where protein synthesis inhibition had been unsuccessful. This proved to be an efficient test for the rapid determination of resistance to antibiotics that inhibit protein synthesis in both Gram-positive pathogens.
The present study was undertaken to establish a rapid assay for the determination of resistance to antibiotics that inhibit protein synthesis in clinically relevant Gram-negative pathogens such as E. coli, K. pneumoniae, P. aeruginosa, and A. baumannii. The strategy was also used to identify a bacterial response that is easy to be recognized, influenced by protein synthesis in the short term. Cell enlargement is classically observed after MMC treatment, 20 being a consequence of induced SOS response. In fact, given its effectiveness, MMC is habitually employed as a positive control in experiments dealing with the SOS response, including the cell elongation effect.21,22
In the specific case of A. baumannii, although the LexA repressor protein seems absent, an SOS-like response recA dependent is induced as a consequence of DNA damage. 23 Perhaps this peculiarity is somewhat related to the necessity to incubate with higher MMC concentrations in A. baumannii than in the other species to achieve a significant elongation. Intriguingly, a recent report suggests that the unsegregated large nucleoid mass located at midcell resulting from MMC treatment could block Z ring construction in E. coli, and this effect could be independent of the SOS response. 24 Nevertheless, this effect was described at an MMC concentration of 2 mg/L, higher than 0.5 mg/L employed in our assay.
Here, we demonstrate that the cell elongation effect, a consequence of the MMC-induced bacterial elongation, is protein synthesis dependent. Incubation with too high MMC doses prevents cell growth in comparison with a culture without this agent. Moreover, these cells that are exposed to excessive MMC concentration cannot enlarge; so, the optimal MMC dose resulting in significant cell elongation but maintaining an adequate cell number must be established. Consequently, an MMC-induced cell enlargement suppression assay was optimized for the antibiotic inhibitors of protein synthesis in each bacterial species. Effective inhibition of protein synthesis by the antibiotic prevents the MMC-induced cell elongation in the susceptible strains. Otherwise, the antibiotic does not suppress the MMC-induced enlargement in the resistant strains, where protein synthesis was not successfully inhibited. This study is evidence that the lack of prevention of MMC-induced cell elongation allows a rapid identification of strains that are resistant to antibiotic inhibitors of protein synthesis in Gram-negative pathogens.
MMC is a very useful agent for bringing on the SOS response, and we did not find any clinical isolate that did not elongate after MMC treatment. Mutant strains with impaired MMC-induced SOS response at different levels could not be assayed by using this protocol. Nevertheless, the foremost goal of the test is to apply it to clinical strains, and to our knowledge these mutants are revealed mainly in laboratory strains. Spontaneous mutants with a disabled stress-protective SOS response would be less viable in a changing natural environment, and their virulence could be affected.12,13 Natural resistance to MMC is unexpected, but in any such case, alternative SOS inductors could be assayed.
Our assay was validated for the antibiotic inhibitors of protein synthesis that are the most often employed in our location for these Gram-negative strains. Although all the antibiotics assayed in the present study target the small 30S ribosomal subunit, some differences exist. Gentamicin and tobramycin are aminoglycosides that bind mainly to specific nucleotides in the helix 44 decoding or A-site of the 16S rRNA from the small 30S ribosomal subunit. 25 This sequence-specific binding causes tRNA to misread the mRNA codons as well as inhibition of the translocation of the peptidyl-tRNA from the A- to the P-site. 26
Aminoglycosides can also interact with the helix 69 in the 23S rRNA from the large 50S ribosomal subunit, negating dissociation and recycling of the ribosomal subunits. 27 Peculiarities may exist depending on the aminoglycoside type, since their binding affinities are related to the number of hydrogen bonds with the target RNA. 28 Tigecycline is a glycylcycline that also binds to the 16S rRNA from the 30S ribosomal subunit but blocking the entry of the aminoacyl-tRNA, halting the peptide chain elongation. 29 Overall, independently of the processes, ribosomal protein synthesis is compromised by the different antibiotics thus influencing the SOS response and the consequent cell elongation.
The assay is quite simple and confident, with results being obtained in 2 hr and 45 min when working with exponentially growing cultures. If not exponentially growing, the isolated bacteria must be previously cultured in Mueller-Hinton broth for 90 min. This is an entirely morpho-functional assay that does not require previous knowledge of the mechanism, genes, mutations, or proteins that are responsible for resistance, unlike in the PCR, microarray, or mass spectrometry-based procedures. The rapid test provides quick, relevant information about susceptibility or not to the antibiotic. This is the practical message that the clinician needs to prescribe, or not, or to change, or not, the antibiotic. Intermediate levels of resistance are considered within the category of not susceptible, being better to use other antibiotics, if possible.
The assay could be expanded and optimized to other microorganisms with the ability to change morphology as a result of the induction of the SOS or SOS-like response. Moreover, monitoring of cell morphology may be easily automated since length measures are incorporated in many basic routines of image analysis or even by using flow cytometry or microfluidics, reducing hands-on time. Software for measuring cell length is not strictly necessary. Under the optimal technical conditions previously established, cell length changes are outstanding and a rapid and simple visual inspection of the slide clearly allows to establish whether there is a variation or not in comparison with the controls. The software only helps to quantify this length accurately. Although the test could be performed on raw samples that are incubated with a range of doses from the different antibiotics, a rigorous assay requires that the pathogens be first isolated and identified. This is because the optimal breakpoint dose may be different for different species and antibiotics, similar to the standard antibiogram. Moreover, besides the clinical sample, simultaneous processing of control reference susceptible and resistant strains from the correspondent bacterial species enhances the confidence of the assay.
The prevention of the MMC-induced elongation assay has a potential clinical value since rapid identification of resistant strains may avoid treatment failure and decrease healthcare costs. Moreover, the assay in the present study may help to prevent the spreading of dangerous resistant pathogens by misuse of antibiotics and preserve last-option antibacterial drugs.
Footnotes
Acknowledgments
The authors are grateful to Michael E. Kjelland for revision of the article. This work was supported by the Fondo de Investigaciones Sanitarias (PI14/01346) and REIPI, Spanish Network for Research in Infectious Diseases (Instituto de Salud Carlos III, RD12/0015/0014). This work was also funded by IMI 6th call COMBACTE New Drugs 4 Bad Bugs (ND4BB).
Disclosure Statement
J.G. and J.L.F. are advisers of Halotech DNA SL. All other authors declare no conflicts of interest.