
Abstract
Acinetobacter baumannii is a nonfermenting Gram-negative bacillus. A. baumannii resistance is a significant obstacle to clinical infection treatment. The existence of persister cells (persisters) might represent the reason for therapy failure and relapse, and such cells may be the driving force behind rising resistance rates. In this study, A. baumannii ATCC 19606 was used as a target to explore the essential features of A. baumannii persisters. Antibiotic treatment of A. baumannii cultures at 50-fold the minimum inhibitory concentration resulted in a distinct plateau of surviving drug-tolerant persisters. The sensitive bacteria were lysed with ceftazidime, and the nonreplicating bacteria were isolated for transcriptome analysis using RNA sequencing. We analyzed the transcriptome of A. baumannii persisters and identified significantly differentially expressed genes, as well as their enriched pathways. The results showed that both the GP49 (HigB)/Cro (HigA) and DUF1044/RelB toxin/antitoxin systems were significantly increased during the persister incubation period. In addition, the activities of certain metabolic pathways (such as electron transport, adenosine triphosphate [ATP], and the citrate cycle) decreased sharply after antibiotic treatment and remained low during the persister period, while aromatic compound degradation genes were only upregulated in persisters. These results suggest the involvement of aromatic compound degradation genes in persister formation and maintenance. They further provide the first insight into the mechanism of persister formation in A. baumannii.
Introduction
A
Persister cells only remain in the persister state in the presence of an ecological stress; they shift back to their previous antibiotic-susceptible state as rapidly as the pressure decreases. When a bacterial population is challenged with an antibiotic, regular cells rapidly die, but persisters survive because of their noted dormancy, which results in no increase in the number of these cells.7,11 The tolerance to antimicrobials displayed by these persisters is defined to be nongenetic, because their progeny do not display different resistance than the original population and do not gain any additional genetic machineries or target gene mutation(s).12–14 This tolerance might be associated with nutrient limitation, because when nutrients are added, quorum sensing (which affects the shift to the persister phenotype) is diluted, and the bacterial cells start to grow. 15 It is difficult to study the persister phenotype because of the frequently changing state of these cells and the very small subpopulation that are persisters, which makes their recognition under the microscope or by culturing relatively challenging. Hence, understanding the persisters' nature and their machineries of drug tolerance has remained an issue.7,12,14,16
Herein, we describe A. baumannii persister formation and persister transcriptome analysis using high-throughput sequencing of complementary DNAs (cDNAs; Illumina RNA-seq) to study the differential gene expression of A. baumannii during persister formation. We used RNA-seq strategies to examine the effects of antibiotic treatment on persisters. Compared to previous sequencing methods, RNA-seq provides far higher coverage and greater resolution of the dynamic nature of the transcriptome. Our results provide the first insight into the formation mechanism of persisters in A. baumannii. In addition, to understand the related molecular mechanisms, we explored the association of five types of type II toxin/antitoxin (TA) modules with persister formation.
Materials and Methods
Culture conditions and growth phases
A. baumannii ATCC 19606 was a generous gift from the China General Microbiological Culture Collection Center. Luria-Bertani (LB) medium (Sigma-Aldrich Ltd., Shanghai, China) was used to culture A. baumannii. Standard curves were established for A. baumannii ATCC 19606, and bacterial growth was determined every hour by measuring the optical density at 600 nm (OD600).
Minimum inhibitory concentration
The MIC was examined for 13 different antibiotics selected for use in this study, based on the broth microdilution method. 17 Antibiotic sensitivity was determined with reference to the Clinical and Laboratory Standards Institute (CLSI) standards and the MIC of each antibiotic. 18 The plates were assessed in a microplate reader to determine the OD600 before incubation for 24 h at 37°C. The results were visually scored after incubation, and the results were also measured by OD600.
Antibiotic killing study
Freezer stocks of A. baumannii ATCC 19606 were diluted 1:100 into LB broth and cultured overnight. The overnight cultures were diluted 1:100 and grown to mid-log phase to an OD600 of 0.240 (∼107 colony forming units [CFU]/mL). Antibiotics were added at the chosen concentrations (5, 10, 20, and 50 × the MIC value), and the cultures were incubated in the 37°C shaker for 24 h. At the selected time points, samples were taken, washed, serially diluted, and plated for CFU counting. All tests were performed in triplicate.
Isolation of persisters
Persisters were isolated based on the method described previously.8,9 Briefly, an overnight culture was diluted 1:100 in 200 mL LB broth and cultured to mid-log phase at an OD600 of 0.240. The total bacterial culture was divided into four 50-mL portions in 200-mL baffled flagons, and 10 mL of the culture was removed from each flagon and pooled to offer a baseline (t = 0 and labeled as P0). Ceftazidime (CAZ) was then immediately added to each flagon at a final concentration of 200 μg/mL (50 × MIC). At 1, 3, 5, and 7 h after the challenge with CAZ, the cultures were washed with phosphate-buffered saline, and the remaining persister cells were calculated by plating for colony counts using the standard pour plate method on LB agar. These time points were termed P1–P7. Persisters isolated from the P7 time point were recultured in fresh LB and incubated at 37°C on a rotary shaker (150 g); the OD600 was measured after 1, 3, 5, 7, and 9 h (these time points were termed E1–E9). This procedure was repeated four times, and all experiments were performed with three replicates.
RNA extraction, library construction, and sequencing
Total RNA was isolated from cells of previous sampling points using an RNeasy Mini Kit (QIAGEN GmbH) according to the manufacturer's instructions. All procedures for RNA sequencing and alignment of the transcriptome were conducted by the Beijing Berry Genomics Co., Ltd. (Beijing, China). The RNA was exposed to a subtractive hybridization-based ribosomal RNA (rRNA) removal procedure using a MICROB Express Bacterial mRNA Enrichment Kit (Ambion®, Beijing, China). Subsequent processes, including the construction of the library, were performed as previously characterized. 19 RNA sequencing was performed with two runs of Illumina HiSeq 2500 V4 (T) PE125 sequencing, using the “paired-end” strategy. A. baumannii ATCC 19606 genome annotation information and sequencing were downloaded from the National Center for Biotechnology Information (NCBI) database for comparative genome analysis. Read mapping was performed with Bowtie2, and the gene expression intensity was measured in fragments per kilobase of transcript per million mapped sequence reads (FPKM). 20 The differentially expressed genes were identified using Cuffdiff 2. The obtained expression (FPKM) values of 10 samples of each gene were compared between two different samples and were termed as differentially expressed if the p-value of the difference was <0.05. Mapped reads were visualized using the BamView and Artemis programs. 21 Genes that displayed a fold change >2.0 and <0.5 in this analysis were considered as upregulated and downregulated genes, respectively.
Principal-component analysis was performed in CLC Genomics Workbench 4.0 (CLC Bio), and the arrays' hierarchical clustering was achieved in MATLAB. Heat maps were drawn in Excel, and time course gene clustering was performed in MATLAB. The datasets generated and analyzed during the current study are available at the NCBI (www.ncbi.nlm.nih.gov//bioproject/PRJNA339887) Sequence Read Archive (SRA) under Accession number SRR4101825, 26, and 29–36, respectively.
Real-time polymerase chain reaction quantification
Real-time polymerase chain reaction (PCR) was used for experimental verification and to assess changes in the expression of type II TA systems during persister formation. Isolated RNA was subsequently reverse-transcribed into cDNA for A. baumannii samples from 10 different time points. Real-time PCR amplification of the 16S rRNA gene used the universal primers UNF: 5′-GAGTTTGATCCTGGCTCAG-3′ and UNR: 5′-GGACTACCAGGGTATCTAAT-3′. 22 Three aromatic compound degradation genes (benA F: GACCCAACTGACGCAGGTTA, R: CAAGCGAAGGAACATCGGGA; catA F: TTAGGCCGTCATGGTAACCG, R: AACCGTCACGAGTAGCGAAG; and pcaB F: TGTGGGTTCGTTGGCTTCAT, R: CATCTTGCCCGTATTCCCGA), in addition to five TA system gene fragments (GP49 [HigB]/Cro [HigA], DUF1044/RelB, HTH [cheT]/GNAT [CheA], hipA/hipB, and HTH2/GNAT2) were chosen 23 and subjected to real-time PCR amplification. Each amplification was performed in triplicate using specific reaction conditions as follows: 95°C for 10 min; 40 cycles of 95°C for 30 s and 60°C for 30 s; for the melting curves: 95°C for 15 s, 60°C for 1 min, and 95°C for 15 s. The software from the 7300 system was used to analyze the results.
Statistical analysis
KOBAS 2.0 (http://kobas.cbi.pku.edu.cn/home.do) was used to perform pathway enrichment analysis of differentially expressed genes. The quantitative results for the A. baumannii 16S rRNA and type II TA system genes were analyzed using Student's t test, with a p-value ≤0.05 indicating significant differences.
Results
A. baumannii antibiotic resistance spectrum
Before studying A. baumannii persister formation, we selected 13 representative antibiotics to study their MIC values. Supplementary Table S1 (Supplementary Data are available online at www.liebertpub.com/mdr) shows that A. baumannii was resistant to ampicillin (AMP) and cefepime (CPM), had intermediate resistance to cefotaxime (CTX) and ceftriaxone (CTR), and was susceptible to the other nine antibiotics.
Persister growth state level and related antibiotics
Six different classes of antibiotics were selected to investigate the presence of persister cells in A. baumannii culture. Bacterial eradication commonly follows two stages comprising a quick and high death rate of the bulk of the population, followed by a decreasing killing rate of a higher tolerant subpopulation. In all samples examined, the killing rate was reduced after 1–3 h, and the persister levels were slightly decreased after 5 h (Fig. 1).
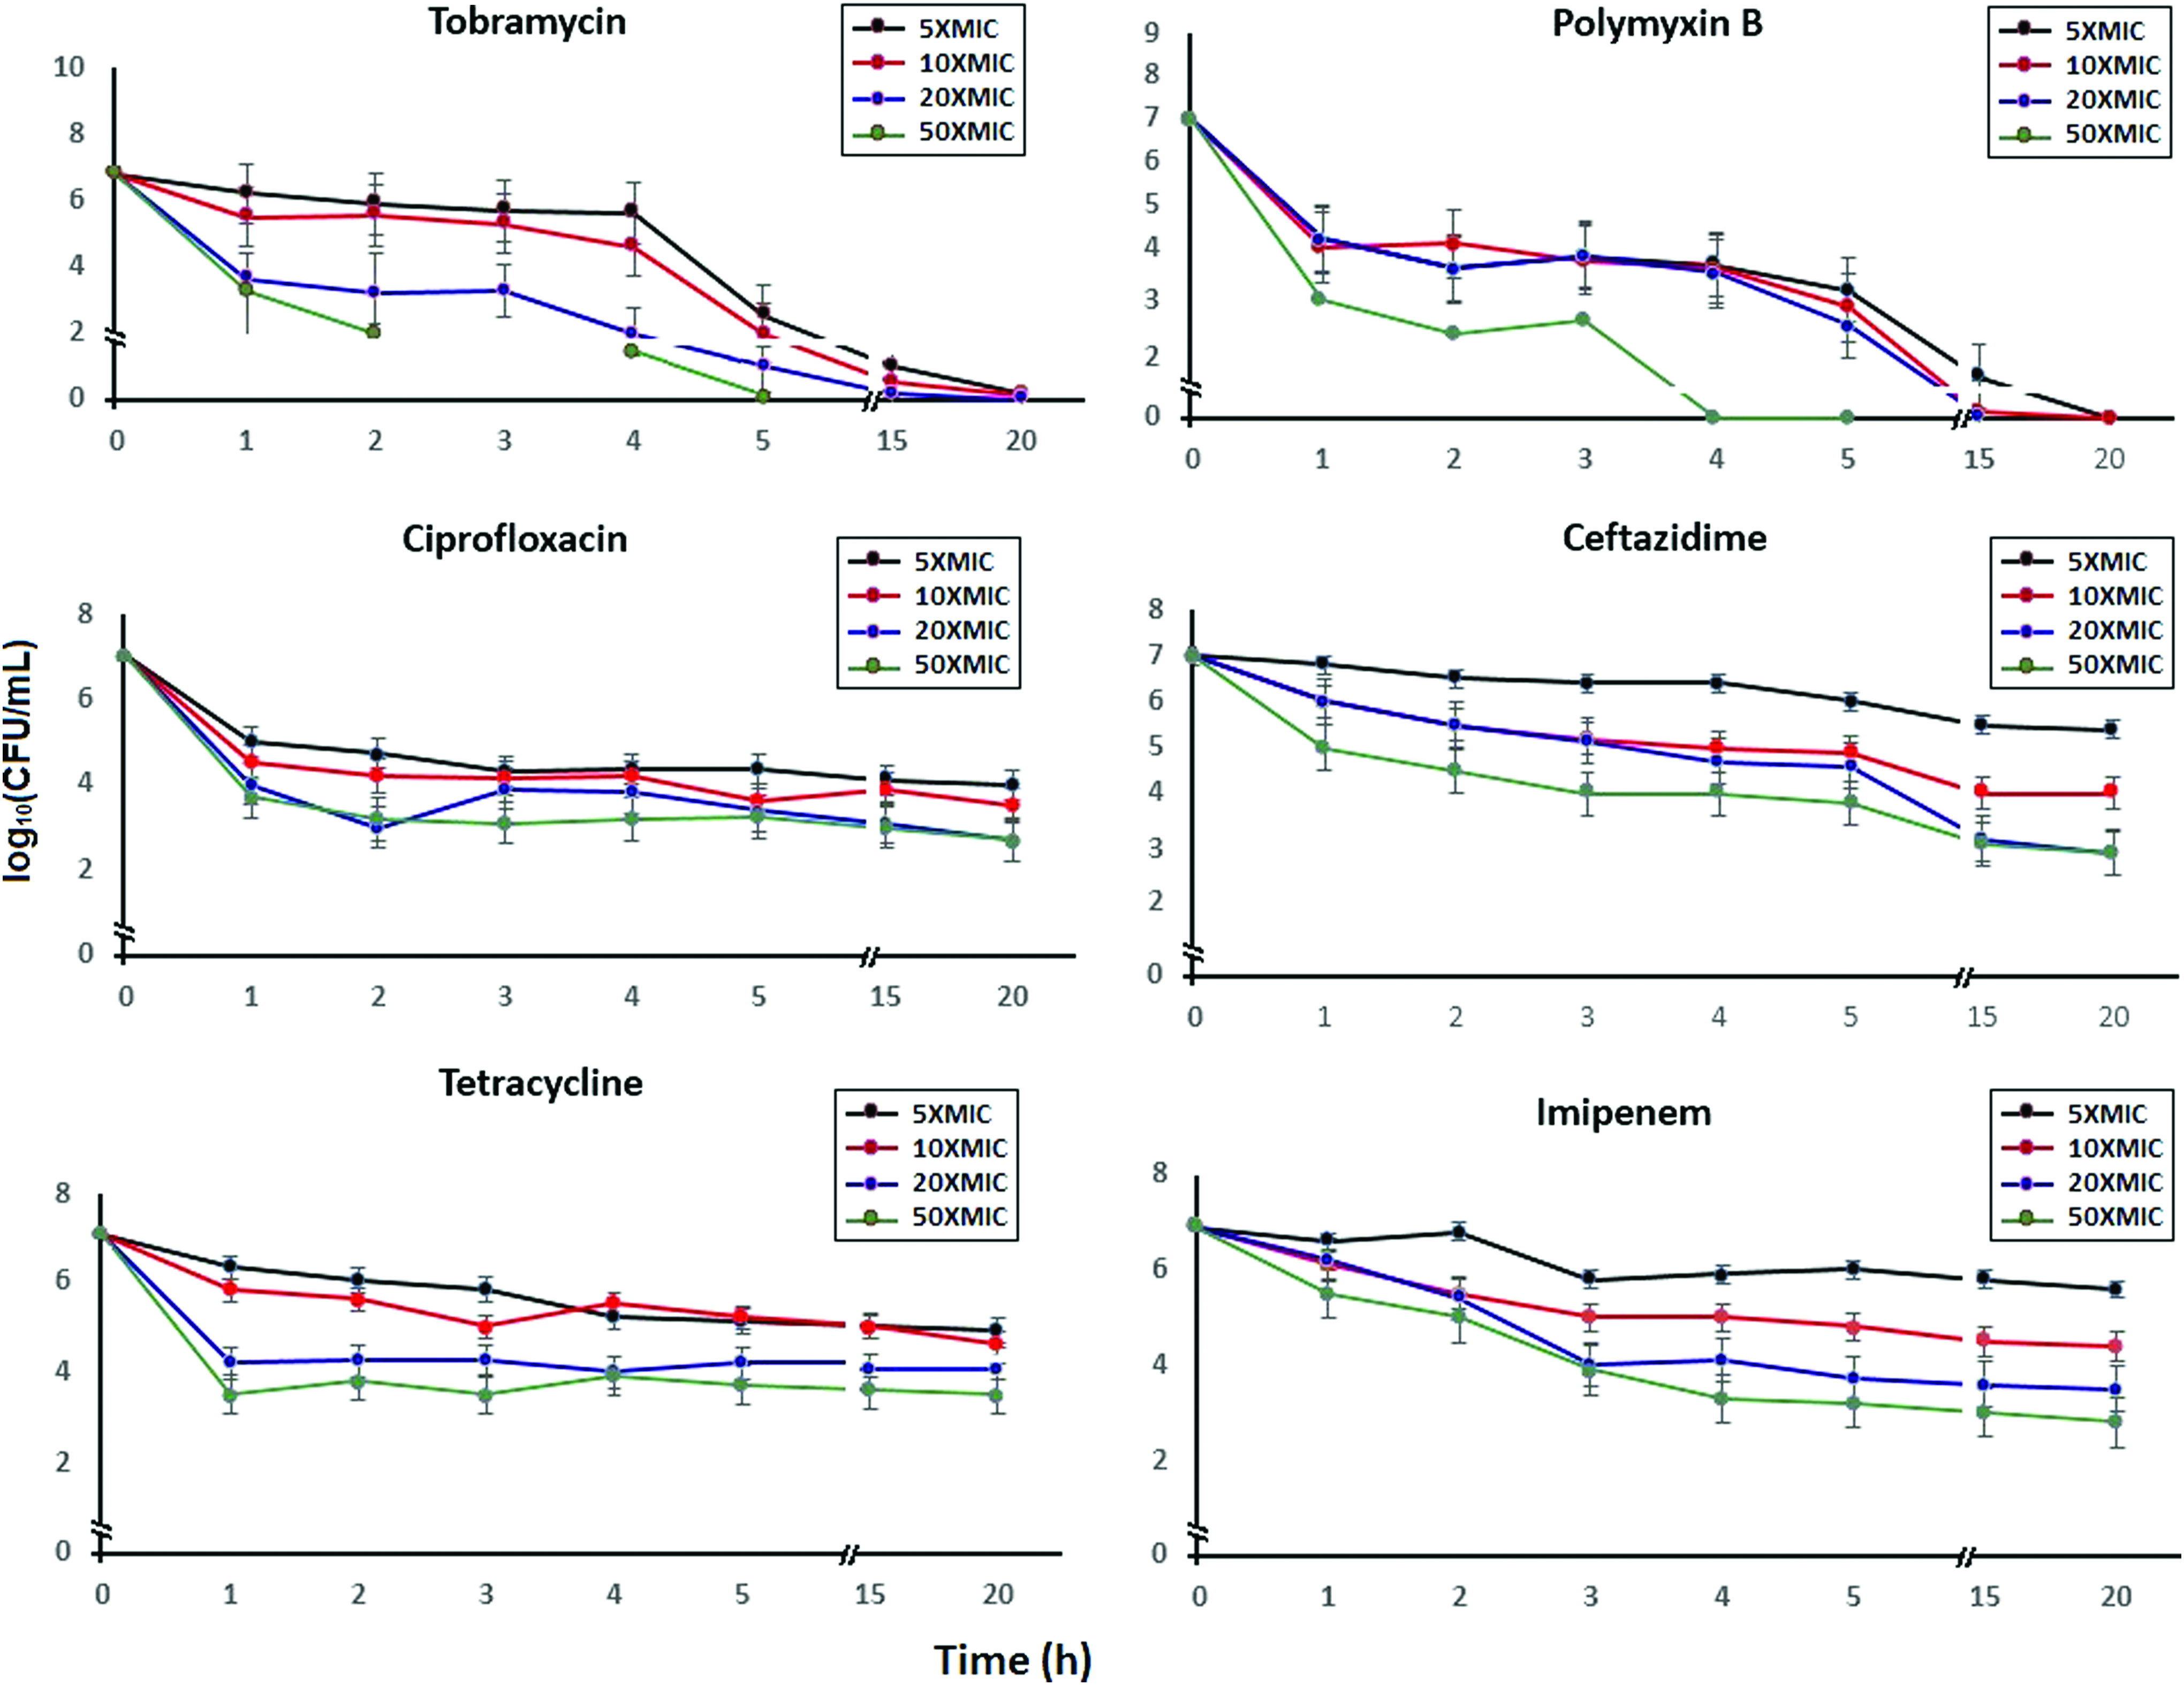
Killing of Acinetobacter baumannii ATCC 19606 by different concentrations of antibiotics (5, 10, 20, and 50× MIC). The standard deviation for three replicates is shown. MIC, minimum inhibitory concentration. Color images available online at www.liebertpub.com/mdr
These results indicated that A. baumannii, like all other tested bacterial species, contains a subpopulation of persisters. Antibiotics need active targets to eradicate cells, 24 and the markedly good persistence of A. baumannii cells suggested that they are dormant. After treatment with CAZ, the persister concentrations were 10−4.0, 10−4.5, 10−5.5, and 10−6.0 CFU. As the processing time was extended to 20 h, the persister level was maintained at the abovementioned values (Fig. 1). Similarly, using different concentrations of imipenem, tetracycline, and ciprofloxacin, bacterial killing reached a plateau after a certain time, and the final concentration of antibiotic that maintained the presence of persisters varied. Only tobramycin or polymyxin B treatments were not fully compliant with the trend of a two-phase type curve for bacterial killing: the curves displayed a rapid decline in the first 4 h after treatment, indicating that these two agents were able to kill all bacteria and sterilize the A. baumannii cultures.
Persister isolation and transcriptome profile analysis
To identify candidate persister genes, we obtained a profile of expression from the persisters. CAZ is effectively able to lyse the bacterial cells, and we selected this agent for isolation of persisters. 25 Cells died quickly after the challenge with CAZ, and within 5 h, only persister cells survived (Fig. 2). Three additional repeats of this process failed to enhance the persisters and exhibited essentially the same pattern as the original population, demonstrating that persistence was not genetic, at least under these experimental conditions. The concentration-dependent increase in killing leveled off at 200 μg/mL, indicating that this was a suitable concentration for the isolation of persisters.

Killing of A. baumannii by CAZ at a final concentration of 200 μg/mL (50× MIC). Viable count (CFU/mL) results of the 10 time points are shown. The time points at 1, 3, 5, and 7 h after the addition of CAZ are labeled as P1, P3, P5, and P7, respectively, while the reculture time points of persisters at 1, 3, 5, 7, and 9 h are labeled as E1, E3, E5, E7, and E9, respectively. Samples for RNA collection were isolated at these time points. CAZ, ceftazidime; CFU, colony forming units.
A total of 10 samples were subjected to RNA-seq. On average, 4,416,570 paired-end raw reads with a length of 125 bp were obtained for each sample. After filtration, 3,779,155 reads were mapped to the genome, with an average matching rate of 87.8%. The sequencing data for the 10 RNA samples can be found in Supplementary Table S2. The total amount of sequencing data obtained revealed that the sequencing depth for the P0–E9 samples was between 300 and 400 × . Through cluster analysis, we were able to directly observe the differences for all of the genes from the 10 different time points during persister formation and the recovery process (Fig. 3).

Statistical analysis of the number of genes with two- or fourfold differences in expression in these 10 time points showed that (P1) genes changed rapidly in the first hour after antibiotic treatment; the maximum number of genes with altered expression was found during this phase (Fig. 3). With longer exposure to the antibiotic, the number of genes with differential expression between this time point and the previous time point gradually decreased. After the removal of antibiotics, persisters could be restored to growth and to normal susceptibility in fresh medium. A 5-h latency period was required if the cells were subcultured at a ratio of 1:10. During the period between P7 and E1, the number of genes upregulated by two- and fourfold were 300 and 58, respectively, and 405 and 73 genes were downregulated by two- and fourfold, respectively. There were fewer differentially expressed genes within the latency phase; during the E1–E3 phases, the number of twofold upregulated and downregulated genes was 163 and 134, respectively. The number of fourfold differentially expressed genes was even lower (26 and 51, respectively) (Fig. 4). The number of genes with differential expression began to increase after 5 h of restorative culture, which presumably reflected the induction of metabolic pathway genes during the rapid growth phase.
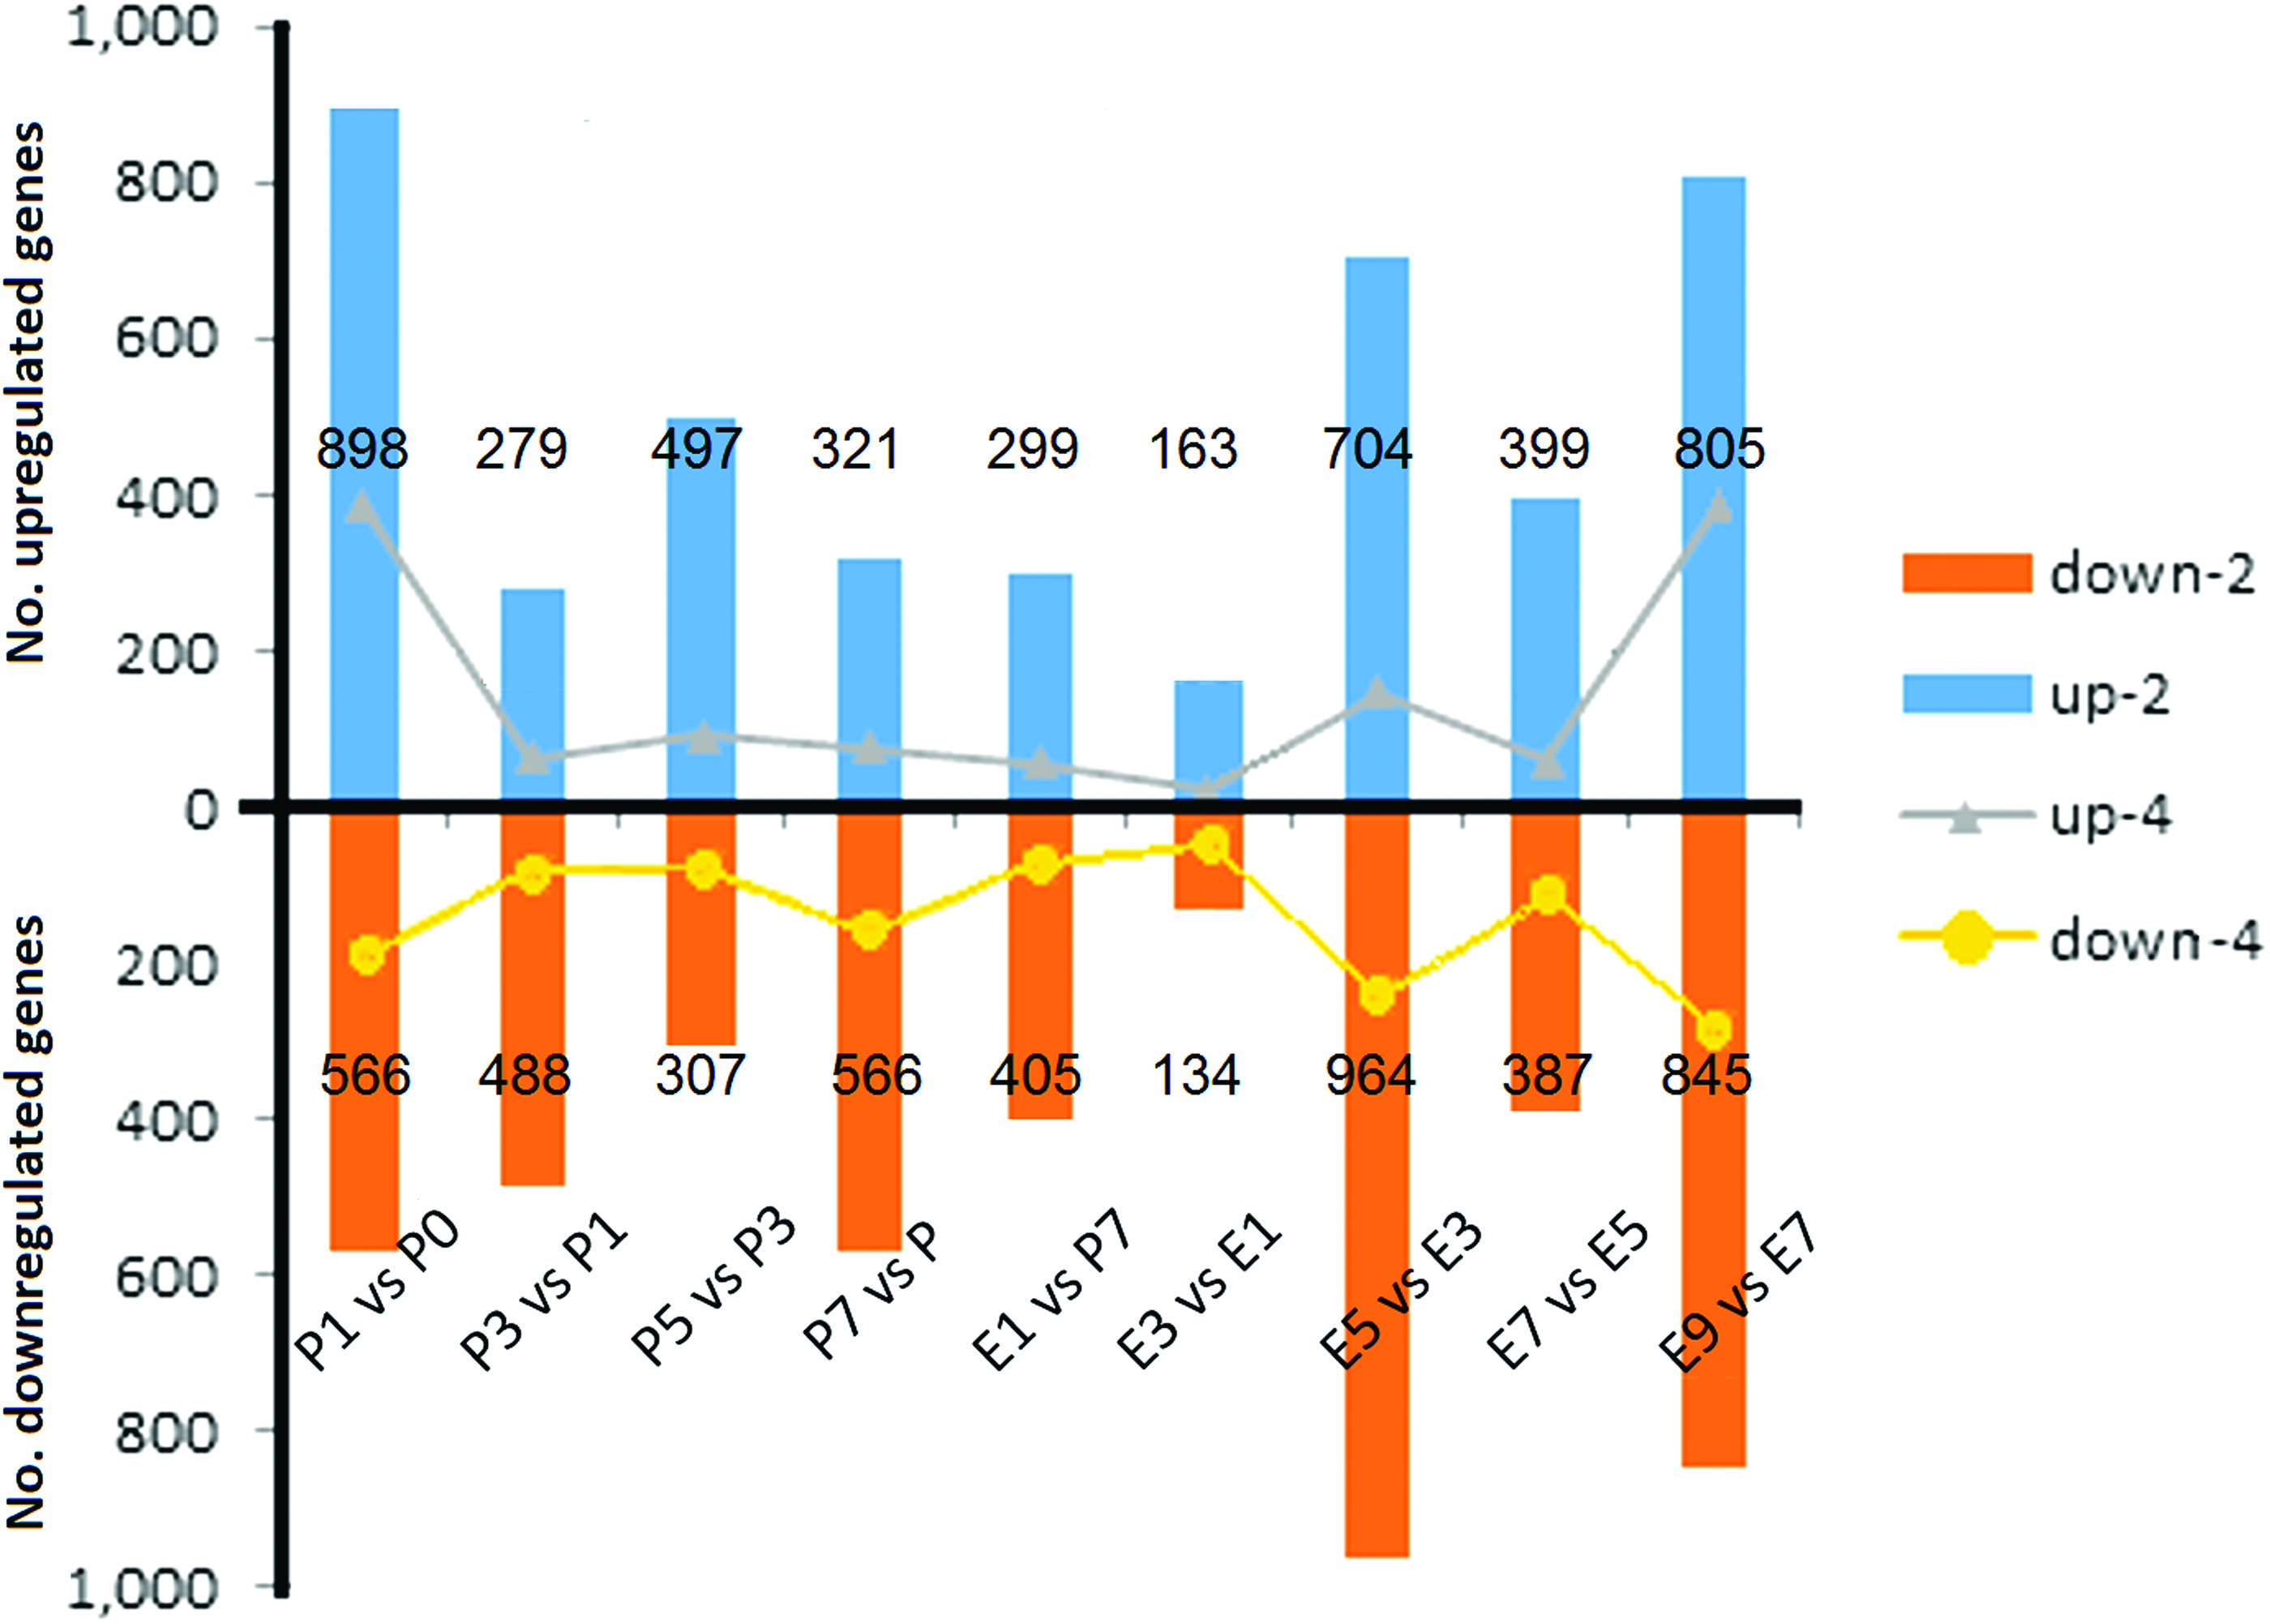
The numbers of differentially expressed genes in the 10 samples. The numbers of these genes were compared between two samples among the 10 time points (from P0 to E9). Color images available online at www.liebertpub.com/mdr
Kyoto encyclopedia of genes and genomes (KEGG) enrichment analysis is based on pathway analysis using hypergeometric statistical methods. We summarized the pathways that were enriched with differentially expressed genes between time points at 1, 3, 5, and 7 h after antibiotic treatment (P0) and the time points at 0, 3, 7, 9, 10, and 11 h after restoration of the bacterial cultures (E1), as well as between the phase of persisters (P7) and the phase of restored bacterial cultures (E1). We found that the pathways associated with the differentially expressed genes were mainly concentrated in the following categories: carbohydrate metabolism, energy metabolism, lipid metabolism, amino acid metabolism, nucleotide metabolism, cofactor and vitamin metabolism, xenobiotic biodegradation pathways, and terpenoids and polyketone metabolism (Supplementary Table S3). The ribosome metabolic pathway showed expression at all time points measured, with the exception of E1. Many metabolic pathway factors displayed varied expression during the 10 time points studied, and xenobiotic biodegradation pathways existed in the formation of persisters most of the time.
Hierarchical clustering analysis
Clustering analysis can classify genes with similar expression trends during an entire process as a class, from which one can identify genes consistent with a desired trend, such as those upregulated in persister stages P5–E3 or downregulated in the nonpersister stage. To further identify specific genes expressed only in the persister stage, we performed hierarchical clustering analysis of the 943 genes with twofold higher expression in the persister compared with the nonpersister stage. The analysis identified three clusters (5, 6, and 8) comprising 38 genes that were highly expressed after 5 h (P5) of antibiotic treatment and were downregulated during the transformation from persisters into sensitive bacteria (Fig. 5). In addition, one cluster (9) with the highest gene expression at 7 h after antibiotic treatment and another cluster (1) with the highest gene expression in latency stage E1 that were downregulated during the transformation from persisters into sensitive bacteria were also identified. To detect genes particularly expressed in the P5 period, we achieved hierarchical clustering of the genes that were specifically expressed in persisters (Fig. 5). Table 1 shows the information on these genes.
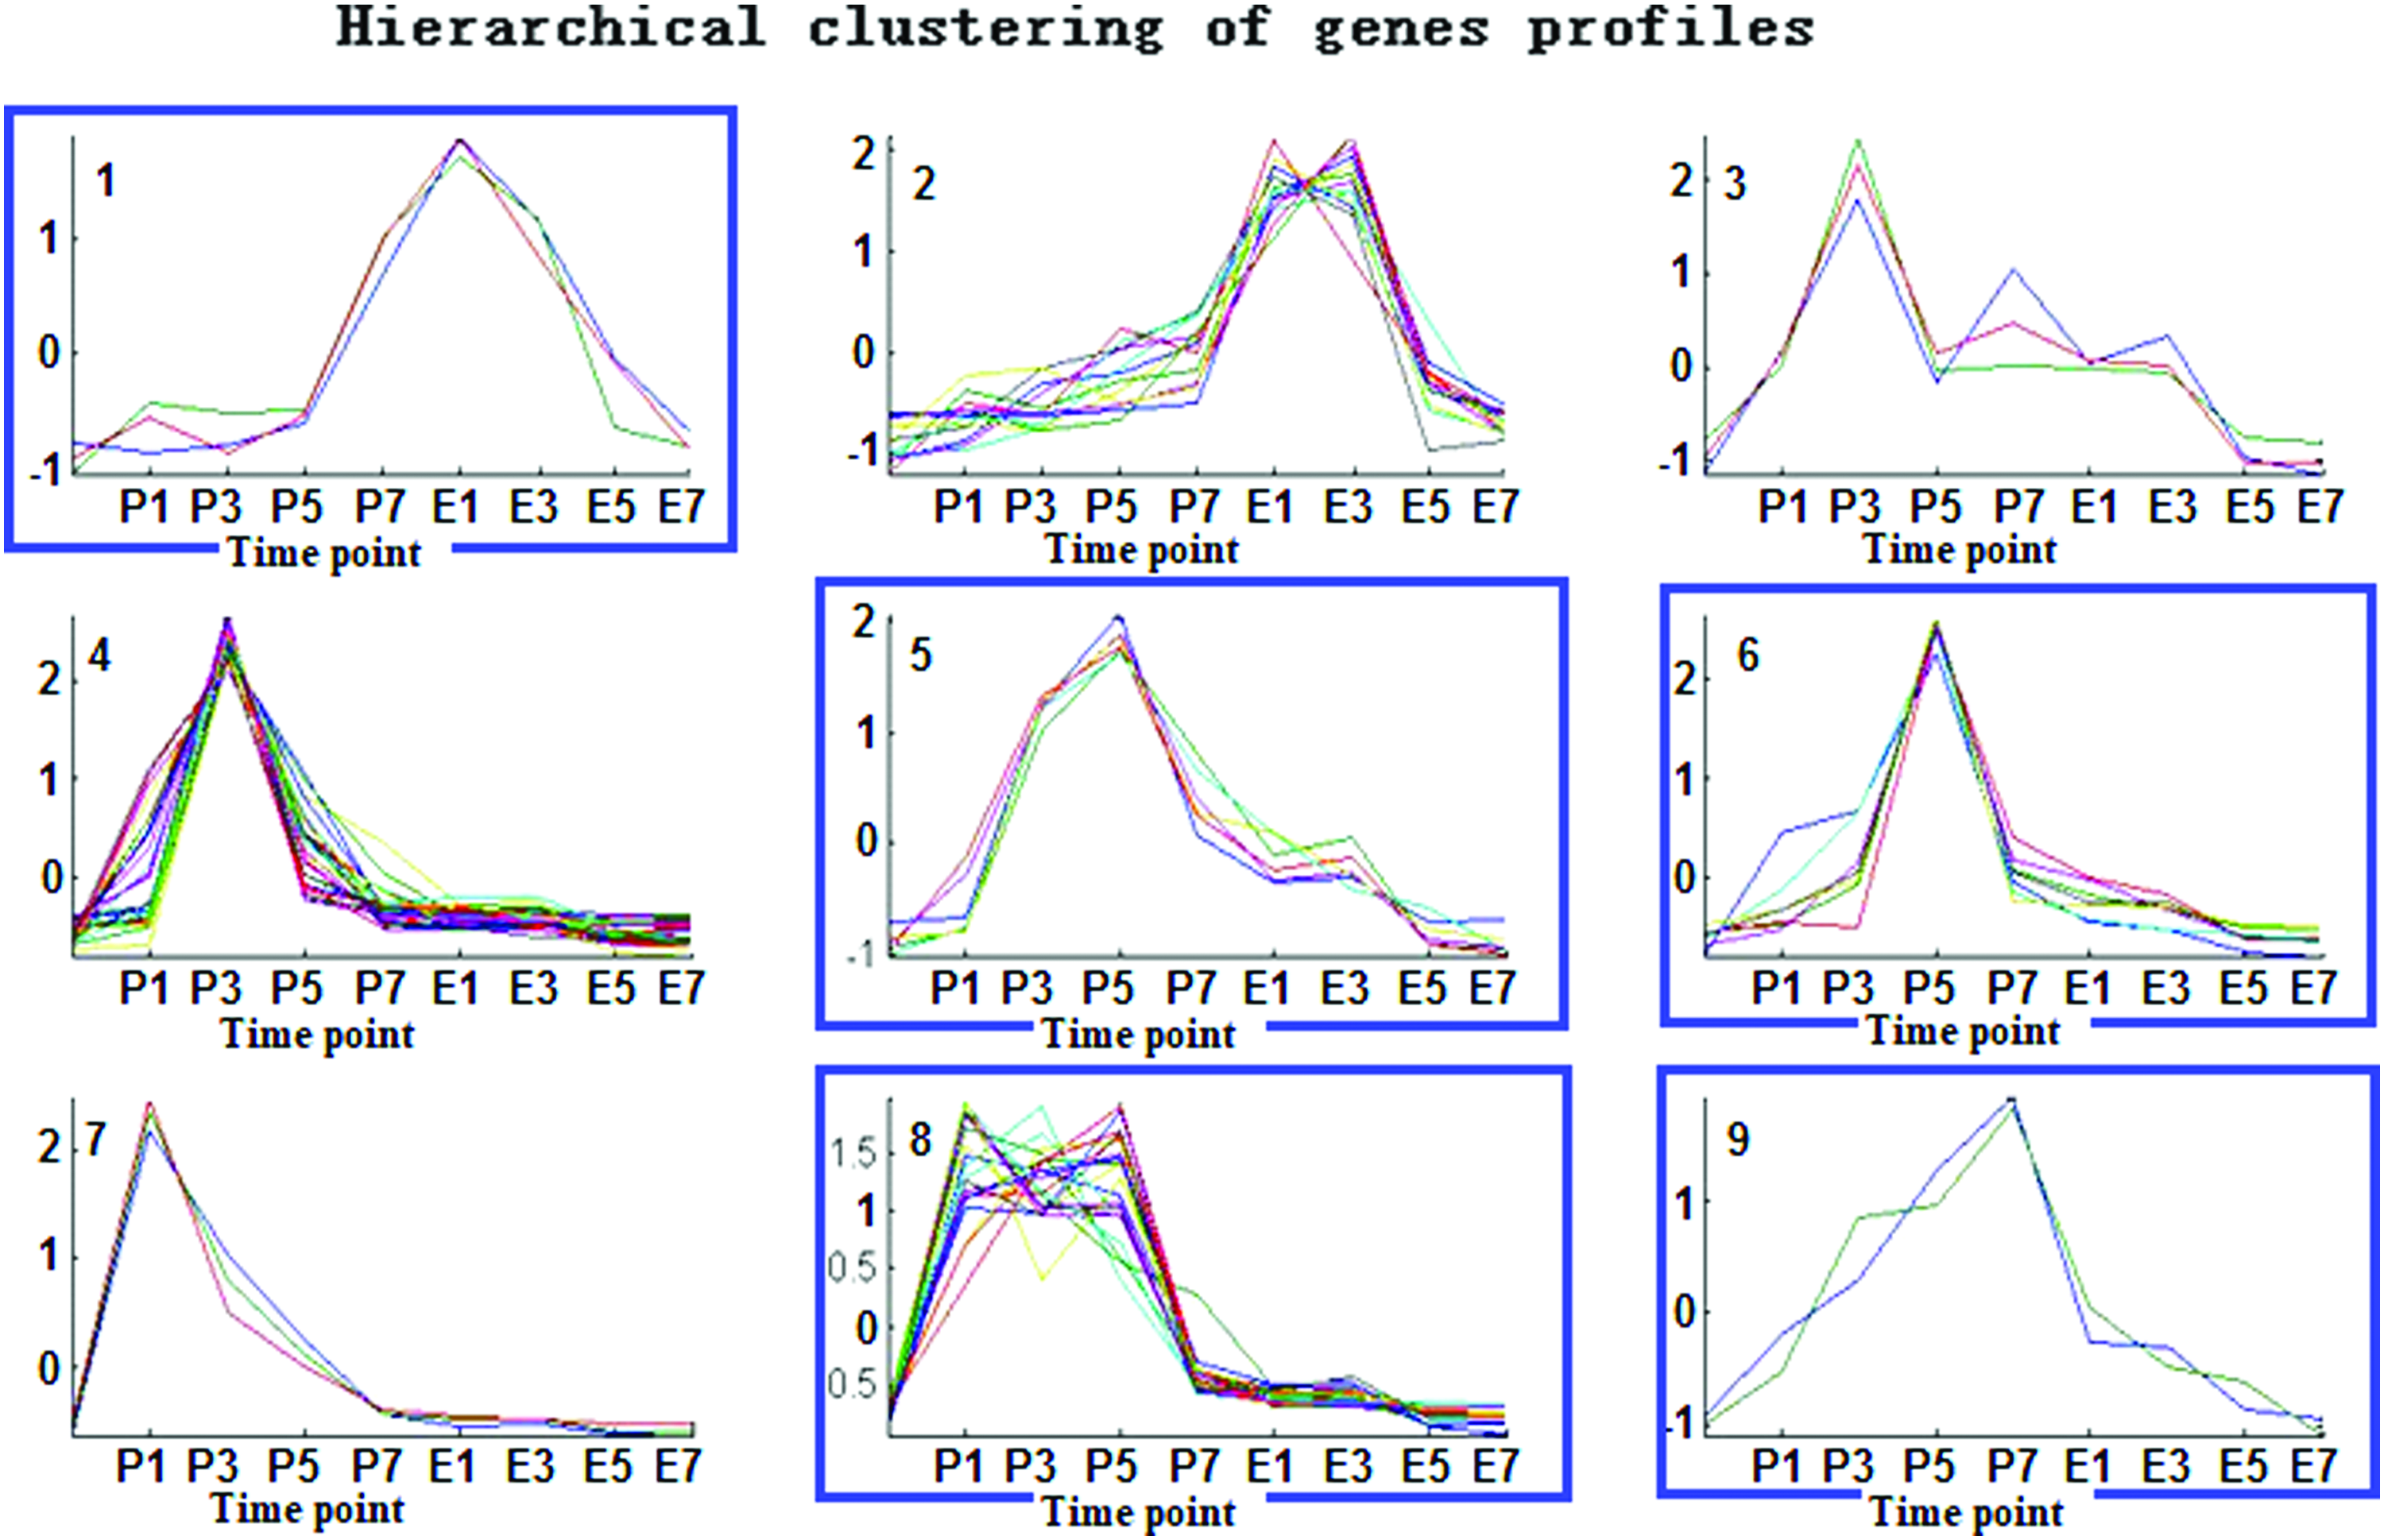
Overexpressed gene hierarchical clustering in persisters during the P0–E7 periods (p ≤ 0.01). Each line in the clusters refers to one gene profile. Clusters 1, 5, 6, 8, and 9 (marked in blue) correspond to genes that were particularly overregulated in persisters. Color images available online at www.liebertpub.com/mdr
Genes That Were Upregulated in Persisters but Downregulated in Nonpersisters
These genes are thought to support the formation and maintenance of persisters; they include genes associated with the electron transport chain, aldehyde dehydrogenase, protein signal peptide, mercury ion transfer enzymes, and hypothetical proteins. Our results revealed that the expression of components of the adenosine triphosphate (ATP) synthase was sharply decreased after antibiotic treatment, remained low during the persister period, and then started to increase at the E5 stage (Supplementary Fig. S1). Genes associated with biodegradation pathways of aromatic compounds were only expressed in the persisters, and this was in line with the quantitative results of real-time PCR (Supplementary Table S3 and Fig. 6).

TA systems and their relationship with persister bacteria formation
The expression of genes associated with TA systems GP49 (HigB)/Cro (HigA) and DUF1044/RelB was significantly increased in the persister incubation period (P5–E3) (Supplementary Fig. S2a). This result was consistent with the real-time PCR results (Supplementary Fig. S2b). Therefore, the two TA systems may be involved in persister formation. By contrast, the genes of the hipA/hipB TA system were increased during the E5–E7 period. However, the expression of genes in the HTH (cheT)/GNAT (CheA) and HTH2/GNAT2 TA systems was low during the entire process of persister formation, suggesting that these genes are not associated with persister formation.
Discussion
A. baumannii has become a very important hospital-acquired pathogen. A. baumannii has been identified as resistant to most antibiotic classes, including fluoroquinolones, aminoglycosides, and third generation cephalosporins. Thus, successful treatment of such infections is very difficult due to this multidrug resistance.1,26 This problem has been noted in other bacterial species as well, including Escherichia coli,8,9,27 Pseudomonas aeruginosa,11,28,29 Staphylococcus aureus, 30 and Mycobacterium tuberculosis. 31 Nutrient limitation and antibiotic treatment are major causes that reduce the growth rate of cells in culture, and during the limitation of nutrients or challenge with antibiotics, the bacteria may reduce their growth rate and become dormant.32–34 After antibiotic challenge, most cells in a bacterial population are killed, whereas at least two subpopulations (viable but nonculturable [VBNC] cells and persister cells) survive. Persister cells survive in the presence of antibiotics and shortly regrow on antibiotic-free media,24,35 while VBNC cells may regrow only after a long and specific treatment. 36 Therefore, VBNC cells are hard to isolate and study by standard microbiology examinations.8,12 As with other studies, we noted that different antibiotics produce a characteristic two-stage killing of A. baumannii cells in a time-dependent manner. These data clearly indicate the presence of drug-tolerant persisters. A similar behavior was observed in a study of A. baumannii killing in an in vivo mouse model. 37
The level of persistence is related to the antibacterial concentration used. If the cells are already in a dormant state at the time of treatment, the persister cells will generally be resistant to all antibiotics that act metabolically. This state is maintained until the conditions are changed and the cells are cultured in antibiotic-free medium. Then, the cells will switch out of the persister state and back to an antibiotic-susceptible state.13,15,38 Persistence of tolerant cells in a population challenged with an antibacterial agent during the P0–E9 time points suggested an easy process for their isolation. CAZ lyses normal A. baumannii cells, and persisters can be easily collected by centrifugation. These persisters were then used to produce a persister transcription profile using an RNA-seq array. The RNA-seq results revealed that the A. baumannii cells grown in the antibiotic-treated medium had many genes that were up- or downregulated during the experiment compared to the control time point (P0). This experiment was performed in an attempt to identify up- or downregulated genes that contribute to the survival of the treated cells. Genes associated with energy metabolism, lipid metabolism, amino acid metabolism, nucleotide metabolism, vitamin metabolism, and other metabolic pathways were diversely expressed during the 10 time periods examined. A decline in ATP levels would decrease the activity of ATP-dependent antibiotic targets, such as RNA polymerase, topoisomerase, and gyrase, leading to antibiotic tolerance, and ATP was previously suggested to affect survival from antibiotics. 39 The recognition and understanding of the genes related to the formation of persisters, as well as the genes involved in bacterial metabolism, may help to gain an understanding of other dormant circumstances, like VBNC bacteria, for example. 13 Bacteria have complex regulatory networks to cope with environmental and metabolic changes. Bacteria are usually exposed to a mixture of carbon sources such as glucose. In Gram-negative bacteria belonging to the genera Pseudomonas and Acinetobacter, organic acids have a central role as chosen carbon sources. However, our understanding of the molecular mechanism underlying this phenomenon is incomplete.40,41
In Acinetobacter species, carbon catabolite repression affects the expression of the pca-qui operon, the pob operon, and the van genes.42,43 The pca genes are part of the β-ketoadipate pathway (comprising two categories, starting with protocatechuate or catechol), which allows the bacteria to use a wide range of aromatic compounds. 44 Benzoate (benABC genes encoding benzoate dioxygenase) and anthranilate (antABC genes encoding anthranilate dioxygenase) are independently converted to catechol, permitting additional degradation to proceed through the β-ketoadipate pathway. 43 In this study, pathways mediating the biodegradation of aromatic compounds were only active in the persisters, suggesting that they may be related to the formation and maintenance of persisters. It is possible that the degradation of aromatic rings in antibiotics could be utilized by A. baumannii under conditions of nutrient limitation.
The A. baumannii transcriptome revealed several genes with upregulated expression; TA modules, which are associated with slow growth or cell dormancy, were previously identified.7,45 However, we were mainly concerned to know if any TA modules were expressed in A. baumannii persisters. Overproduction of hipA causes a large increase in the population of persisters, suggesting that hipA may be the first detected persister gene.8,46 However, our results revealed that there is no simple relationship between the levels of hipA/hipB and A. baumannii ATCC 19606 persisters. In addition, we identified two TA systems, GP49 (HigB)/Cro (HigA) and DUF1044/RelB, that were active in A. baumannii persisters during the latency period (E1–E3). This result is consistent with the results of real-time PCR assays. Once persisters are collected, RNA can be isolated and used for expression profiling. Genes that are known to be downregulated in the persisters include those associated with the production of energy and synthesizing flagella. 47 Bacterial persister formation is affected by a complex regulatory network, and those genes that are upregulated in persisters can be chosen as reporters to detect naive persisters before challenging with antibiotics. A transcriptome study of these naive persisters would demonstrate the expression profile changes caused by the presence of an antibacterial agent. Our study indicated that persisters of A. baumannii are in a dormant state and express a small group of genes, which require more study to understand their roles in persister formation. It is worth noting that many of the identified genes have unknown functions (15% of the genes encode hypothetical proteins), and further study is required to determine their relationship with persisters. Future studies of the role of aromatic degradation and ATP levels in the recalcitrance of A. baumannii infection should also be performed, and aromatic degradation and the energy levels of cells in the course of infection may be a key factor in the failure or success of antibacterial treatment.
Footnotes
Acknowledgments
B.Z. was supported by the Beijing Municipal Natural Science Foundation (5152019). F.L. was supported by the Youth Innovation Promotion Association of the Chinese Academy of Sciences (2015069). B.Z., Y.H., and R.A. were supported by the National Basic Research Program of China (973 Program; 2015CB554200) and the National Natural Science Foundation of China (NSFC; 31601081, 81401701, 31750110479, and 31471203).
Disclosure Statement
All of the authors declare that they have no competing interests.
References
Supplementary Material
Please find the following supplemental material available below.
For Open Access articles published under a Creative Commons License, all supplemental material carries the same license as the article it is associated with.
For non-Open Access articles published, all supplemental material carries a non-exclusive license, and permission requests for re-use of supplemental material or any part of supplemental material shall be sent directly to the copyright owner as specified in the copyright notice associated with the article.