
Abstract
Enterobacter cloacae complex is a common cause of hospital outbreaks. A retrospective and prospective molecular analysis of carbapenem-resistant clinical isolates in a tertiary care center demonstrated an outbreak of a German-imipenemase-1 (GIM-1) metallo-beta-lactamase-producing Enterobacter hormaechei ssp. steigerwaltii affecting 23 patients between 2009 and 2016. Thirty-three isolates were sequence type 89 by conventional multilocus sequence typing (MLST) and displayed a maximum difference of 49 out of 3,643 targets in the ad-hoc core-genome MLST (cgMLST) scheme (SeqSphere+ software; Ridom, Münster, Germany). The relatedness of all isolates was confirmed by further maximum-likelihood phylogeny. One clonal complex of highly related isolates (≤15 allele difference in cgMLST) contained 17 patients, but epidemiological data only suggested five transmission events. The blaGIM-1-gene was embedded in a class-1-integron (In770) and the Tn21-subgroup transposon Tn6216 (KC511628) on a 25-kb plasmid. Environmental screening detected one colonized sink trap in a service room. The outbreak was self-limited as no further blaGIM-1-positive E. hormaechei has been isolated since 2016. Routine molecular screening of carbapenem-nonsusceptible gram-negative isolates detected a long-term, low-frequency outbreak of a GIM-1-producing E. hormaechei ssp. steigerwaltii clone. This highlights the necessity of molecular surveillance.
Introduction
E
The carbapenemase “German-imipenemase-1” (GIM-1), a metallo-beta-lactamase (MBL), is presently restricted to Germany. There have been reports of local and regional outbreaks of GIM-1-producing Pseudomonas aeruginosa and Serratia marcescens,14–16 and a report about the dissemination into the hospital environment. 17 Recently, GIM-1 emerged in the Enterobacteriaceae family and a continuous molecular surveillance of carbapenem-nonsusceptible Enterobacteriaceae at our institute revealed an ongoing sporadic appearance of GIM-1-producing E. cloacae complex. 18 To date, there have been few reports in the literature concerning GIM-1-producing E. cloacae complex.18,19 In this study, we report a long-term, low-frequency outbreak of GIM-1-positive E. cloacae complex isolates and describe the local epidemiology and the infection control measures applied in a German tertiary care center.
Materials and Methods
Setting
The Institute of Medical Microbiology and Hospital Hygiene in Düsseldorf (Germany) provides a diagnostic service for the University Hospital of Düsseldorf, a 1,200-bed tertiary care center.
Isolate collection, identification, and susceptibility testing
Collection of carbapenem-nonsusceptible (imipenem and/or meropenem) gram-negative bacteria started in 2007. From 2013 onward, with the change of susceptibility testing standards from Clinical and Laboratory Standards Institute to European Committee on Antimicrobial Susceptibility Testing (EUCAST), the more stringent recommendations for the detection of carbapenemases in Enterobacteriaceae (meropenem minimum inhibitory concentration [MIC] >0.12 μg/mL and/or imipenem MIC >1 μg/mL) were followed. 20 Identification was carried out using standard microbiological procedures, including the VITEK 2 system, and matrix assisted laser desorption/ionization time-of-flight mass spectrometry (bioMérieux, Germany). Antibiotic susceptibility testing was performed with the VITEK 2 system (AST-N248 and AST-N223; bioMérieux) for the following antimicrobial agents (ampicillin, ampicillin/sulbactam, piperacillin, piperacillin/tazobactam, cefotaxime, ceftazidime, cefepime, imipenem, meropenem, ertapenem, aztreonam, gentamicin, tobramycin, amikacin, ciprofloxacin, levofloxacin, sulfamethoxazole/trimethoprim, fosfomycin, and tigecycline). MICs were additionally obtained for meropenem and imipenem (MIC Test Strip; Liofilchem, Italy), and colistin (Micronaut microdilution MIC Strip; Sifin Diagnostics, Germany). EUCAST breakpoints (version 7.1, 2017) were used for interpretation.
Phenotypic and molecular detection of carbapenemases
Molecular carbapenemase detection was performed by real-time PCR (blaIMP-1, blaVIM-1-like, blaVIM-2-like, blaGIM-1, blaNDM, blaIMP-1-like, blaGES, blaKPC and blaOXA-48).18,21 Phenotypic testing was done by an MBL combination disc test using imipenem with and without ethylenediaminetetraaceticacid 16 and the modified Hodge test as previously described. 22
Conventional genotyping
Before the transition to next-generation-sequencing traditional genotyping was carried out (isolates from patient 1 to 18) with pulse-field gel electrophoresis (PFGE) (XbaI digest) and rep-PCR (DiversiLab; bioMérieux, Marcy l'Etoile, France) as previously described.15,18 In addition, multilocus sequence typing (MLST) was performed based on seven housekeeping genes. 23
S1-nuclease restriction and hybridization
S1-restriction and in-gel detection using a 32 P-radiolabeled blaGIM-1-probe were performed as previously described. 18
Conjugation experiments
Conjugation experiments were carried out by co-incubation of the blaGIM-1-containing Enterobacter isolates with the rifampicin-resistant and ampicillin-susceptible Escherichia coli C600 strain on selective media containing 100 mg/L ampicillin and 100 mg/L rifampicin. Visible colonies were subcultured on selective media and MacConkey plates, and colonies identified as Escherichia coli were further screened for blaGIM-1 by real-time PCR.
WGS analysis
WGS was performed on all 33 blaGIM-1-positive E. cloacae complex isolates.
Genomic DNA extraction, library preparation, and Illumina sequencing
For WGS, a single colony of each isolate was inoculated into lysogeny broth (LB) nutrient broth and incubated overnight. Genomic DNA was extracted with the DNeasy Blood and Tissue Kit (Qiagen, Hilden, Germany) following the manufacturer's instructions.
The extracted DNA was analyzed by NanoDrop (Thermo Fisher Scientific), Qubit (Quant-ItTM dsDNA HS Assay Kit; Thermo Fisher Scientific), and Fragment AnalyzerTM (High Sensitivity Large Fragment Analysis Kit; Advanced Analytics Technologies) to check the quantity, quality, and integrity of the genomic DNA. One nanogram of each sample was subsequently processed using the Nextera XT Library Preparation Kit and the Nextera XT index kit (Illumina) according to the instructions of the manufacturer. The obtained next generation sequencing (NGS) libraries were quantified by Qubit (Quant-It dsDNA High Sensitivity Kit) and analyzed with the Fragment AnalyzerTM (High Sensitivity NGS Fragment Analysis Kit). Sequencing was performed on an Illumina MiSeq system (Illumina) using the MiSeq Reagent Kit v3 (2 × 300-bp paired-end mode). Libraries were scaled to reach 100-fold sequencing coverage for an average genome size of 5 Mb. Sequence run quality control was done according to the manufacturer's instructions based on cluster density and Q30 value. Run acceptance criteria were a sequencing output of >13 Gb and a Q30 read quality score >66%.
Quality control (reads) and in silico identification
Before assembly, quality control of the reads was carried out with the interactive program FastQC (version 0.11.5) (http://bioinformatics.babraham.ac.uk/projects/fastqc/) and the Kraken identification tool (version 0.10.5-beta) with the options—preload and—paired. 24 High quality reads were trimmed using Trimmomatic (version 0.36) with the options—phred33, LEADING:10, TRAILING:10, SLIDINGWINDOW:10:15, and MINLEN:100. 25 In silico gene typing for the hsp60 gene, defining 12 genetic clusters, was performed after assembly based on previously published hsp60 gene sequences.4,5
Genome de novo assembly, core genome identification, and variant calling
De novo assembly was performed using SPAdes (version 3.10) with the options -k 21,33,55,77,99,127,—careful and—only assembler. 26 An average N50 of 425,816 bp across isolates was achieved. The genomes were fully aligned with Spine (version 0.2.1) using default settings. 27 Locally collinear blocks (LCBs) <1 Kb in length were removed, and the remaining LCBs were framed into a core genome alignment. For the detection of single-nucleotide polymorphisms (SNPs), the first study isolate, EH01, isolated in 2009, was chosen as reference isolate. Reads were mapped against the reference by Burrows-Wheeler Aligner (version 0.7.12-r1039) using default settings, 28 and core genome SNPs subsequently called by the SAMtools package (version 1.4.1) as described in the SAMtools workflow (http://htslib.org/workflow/). 29 SNPs were required to have a minimum SNP quality of 30 and a minimum root mean square mapping quality of 40 (Phred scale).
Core recombination and phylogenetic analysis
Variations based on recombination events were removed before phylogenetic analysis. The presence of regions of recombination within the core genome was investigated using BRATNextGen 30 with 100 permutations for significance estimation. Prophage regions were identified using PHAST (http://phast.wishartlab.com/index.html). 31 Maximum-likelihood (ML) phylogenetic trees were constructed by RAxML (version 8.2.8) 32 using general time reversible (GTR) as a nucleotide substitution model and gamma distribution (G) to describe rate variation among sites. Branch support was estimated by 1,000 bootstrap replicates. Subsequently, the results were drawn using FigTree (version 1.4.2), an interactive tool to present and manipulate phylogenetic trees.
Core genome multilocus sequence type
We additionally applied a whole genome multilocus sequence type (wgMLST) approach using the SeqSphere+ software (version 3.5; Ridom, Münster, Germany). 33 As there is currently no publicly available scheme for E. cloacae complex, we defined a local core genome multilocus sequence typing (cgMLST) scheme and in parallel, an accessory genome MLST scheme for E. hormaechei ssp. steigerwaltii using the SeqSphere+ target definer (default parameters) as previously described. 34 Based on BLAST analysis, we chose the fully annotated E. hormaechei ssp. steigerwaltii DSM 16691 strain (GenBank CP017179.1) as the reference genome and additionally all publically available annotated genomes of E. hormaechei ssp. steigerwaltii in NCBI (GenBank CP012167.1 and CP010376.2) to create an MLST scheme. Available annotated genes of plasmid origin were removed (GenBank CP012169.1, CP010386.1, CP10382.1, CP012168.1, CP010374.1, CP012170.1, and CP010375.2). Genes not fulfilling the requirements to be classified as core genome targets (presence of genes with a sequence identity <90% and an alignment of <100%) were classified as accessory genome targets. Further analysis was based on 3,643 targets in the core genome and 773 targets in the accessory genome. Genomes containing at least 95% of the defined cgMLST targets were included. During comparison of the allelic profile, the “pairwise ignoring missing values” option was turned on in the SeqSphere+ software. A threshold difference of less than or equal to 15 alleles in the cgMLST target gene set was considered highly related based on previous assumptions in multidrug-resistant (MDR)-Pseudomonas aeruginosa (threshold of differences of >14 alleles) 35 and the maximal difference of follow-up isolates compared to the first isolate of patient 23 (a difference of 13 alleles). Pairwise genetic distance was calculated for the core genome and the accessory genome.
Resistome analysis
Acquired resistance genes on assembled sequences were identified by ResFinder (version 2.1) (threshold of 98% identity and minimum length of 60%). 36 We additionally screened relevant contigs for plasmid structures using PlasmidFinder (version 1.3). 37
Plasmid, transposon, and integron analysis
Plasmid structure analysis was performed in one strain (EH02). Assembly and blast results with known integron sequences embedding the blaGIM-1 gene (GenBank JX566706) generated a complete plasmid structure. Results were confirmed with the following approaches: the quality sequence reads of each strain were remapped against the plasmid sequence using CLC Genomics Workbench version 9.0.1 (Qiagen) using the following parameters: length fraction of 0.5, similarity fraction of 0.8, and random mapping of nonspecific matches. Plasmid DNA purification was achieved using the QIAprep Miniprep Kit (Qiagen) from an overnight culture in LB medium. Quantity and quality control were performed, quality checked with NanoDrop and Qubit (see above). Subsequently, the plasmid size was confirmed using eight overlapping custom-designed primer sets (Supplementary Table S1; Supplementary Data are available online at www.liebertpub.com/mdr). PCR amplification was performed with the Expand High Fidelity Plus PCR system (Roche Diagnostics, Mannheim, Germany) using the following protocol: 2 minutes of denaturation at 94°C, 11 cycles of 10 seconds of denaturation at 93°C, 30 seconds of annealing at 62°C, and 6 minutes of elongation at 68°C, and 24 cycles of 15 seconds of denaturation at 93°C, 30 seconds of annealing at 62°C, and 6 minutes (adding 20 seconds each cycle) of elongation at 68°C, and a final step of 10 minutes at 68°C. The isolated plasmid was then digested using KpnI and SacII (Cfr42I) restriction enzymes in Tango buffer (Fermentas; Thermo Scientific) and fragments were visualized in 1% agarose gel in 0.5× Tris/Borate/EDTA (TBE) buffer. The genomic environment of blaGIM-1-harboring contigs was annotated using blast analysis and PROKKA (version 1.12). 38
Resequencing transposon structure
The transposon structure was resequenced after amplification using a combination of conserved-sequence custom-designed primers. The PCR protocol included 5 minutes of denaturation at 96°C followed by 35 cycles of 1 minute of denaturation at 96°C, 1 minute of annealing at 60°C, and 2 minutes of elongation at 72°C. Primers are shown in the Supplementary Table S1. Sequencing was performed using the Sanger technique with cycle sequencing and dye-marked terminators (BigDyes; Applied Biosystems, Darmstadt, Germany) using a 3130xl Genetic Analyzer (Applied Biosystems).
Infection control management
Epidemiological data were collected from patients' clinical records and, where possible, directly from the attending physicians. Infection control measures introduced to halt the outbreak were as follows: standard and contact precautions were applied for every patient colonized or infected with carbapenem-nonsusceptible Enterobacteriaceae (single room and contact precautions with use of gowns and gloves). On the medical ward (medical ward 1B) with the highest number of affected and related patients (10 out of 23 patients), hygiene measures were intensified with additional standard hygiene training sessions for the healthcare personnel. Infection control nurses additionally observed the hygiene practice over a period of several weeks in 2013. Admission and discharge screening for multidrug-resistant gram-negative bacteria of every patient on this medical ward was performed in a period between May and July 2013. Screening was conducted using rectal swabs (eSwab, Copan, Italy) and subsequent inoculation on chromogenic media (CHROMagar KPC/CHROM; MAST Diagnostics, Germany). No enrichment broth was used in our standard routine screening analysis of multidrug-resistant gram-negative bacteria. Environmental sampling was performed twice on medical ward 1B in May 2012 and May 2013. As environmental contamination seems to be a relevant source in long-term low-frequency outbreaks, especially difficult-to-disinfect sources like biofilms in sinks, environmental sampling was performed from all sink drains in patient and service rooms using eSwabs.1,39 The samples were inoculated on MacConkey agar, blood agar (containing 5 mg/L meropenem and 5 mg/L vancomycin), and always enrichment broth (brain heart infusion [BHI] with and without 32 mg/L imipenem), and incubated for a maximum of 48 hours at 37°C. These two self-prepared selective media were previously introduced in environmental sampling of contaminated sinks. 16
Transmission analysis
Transmission between patients was defined according to epidemiological data (coincidental time and place) and genetic data based on cgMLST (pairwise comparisons). Transmission of a strain was considered “definite” if a genetically related strain was isolated from two patients, who were on the same ward the same time for a minimum period of 24 hours. To account for environmental transmission, transmission was also considered “definite” when patients stayed on the same ward with a maximum gap of 7 days. Possible transmission events were considered only, when they occurred at most 6 months before the first detection of the E. hormaechei ssp. steigerwaltii on this ward.
Nucleotide sequence accession number
The 25-kb plasmid sequence was submitted to the GenBank and has been allocated the accession number KC511628. Sequence reads of all strains have been deposited as a project at the European Nucleotide Archive under the accession number PRJEB20383.
Ethics statement
The study was approved by the Ethics Committee of the Medical Faculty of the Heinrich-Heine-University Düsseldorf (study number 5226).
Results
Isolate collection, identification, susceptibility testing, and resistome analysis
Thirty-three blaGIM-1-containing E. hormaechei ssp. steigerwaltii isolates were collected from 23 patients between June 2009 and February 2016 (first and follow-up isolates) as well as one environmental isolate. The first seven clinical isolates were partially described in a general presentation of blaGIM-1-positive isolates by Wendel et al. 18 Standard microbiological techniques were unable to discriminate below the complex level. Analysis of the hsp60 gene identified all 33 isolates as E. hormaechei ssp. steigerwaltii. Basic epidemiological data of all isolates and the affected patients are shown in Tables 1 and 2 respectively.
The first two digits of the number denotes the patient the strain was taken from and the last hyphenated digit refers to the strain number from that patient (if more than one isolate was taken). Isolate EH-env was sampled from the environment.
ICU, intensive care unit; cgMLST, core-genome multilocus sequence typing; GIM-1, German-imipenemase-1.
Within a maximal interval of 3 months before first isolation of GIM-1-producing E. hormaechei. Percentages were rounded.
All 33 isolates were phenotypically resistant to several antibiotic classes and fulfilled the criteria of “extensively drug resistant.” 40 Nonsusceptibility to beta-lactam antibiotics was observed in all isolates for the following antibiotics: ampicillin, ampicillin/sulbactam, piperacillin, piperacillin/tazobactam, cefotaxime, ceftazidime, cefepime, ertapenem, and aztreonam. Genetic in silico search for bla genes showed the narrow-spectrum blaOXA-2 gene and the plasmid-located blaACT-7 gene, as well as blaGIM-1. MICs for meropenem and imipenem ranged from 1 to >32 μg/mL. Resistance to gentamicin and tobramycin could be explained in all isolates by the presence of various aminoglycoside resistance genes [aacA4 and aadA1 in all isolates and aph(6′)-Ic in 21 isolates]. Amikacin remained the sole aminoglycoside against which all strains remained susceptible. Fluoroquinolone resistance (100% to ciprofloxacin and levofloxacin) could be partly explained by the aac(6′)Ib-cr gene found in all isolates. Nonetheless, other resistance mechanisms (e.g., resistance mutations in the DNA gyrase or topoisomerase IV enzymes) were not ruled out. All isolates, but one (EH14) carried the sulfonamide resistance gene dfrA1 and phenotypic resistance to sulfamethoxazole/trimethoprim. Nonsusceptibility to tigecycline was encountered in most isolates (n = 29). Susceptibility to fosfomycin was observed in 25 out of 33 isolates, although the fosA gene, a fosfomycin resistance gene, was detected in all isolates. All isolates remained susceptible to colistin. All isolates displayed a positive phenotypic MBL test and a positive modified Hodge test.
Conventional epidemiology and genotyping
Based on conventional genotyping with PFGE and rep-PCR, all isolates belonged to one clone and were confirmed to be sequence type (ST)89 in MLST.
An ad-hoc MLST scheme was designed using Seqsphere+. The scheme consisted of 3,643 core genome targets and 773 accessory genome targets. By cgMLST, all isolates grouped in a single cluster with a maximum distance of 49 targets (Fig. 1). The isolates differed in 230 targets (273.527 bp). The allele-based distance matrix of the minimum-spanning tree (MST) (Supplementary Table S2) and the SNP-based distance matrix (Supplementary Table S3) showed that in 67.05% of all strains, each allele difference was caused by only one SNP (the remaining strains had mostly one, seldom two more SNPs, scattered over an average of 22 alleles per strain). The average SNPs-per-allele quotient was 1.014. First and follow-up isolates displayed a clear relationship (average distance of four alleles with a standard deviation of 2.98). The calculated MST of the cgMLST analysis is shown in Fig. 1. Based on cgMLST data and a defined threshold of maximum 15 alleles, we were able to show two genetically highly related complexes of 24 isolates (clonal complex 1; 17 patients and one environmental isolate, 2010–2016) and 4 isolates (clonal complex 2; two patients, 2013–2014) each. A third complex was observed containing two isolates of the same patient (patient 13). The analysis of the accessory genome demonstrated differences between isolates: only 237 out of 773 were suitable targets within a maximal distance of four targets. By analyzing spatiotemporal links, we were able to establish five definite transmission chains of isolates of the clonal complex 1 between eight patients (6 and 7, 9 and 10, 18 and 19, 19 and 20, and 20 and 21). No overt epidemiological links were found between the other eight patients. Although the first isolation occurred on five different medical wards, one surgical ward, four different intensive care units, and one outpatient clinic, 15 out of 23 patients were linked to the medical ward 1B. The epidemiological timeline of the GIM-1-positive E. hormaechei ssp. steigerwaltii strains adding the information of the cgMLST scheme are shown in Fig. 2.

Minimum-spanning tree of the 33 blaGIM-1-positive Enterobacter hormaechei isolates showing the genetic relationship based on the cgMLST scheme (Ridom SeqSphere+, 3,643 targets, pairwise ignoring missing value). Each circle displays a single genotype and numbers on the connecting lines in between the allele difference. Clonally related genetic complexes (≤15 alleles difference) containing more than one patient are encircled in gray. Primary isolates are white and follow-up isolates are marked in red. GIM-1, German-imipenemase-1; cgMLST, core-genome multilocus sequence typing.
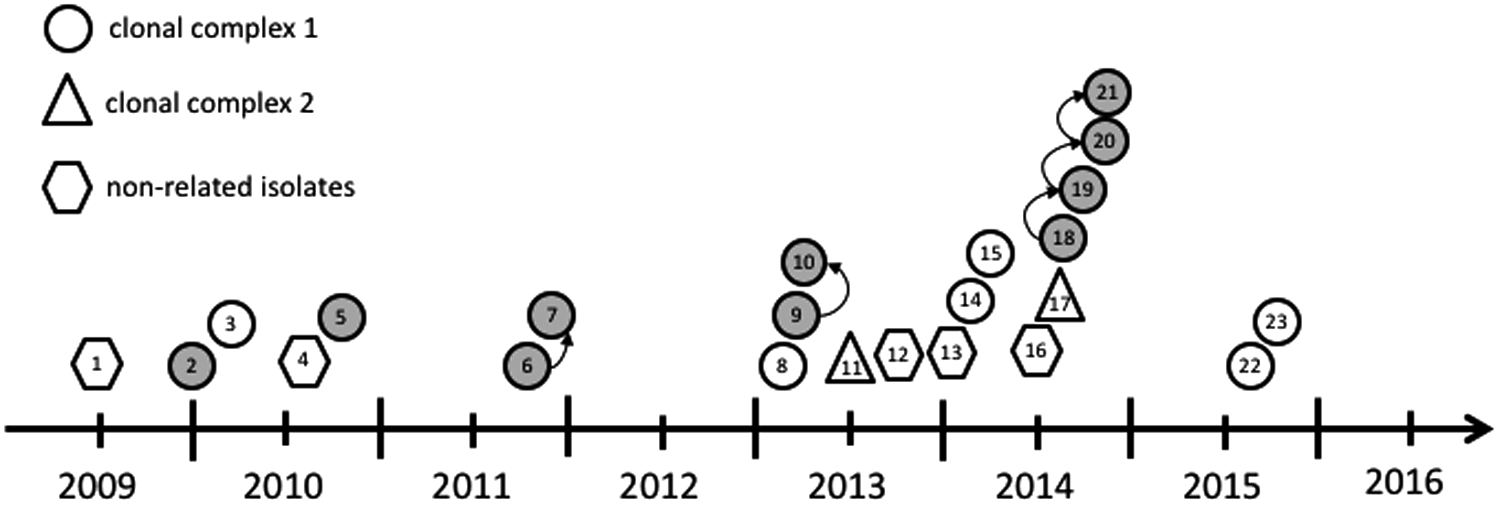
Epidemiological timeline and transmission route of the GIM-1-producing E. hormaechei based on epidemiological and genetic (cgMLST) data. Each symbol represents one patient at time of first isolation of GIM-1-producing E. hormaechei. Symbols relate to the genetic relationship. Gray, epidemiological link to ward 1B; white, another ward. Arrow indicates (epidemiological and genetically) definite transmission.
Phylogeny of GIM-1-positive E. hormaechei based on WGS analysis
The base core genome of the 33 blaGIM-1-positive E. hormaechei strains consisted of 4.730.496 bp. A total of 2,411 variable sites were detected; of those 1,946 were parsim informative. ML phylogeny of core genome SNPs demonstrated a high degree of relatedness between all strains except EH11-1, EH11-2, EH11-3, and EH17. These latter four isolates show a high degree of relatedness complex within this group (Fig. 3), forming one distinct clonal complex, the cgMLST tree (Fig. 1). Since the representation of the phylogenetic tree in this form suggests a chronological and evolutionary order from the left to the right, we also provided the unrooted version of this tree in the Supplementary Data (Supplementary Fig. S1). Investigating the results of the MST of the cgMLST scheme (Fig. 1) and the phylogenetic ML tree of the blaGIM-1-positive E. hormaechei strains (Fig. 3), some strains show a different topology. Strain EH02 and strain EH03 are, for example, direct “neighbors”—one allele difference (Supplementary Table S2)—in the MST (Fig. 1), but far apart—471 SNPs (Supplementary Table S4)—in the phylogenetic tree (Fig. 3). Since the difference in one allele can consist of few to multiple SNPs, we converted the allele-based distance matrix of the MST (Supplementary Table S2) into an SNP-based distance matrix (Supplementary Table S3), demonstrating that the one allele, in which EH02 and EH03 differ, only consists of one SNP. Another example is the comparison of strains EH12 and EH13-1. While these strains are closely related (103 SNPs) in the phylogenetic tree, they are, however, relatively far apart (28 alleles) in the MST based on only 28 SNPs. EH5-1 and EH05-2, isolated 4.5 month apart, differ as well in the two approaches used (nearly identical in the MST of the cgMLST, far apart [379 SNPs] in the phylogenetic tree). All other strains isolated from the same patient grouped together. Consequently, the discrepancies in the topology of both trees are not caused by variable translation rates from allele to SNP, but rather by the data these trees are based on.
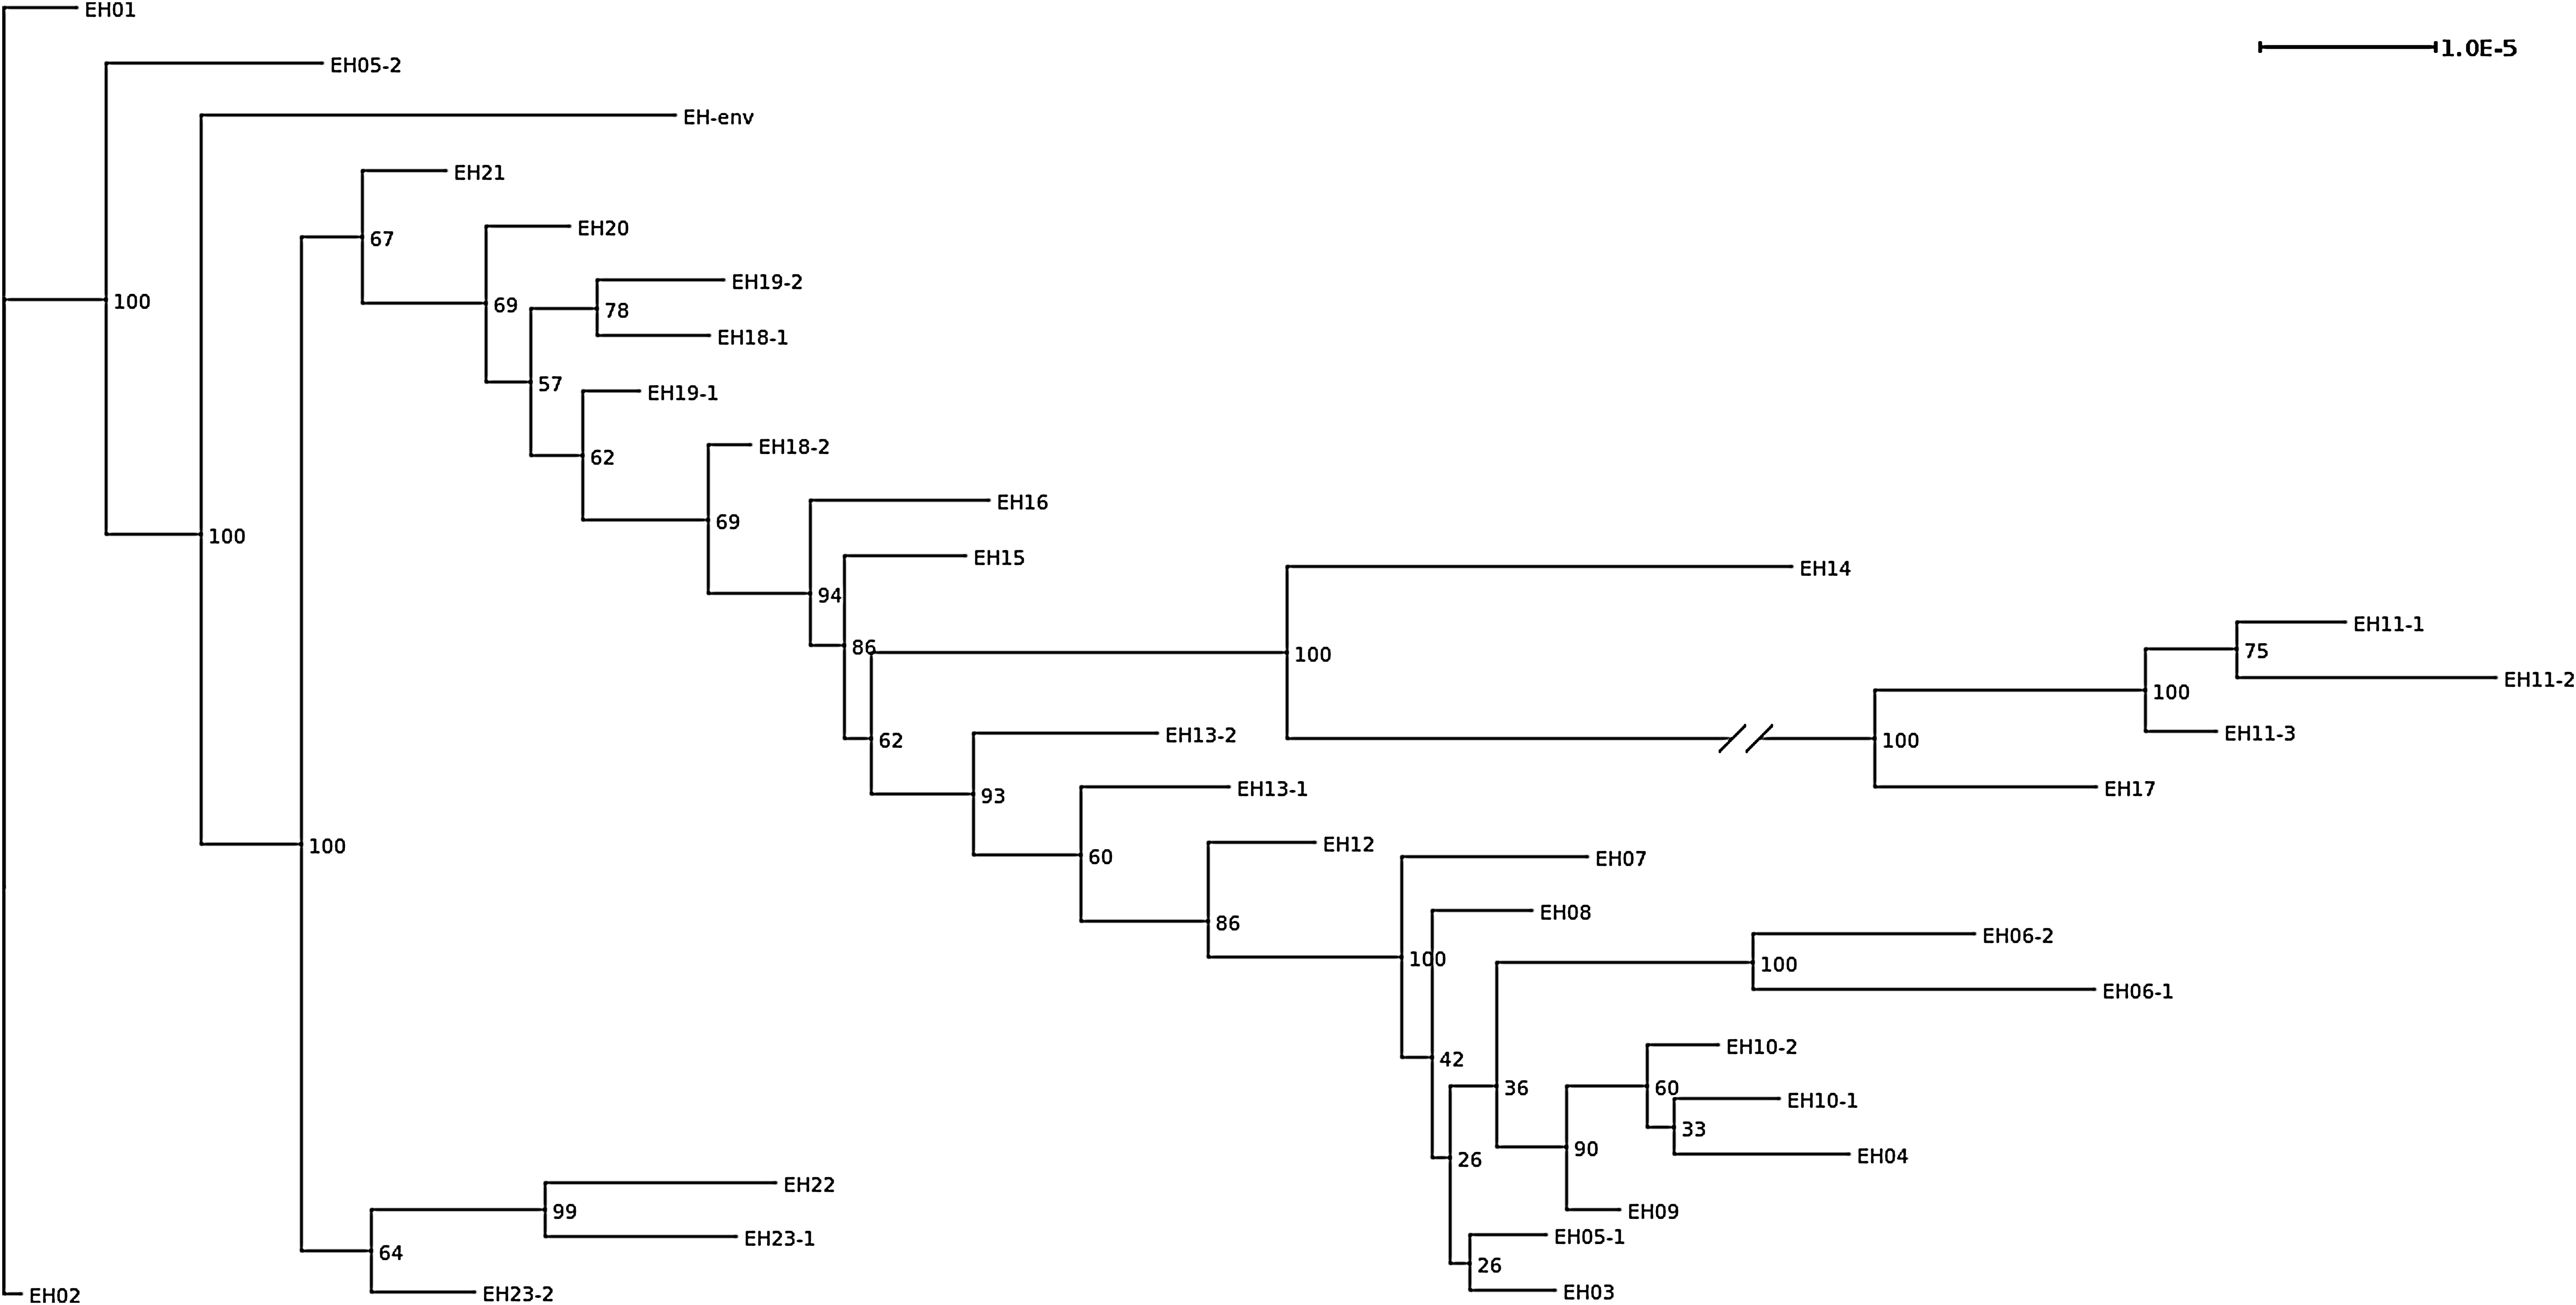
Core-genome maximum-likelihood phylogeny of 33 GIM-1-harboring E. hormaechei strains based on 1,000 bootstraps of core-genome single nucleotide polymorphisms. The numbers at the branch points are bootstrap-based support values in percent, that is, 100 stands for full support for this specific split. For the purpose of representation, the branch between EH14 and EH17 was shortened to ¼ of its original size and is marked by a line break.
Infection control management
Rectal screening on medical ward 1B in the spring of 2013 remained negative throughout the 2-month period of intensified hygiene control. No further GIM-1-producing E. hormaechei isolate was detected after the last patient (number 23, October 2015). Since 2014, active screening for carbapenem-resistant Enterobacteriaceae is only performed in patients at risk (healthcare facilities abroad or with known endemic situation, known positive carrier status, or contact to other patients carrying carbapenem-resistant Enterobacteriaceae). Environmental sampling detected one E. hormaechei isolate in one sink trap in a service room in 2012 that grouped within the clonal complex 1 (Fig. 1). We were able to demonstrate that several sinks on the ward 1B were contaminated with blaGIM-1-harboring bacteria of different species (E. cloacae complex, Citrobacter freundii, S. marcescens, P. aeruginosa, Achromobacter denitrificans, and Aeromonas hydrophila). Genetic details of the bacteria are already published and ward 1B is mentioned as medical ward. 17
Genetic environment and localization of blaGIM-1 (plasmid and transposon analysis)
S1-restriction and in-gel detection with a 32 P-radiolabeled blaGIM-1 probe demonstrated the gene located on a 25-kb plasmid in the isolates of the clonal complex. Further analysis showed a circular 25,855-bp structure. Restriction enzyme and subsequent gel analysis displayed fragments of the expected length (9.3, 6.5, 4.3, 3.1, 2.4, and 194 bp). Overlapping primer sets also confirmed the expected fragment length of the in silico analysis. Remapping revealed the plasmid structure with a continuous coverage. We additionally performed Sanger resequencing of the integron and transposon structure, and the neighboring regions of ∼14 kb. Blast analysis displayed a transposon structure previously described in GIM-1-producing S. marcescens. 15 The blaGIM-1 gene was embedded in a class-1-integron (In770) and the Tn21-subgroup transposon Tn6216. In vitro conjugation experiments between E. hormaechei isolates and Escherichia coli C600 were not successful. The assembled blaGIM-1-containing plasmid showed no evidence for Inc groups using PlasmidFinder. However, we did find IncFII and IncFIB in all isolates except isolate EH14, ColRNAI in isolate ID-EH6.2, and IncL/M in four other isolates (EH07, EH11-1, EH13-1, and EH14), underscoring the genetic plasticity of the organism E. hormaechei.
Discussion
Beta-lactam resistance mediated by carbapenemases in gram-negative organisms has emerged as a major challenge to treatment. Few treatment options remain for patients infected with these bacteria as they tend to harbor additional resistance genes. 41 One main route of distribution is hospital contact. 42 Thus, dissemination of these enzymes constitutes a major threat for modern medicine. 43 Clinical outbreaks can be driven by specific bacterial species and/or by transferable plasmids. The latter may spread into different species, and is thus far more difficult to recognize in the clinical setting. Recognition of low-frequency outbreaks may also be delayed by sporadic appearance of these specific bacteria. Therefore, a continuous molecular surveillance of carbapenem-nonsusceptible gram-negative bacteria is essential to detect possible transmission chains. Using this approach, we previously described the endemic local MBL GIM-1 in a German tertiary care center driven by successful clones and by plasmids demonstrating the emergence of GIM-1 in P. aeruginosa, P. putida, and a number of species within the Enterobacteriaceae family. 18 Based on molecular surveillance of carbapenemase-producing gram-negative bacteria at the institute, we described a prolonged low-frequency outbreak with a GIM-1-producing P. aeruginosa clone ST111 lasting from 2002 to 2013 at the university hospital, and the spread of a successful clone of GIM-1-producing S. marcescens within the region of Düsseldorf from 2008 till 2015.15,16 Overall, there have been few descriptions of GIM-1-producing Enterobacteriaceae (Escherichia coli, E. cloacae complex, S. marcescens, Klebsiella oxytoca, and C. freundii), all from Western Germany with isolates dating back to 2007.15,18,19,44 In this study, we demonstrated a long-term low-frequency outbreak of a blaGIM-1-carrying E. hormaechei ssp. steigerwaltii of the same ST (ST89), which affected 23 patients from 2009 to 2016 in the same tertiary care center. There are numerous descriptions in the literature of outbreaks with E. cloacae complex,6–10 as it is considered a major nosocomial pathogen. Some reports also applied WGS as the new gold standard of bacterial typing.6,10,45
The use of typing methods with high discriminatory power is crucial to discover the source and mode of transmission. Recent studies using WGS analysis indicate that the traditional methods lack discriminatory power to accurately determine transmission chains. 46 Conventional typing with PFGE and MLST initially pointed to a high grade of relationship between the isolates. wgMLST, a method successfully applied in outbreak settings and a method with higher discriminatory power, revealed that all isolates were closely related and two clonal clusters, each containing more than one patient, could be identified.34,35 Furthermore, maximum-likelihood phylogeny confirmed the smaller of the two cgMLST clusters containing two patients, who had no direct contact with each other. Differences between the two methods can be explained by the different definition of a core genome used. While in the phylogenetic ML tree a core genome was calculated from WGS data, the core genome MLST scheme is based only on a number of defined target genes. Thus, the basis upon which the analysis is made does not permit a useful direct comparison. Furthermore, MLST scheme analysis might miss the presence of SNPs in noncoding regions of the genome and therefore miss strain divergence.
We were also able to describe a small blaGIM-1-bearing plasmid embedded in a transposon structure. We were not able to demonstrate in vitro plasmid mobility. However, previous studies have demonstrated the same transposon and plasmid structure in a S. marcescens isolate from Düsseldorf from 2013, 15 which is highly suggestive of mobility between bacterial species. In addition, the blaGIM-1 gene was first described on a plasmid of a similar size in P. aeruginosa. 14 Comparisons of the plasmid structures in GIM-1-producing bacteria will be the subject of future research.
Transmission events were analyzed by a combination of patient tracing and genomic phylogenetic analysis. Although the GIM-1-producing E. hormaechei was initially isolated on several wards, epidemiological analysis already pointed to a hot-spot ward (ward 1B) to which 10 patients could be linked. Transmission between patients was determined as definite in eight patients with five transmission events. In the other cases, no correlation between epidemiological and genetic data was found, leaving the mode of transmission unclear. Undetected carriers, such as patients or healthcare workers, and contamination of the hospital environment are known to play a major role in the dissemination of E. cloacae complex. 1 As healthcare workers are less likely to play a role in protracted outbreaks, reservoirs are either colonized patients or the hospital environment. However, sampling the sinks revealed a clonally related isolate in only one sink trap in a service room. Since this sink trap was used for the disposal of body fluids, it was not considered to be a likely source of infection.
There are several limitations of the study. First the burden of blaGIM-1-producing E. hormaechei-colonized patients might be underestimated as no general admission or discharge screening was performed during the whole study period. Rectal screening at admission for multidrug-resistant gram-negative organisms is only recommended for high-risk patients in Germany. 47 Second, we established an artificial threshold in cgMLST analysis to define highly related isolates. However, as shown in this study, cgMLST is a suitable comparison tool for Enterobacter spp. due to the minimizing of the effect of recombination events that are quite common in this species.
In conclusion, WGS in combination with classic epidemiology is a useful tool to analyze low-frequency outbreaks. We successfully identified such an outbreak of a carbapenemase-producing E. hormaechei using continuous molecular screening and WGS, underlining the importance of such methodology for surveillance purposes that aim to reduce the spread of extensively drug-resistant microorganisms within our hospital settings.
Footnotes
Acknowledgments
We thank Birgit Lamik, Raquel Guadarrama-Gonzalez, Lisanna Hülse, Dana Belick, Ole Heidkamp, and Sibylle Müller for technical help and the colleagues at the Institute of Medical Microbiology and Hospital Hygiene, Düsseldorf, Germany, who collected the clinical isolates and did first identification. We also thank Sebastian Wohlfromm for help with plasmid identification. Finally, we would like to thank J.W.A. Rossen, Department of Medical Microbiology, University of Groningen, The Netherlands, for help with SeqSphere. This work was supported by the European Society for Clinical Microbiology and Infectious Diseases (ESCMID) Study Group for Genomic and Molecular Diagnostics (ESGMD), Basel, Switzerland. This work was funded by the Research Committee of the Medical Faculty of the Heinrich-Heine-University, Düsseldorf, Germany (Anschubfinanzierung 53/2015).
Disclosure Statement
No competing financial interests exist.
References
Supplementary Material
Please find the following supplemental material available below.
For Open Access articles published under a Creative Commons License, all supplemental material carries the same license as the article it is associated with.
For non-Open Access articles published, all supplemental material carries a non-exclusive license, and permission requests for re-use of supplemental material or any part of supplemental material shall be sent directly to the copyright owner as specified in the copyright notice associated with the article.