
Abstract
Resistant microorganisms such as Pseudomonas aeruginosa grow by developing biofilms in hospitals. We aimed to investigate the biofilm formation and the frequencies of biofilm-related genes and their associations with antibiotic resistance pattern in P. aeruginosa isolated from Iranians’ clinical samples. This review was performed according to the Preferred Reporting Items for Systematic Reviews and Meta-Analyses (PRISMA) guidelines. We conducted a systematic literature search in scientific databases using medical subject heading terms, including “Pseudomonas aeruginosa,” “biofilm formation,” “biofilm-related genes,” “antibiotic resistance,” and “prevalence,” to obtain related articles published from 1st January, 2000, to 30th March, 2019. The studies reporting the prevalence of biofilm formation, the frequencies of biofilm-related genes, and the antibiotic resistance pattern in P. aeruginosa retrieved from Iranian patients were included. Meta-analysis was performed using the Comprehensive Meta-Analysis software. The pooled rate of biofilm formation was calculated as 86.5% (95% confidence interval [CI]: 79–91.6). The combined frequencies of strong, moderate, and weak biofilms were 51% (95% CI: 37.4–64.4), 29.2% (95% CI: 20.9–39.1), and 25.4% (95% CI: 11.5–47.2), respectively. The pooled prevalence of laslR, algD, algU, ppyR, and pelF genes were 93.6% (95% CI: 88.1–96.6), 91.4% (95% CI: 80.8–96.4), 89.3% (95% CI: 85.2–92.3), 98.7% (95% CI: 96.5–99.6), and 93% (95% CI: 82.7–97.3), respectively. The highest combined antibiotic resistance rates of P. aeruginosa isolates were against piperacillin/tazobactam (90%). This study showed that biofilm formation was higher in multidrug-resistant (MDR) P. aeruginosa than non-MDRs. A significant correlation was observed between biofilm formation and antibiotic resistance in 50% of studies included in this review.
Introduction
P
P. aeruginosa infection is a common nosocomial infection with high mortality and morbidity rates, especially among immunocompromised 4 and patients with burn wounds. 5 Extensive use of systemic antibiotics as well as surgical debridement have increased the risk of infections caused by Gram-negative bacteria such as P. aeruginosa. 6 A variety of antimicrobial mechanisms such as the expression of efflux pumps, suppression of enzyme production, and biofilm formation have rendered the treatment of bacterial infections problematic. 7 Thus, it is important to employ appropriate antibiotics to reduce mortality and hospitalization rates, as well as the economic burden associated with resistant Gram-negative bacterial infections. 8
The antibiotic-resistant bacterial strains are mainly developed due to the inappropriate use of antibiotics leading to the propagation of antimicrobial mechanisms among bacteria. 9 Multidrug-resistant (MDR) P. aeruginosa infections are major health care concerns in today's world.10,11 There are limited effective antibiotics against MDR P. aeruginosa leading to longer hospital stays and costs, as well as higher mortality and morbidity rates. 12
P. aeruginosa can cause either chronic or acute infections depending on the host's health status and the life cycle adopted by the microorganism in the host's body. 13 The pooled prevalence of MDR P. aeruginosa has been estimated to be 58% in Iran, 14 constituting 10–20% of all nosocomial infections. 15
Many bacteria, including P. aeruginosa, produce biofilms to survive in the host's body and harsh environments. 16 Biofilm formation allows cumulative bacterial growth by adhering to surfaces through self-secreted matrix extracellular polymeric substance (EPS). The EPS contains polysaccharides, proteins, and nucleic acids allowing the organism to thrive in difficult conditions such as undesirable pH, humidity, and temperature, as well as in exposition with antimicrobial agents. 17
Biofilm formation is a complex phenomenon involving several internal signaling pathways and the expression of multiple biofilm-related genes such as pel, psl, and alg. 18 The difference between planktonic and biofilm persistence reduces the metabolic activity of biofilms, inactivates antimicrobial agents, and suppresses the expression of specific enzymes.19,20
Several genes are involved in biofilm formation by P. aeruginosa. The pslA gene encodes an exopolysaccharide involved in biofilm structure. Also, alginate is another polysaccharide encoded by algD, algU, and algA genes participating in the structure of biofilms and enhancing the adherence capability of P. aeruginosa. 21 Besides, psl, pel, and ppyR genes encode other exopolysaccharides involved in biofilm formation. 22 Biofilms are structurally categorized into weak, moderate, or potent, each presenting variable capabilities to protect bacteria against antimicrobial agents. 23
The induction of virulence factors (such as type III enzyme secretion systems) and decreased permeability of bacterial membranes during biofilm formation confer resistance to bacteria against different classes of antibiotics.24,25 So, biofilm formation allows P. aeruginosa to create chronic infections and persist in harsh environments such as hospitals.26,27 Acknowledging the relationship between bacterial genotype and biofilm phenotype can help to effectively control severe infections caused by biofilm forming in P. aeruginosa strains. 16
Regarding the significant role of P. aeruginosa in hospital-acquired infections and the lack of a comprehensive study on this issue, we aimed to investigate the combined prevalence of biofilm formation, biofilm subgroups (i.e., potent, moderate, and weak), antibiotic resistance pattern, the combined prevalence of biofilm-related genes, and the association between biofilm formation and antibiotic resistance in P. aeruginosa strains isolated from Iranian patients.
Materials and Methods
The present meta-analysis was performed according to the guidelines of the Meta-analysis of Observational Studies in Epidemiology (MOOSE) and Preferred Reporting Items for Systematic Reviews and Meta-Analyses (PRISMA) (Supplementary Data).
We conducted a systematic literature search in Web of Science, Cochrane Library, Scopus, PubMed, and Google Scholar databases using the following medical subject heading terms: Pseudomonas aeruginosa, biofilm formation, biofilm-related genes, antibiotic resistance, and prevalence. The combinational search was conducted applying the following strategy (in the MEDLINE for example): “((Biofilm formation) OR Biofilm production) AND Pseudomonas aeruginosa) AND Prevalence) AND Iran)).” Studies published between 1st January, 2000, and 30th March, 2019, were retrieved. The articles reporting the prevalence of biofilm formation, the frequencies of biofilm-related genes, and the antibiotic resistance pattern of P. aeruginosa in Iranian patients were included. The references of all included studies were also checked for finding additional records.
Eligibility criteria
The major inclusion criteria included reporting the rate of biofilm formation, the prevalence of biofilm-related genes, and the antibiotic resistance pattern in P. aeruginosa isolated from Iranian patients’ samples. Also, only studies in which the standard microtiter plate test had been used as the biofilm formation assay were included. 28 In this technique, the P. aeruginosa isolates were grown at 37°C overnight in Mueller Hinton Broth (MHB) containing 0.25% glucose. The cultures were diluted 1:100 in MHB medium. Sterile 96-well microtiter plates were inoculated with 125 μL of the bacterial suspension and incubated for 24 hours at 37°C without agitation. The wells were washed with 300 μL distilled water in triplicate and dried at room temperature. All wells were stained with 125 μL of 0.1% crystal violet solution for 10 minutes. Then, wells were washed thrice with distilled water. The wells were destained with 125 μL of 30% acetic acid solution. Finally, the optical density (OD) of each sample was measured at 570 nm by a spectrophotometer (Smart Spec plus Spectrophotometer Bio-RAD). The experiment was repeated in triplicate and the mean value of OD was calculated. Based on the optical density index (ODi) of the samples and on the mean of the OD of the negative control (ODc), the biofilm was classified as strong (4 × ODc < ODi), mod (2 × ODc < ODi ≤4 × ODc), weak (ODc < ODi ≤2 × ODc), and nonproducer of biofilm (ODi < ODc).
Also, for determining the antibiotic resistance rate, the studies should have used one of the standard susceptibility tests such as Broth dilution (either Macrobroth or Microbroth dilution) and disk diffusion methods according to the Clinical and Laboratory Standards Institute (CLSI). 29
Reviews, editorials, congress and meeting abstracts, literatures in languages other than English, case reports, and letters to editors were excluded. Articles without full text, duplicate reports, and studies with unclear and missing data were also omitted.
Screening
Duplicates were initially identified and eliminated after entering all the recognized studies into a self-created database. After that, the articles were assessed by two reviewers (H.K.M. and M.H.F.) by screening titles, abstracts, topics, and finally full texts. At each level, the reviewers independently screened the articles and finally merged their conclusions. Discrepancies were resolved by discussion before finalizing the records for the next level. In case of disagreements, a third assessor (A.K.) was assigned to make a decision. Finally, the studies were assessed for eligibility before the final selection.
Quality assessment
Methodological quality assessment of the studies was performed using a checklist for necessary items as outlined in the Critical Appraisal Skills Programmed checklists. For each article, a series of critical questions was asked. If the pertinent data were presented, the question was scored “yes.” If there was any doubt or no information in the study, that question was marked as “no” or “can't tell.” The studies were given a total rate of either “strong,” “moderate,” or “weak,” based on the number of questions scored “yes.” 30 Finally, weak studies were removed from the study. Overall, the employed scoring system for quality assessment of quantitative (i.e., cross-sectional surveys) included 10 questions. The scores were categorized as weak (0–4), moderate (6–8), and strong (>8) 31 (Supplementary Table S1).
Data extraction
A data extraction form was designed to extract the relevant characteristics of each study. The extracted information included the first authors’ names, time of the study, year of publication, location, sample size, biofilm formation rate, the correlation between biofilm formation and antibiotic resistance, and the type of biofilm (i.e., potent, moderate, and weak). Two of the authors (A.K. and K.M.) extracted the data.
Data analysis and statistical methods
Meta-analysis was performed using the Comprehensive Meta-Analysis software (Version 3.3.070). The rate of biofilm formation was calculated with 95% CI. The heterogeneity was assessed by the Cochrane Q and I2 tests. Considering the heterogeneity indices, the random-effects model was used to calculate the pooled frequencies. Subgroup analyses were conducted based on the type of biofilm, biofilm-related genes, and antibiotic resistance rate. Quantitative Egger weighted regression test and Funnel plot were used to investigate publication bias. p-value of <0.05 was considered the statistical significance threshold.
Results
Study inclusion criteria and characteristics of the eligible studies
A total of 612 studies were retrieved and 34 full texts were reviewed. Twenty studies met our inclusion criteria (Fig. 1).
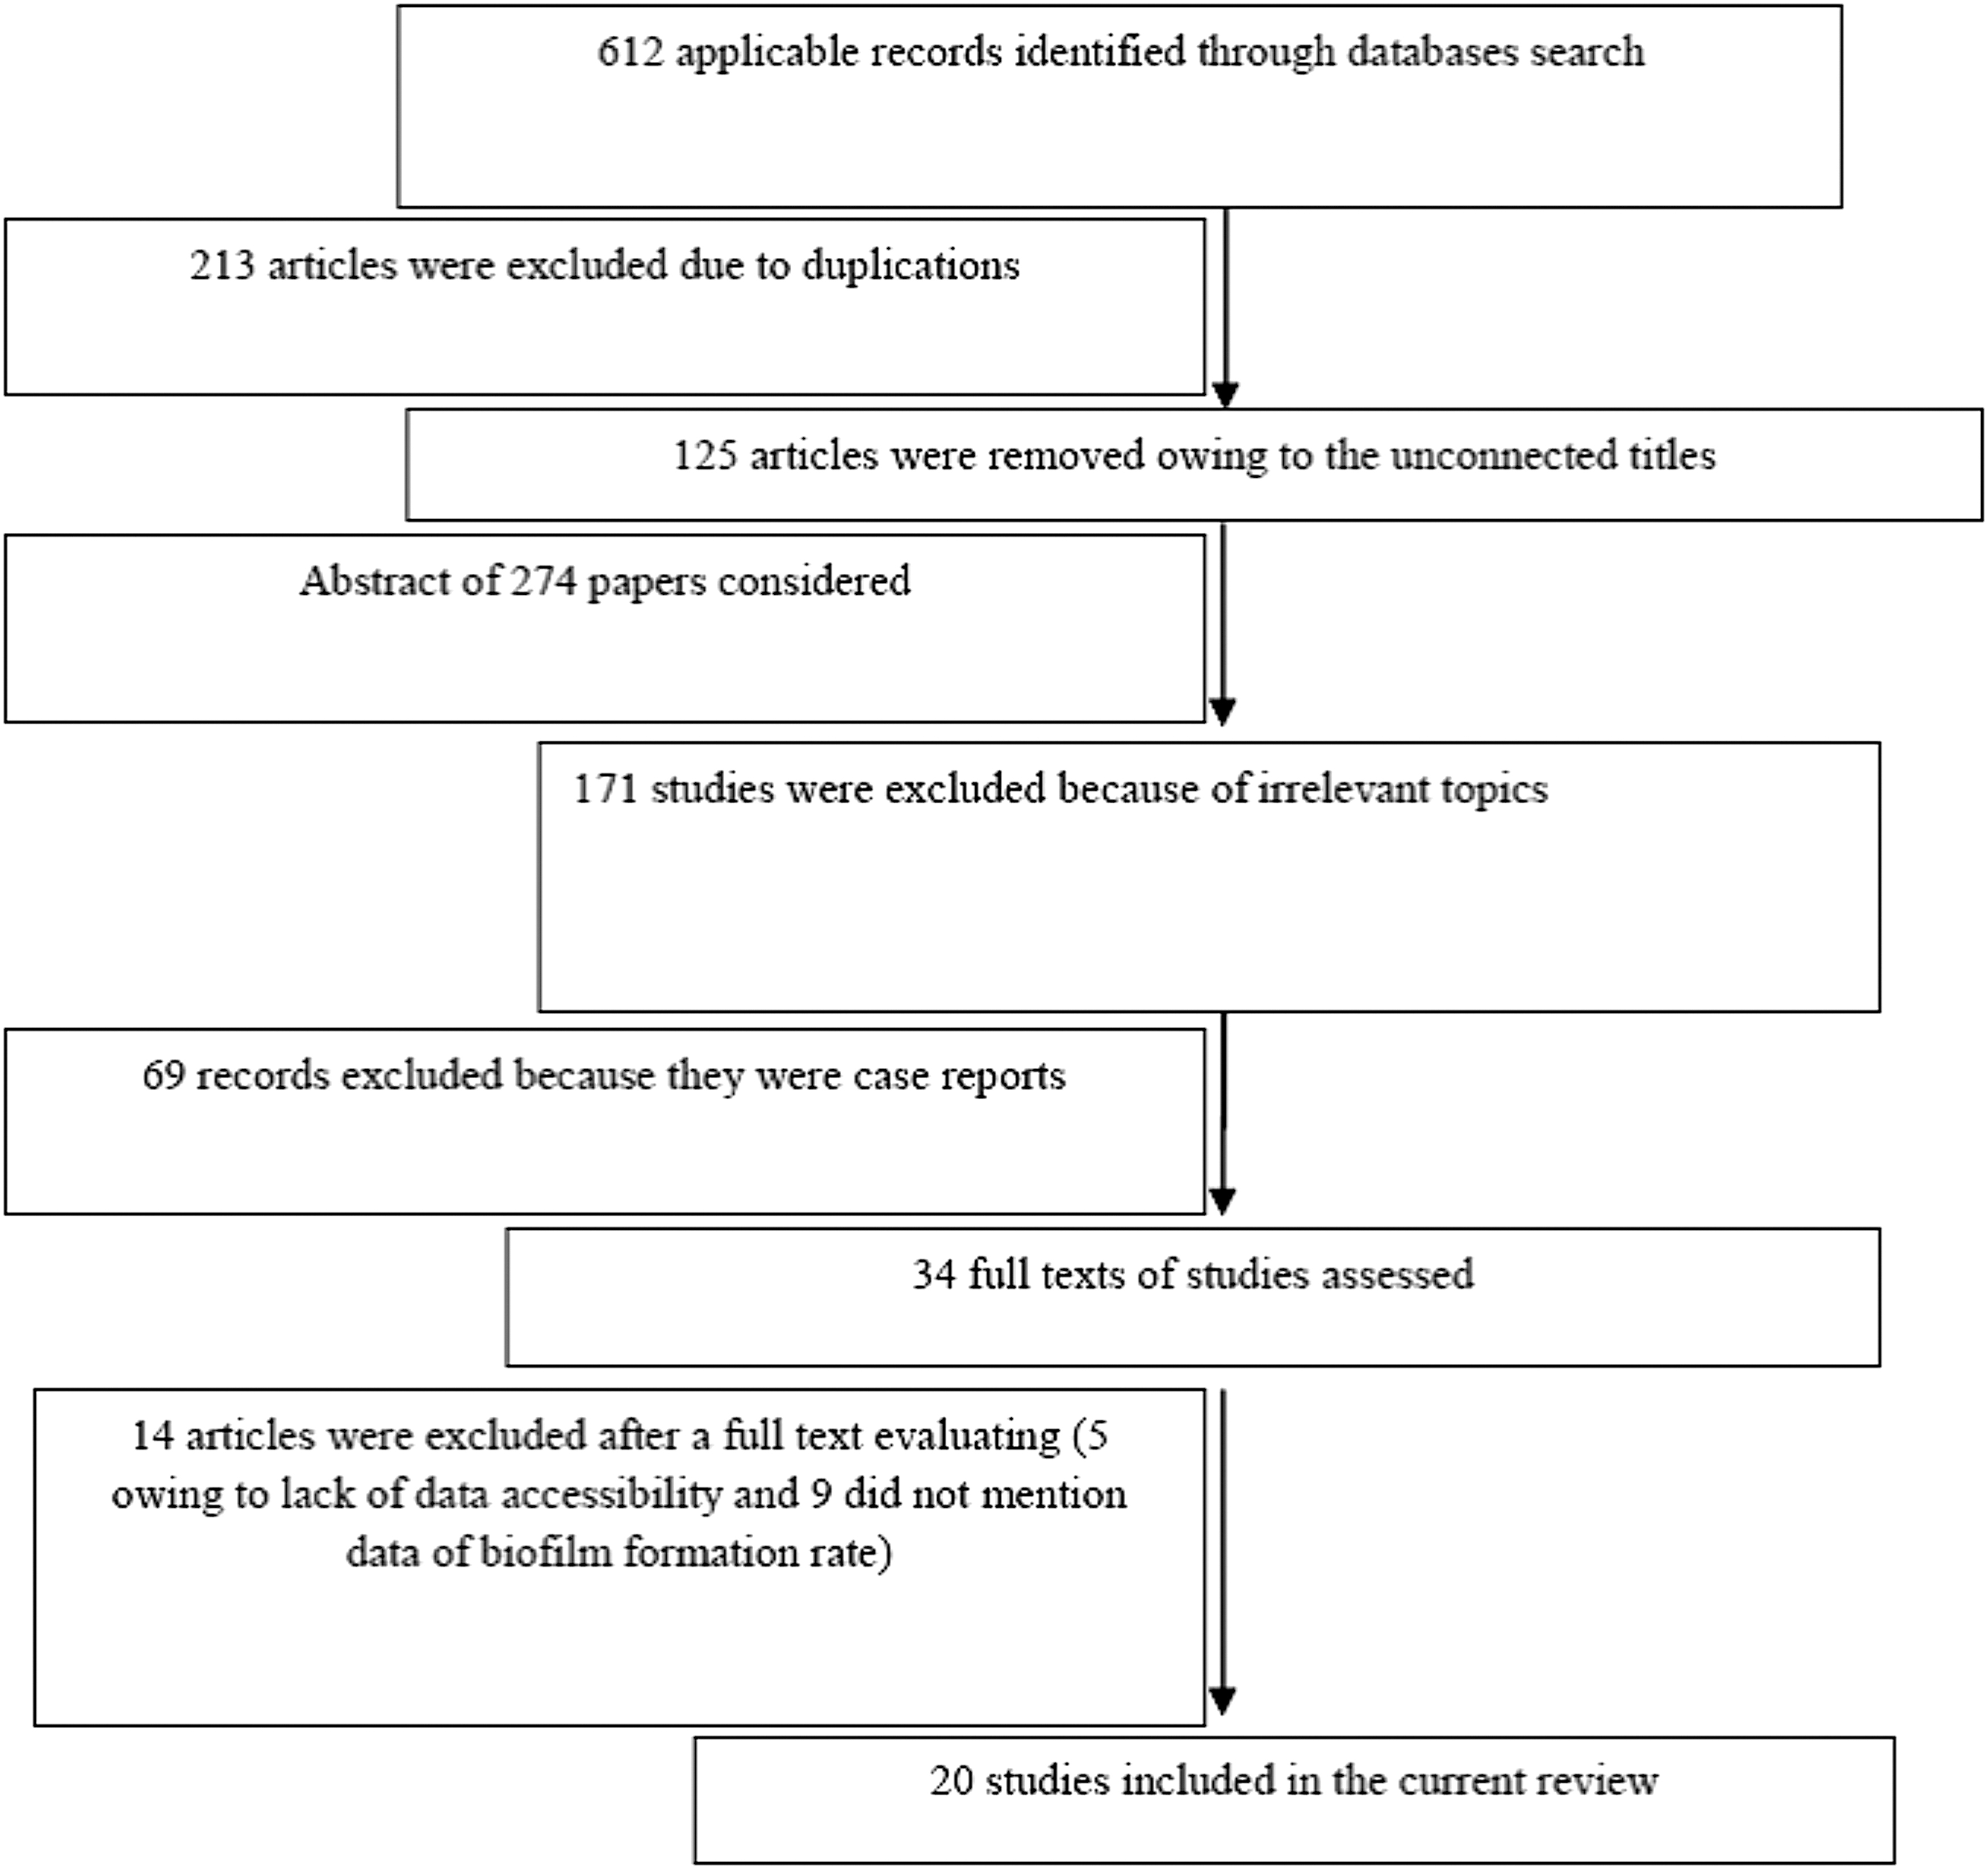
Conceptual model of study search and selection.
The finally included studies covered different regions of Iran, but most of them had been performed in Tehran. Overall, the biofilm formation rate varied from 43.5% to 99.5% in P. aeruginosa isolates from Iranian patients (Fig. 2, Table 1).
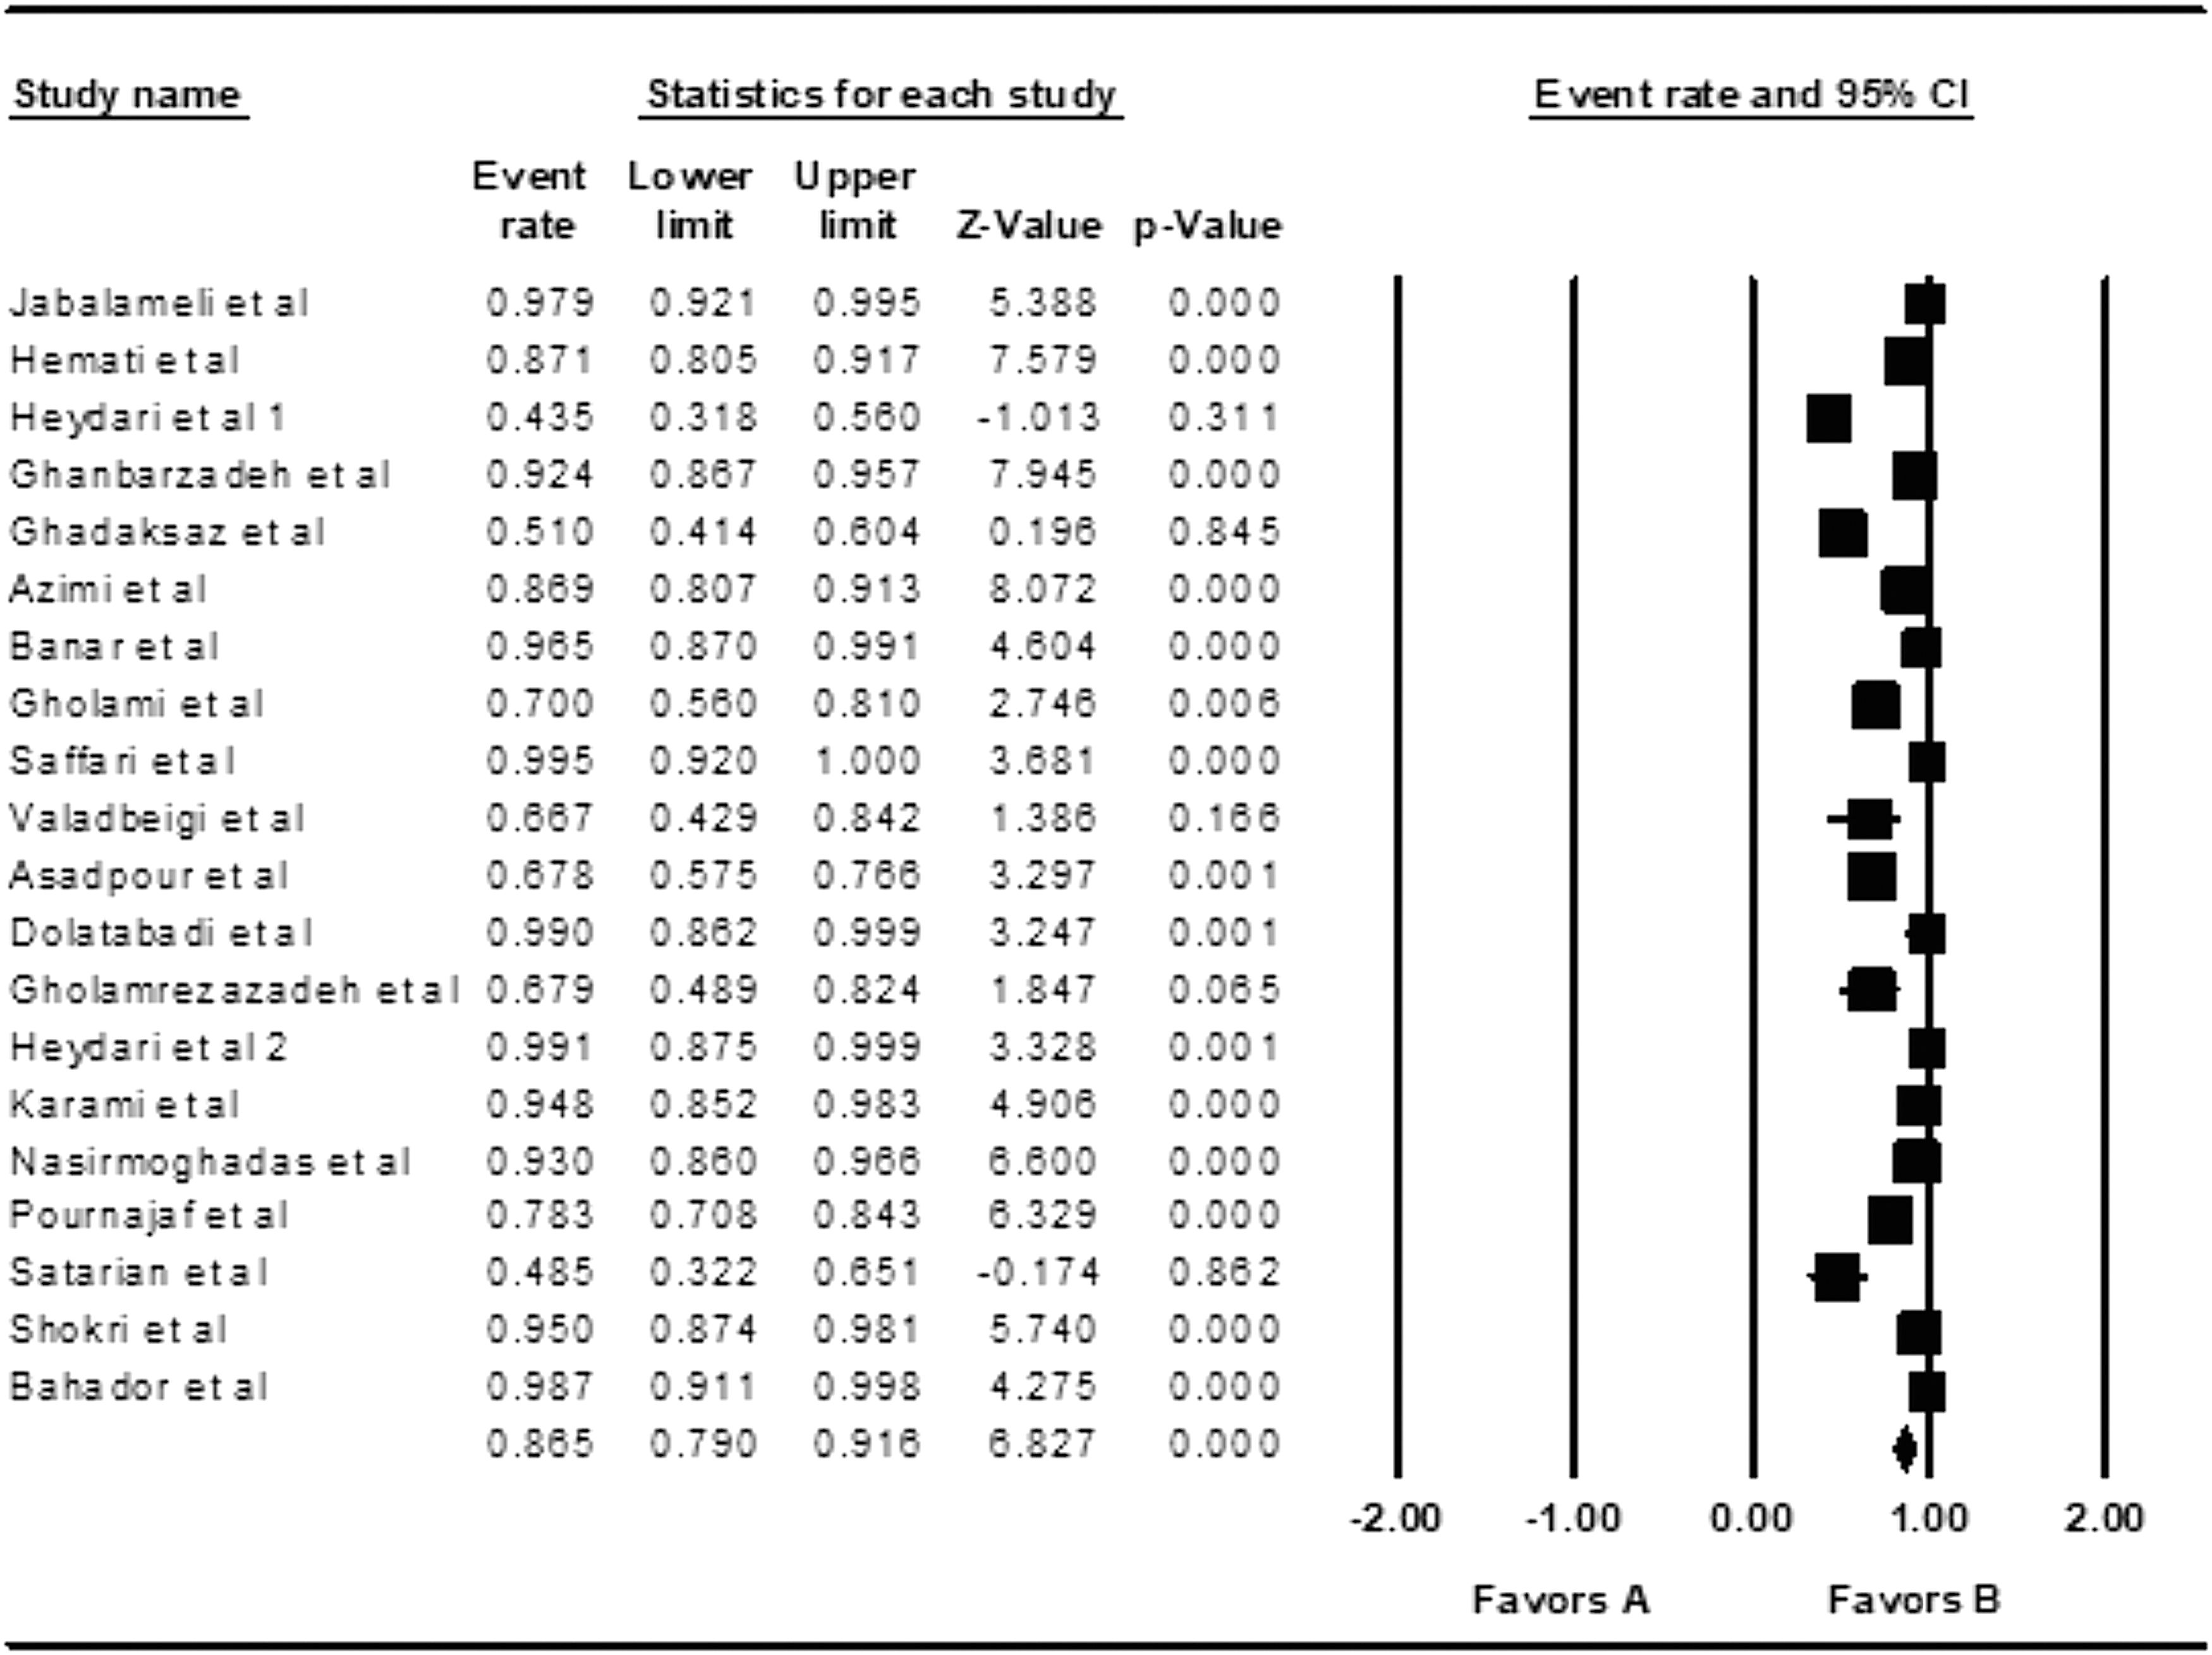
Forest plot of the meta-analysis of prevalence of biofilm formation in Pseudomonas aeruginosa isolated from clinical samples. In the forest plot (a graphical display), the X-axis forms the effect size scale, plotted on the top of the plot. Each row, except the bottom one, represents a study's effect size estimate in the form of a point and a (95%) CI. This is the statistically correct way of representing the results of a single study, namely as an estimate of an interval in which the “true” effect (in the population) will most probably lie. Remember it is assumed that every study in the meta-analysis is a study of a complete probability sample of a specified population. If this assumption is not met in a study, no inference can be made from the “sample” to a population and hence, comparing the observed effect size with observations in other studies is not meaningful. The point estimate is represented in the forest plot by a smaller or a larger bullet. The relative size of these bullets represents a study's weight in the generation of the meta-analytic result. The plot presented in this figure is fictitious and constructed for illustration purposes: if CIs are entirely on the positive side of zero, in traditional terminology, these studies show a statistically significant positive effect. If CIs are entirely on the negative side of zero, in traditional terminology, these studies show a statistically significant negative effect. If CIs include zero, in traditional terminology, these studies show an effect that is not statistically significant. CI, confidence interval.
Characteristics of Included Studies in This Review
In this method, the sample size and event rate (prevalence) were used to calculate the combined biofilm produced. The rate of biofilm formation was calculated with 95% CI through random-effects model. p-value of <0.05 was considered the statistical significance threshold.
CI, confidence interval.
Overall effects
Heterogeneity analysis
The heterogeneity indices among the included studies were as Q2 = 206.3, I2 = 90.7, and t = 3 (p = 0.006). According to the observed heterogeneity indices, the random-effects model was used to combine the frequencies of biofilm formation.
Biofilm prevalence
The pooled rate of biofilm formation was calculated as 86.5% (95% CI: 79–91.6, Table 2).
Overall Effects of Subgroup Analysis in Pseudomonas aeruginosa Isolated from Clinical Samples of Iranian Patients
Biofilm formation was calculated using Comprehensive Meta-Analysis software as presented in Table 1. The heterogeneity was assessed by the Cochrane Q and I2 tests. Considering the heterogeneity indices, the random-effects model was used to calculate the pooled frequencies. Usually, I2 value <50% suggests significant heterogeneity in the reported effect sizes. Also, Egger's linear regression test was used to further reveal any publication bias and possible asymmetrical data distribution in the selected studies.
MDR, multidrug resistant.
The publication bias was evaluated using the Funnel plot (Fig. 3). Egger's linear regression test was used to further reveal any publication bias and possible asymmetrical data distribution in the selected studies. No publication bias was observed according to Egger's linear regression test (p = 0.00). Subgroup analysis based on the type of biofilm showed that the combined rates of potent, moderate, and weak biofilms were 51% (95% CI: 37.4–64.4), 29.2% (95% CI: 20.9–39.1), and 25.4% (95% CI: 11.5–47.2), respectively. On the other hand, 51%, 29.2%, and 25.4% of P. aeruginosa isolates were potent, moderate, and weak biofilm producers.
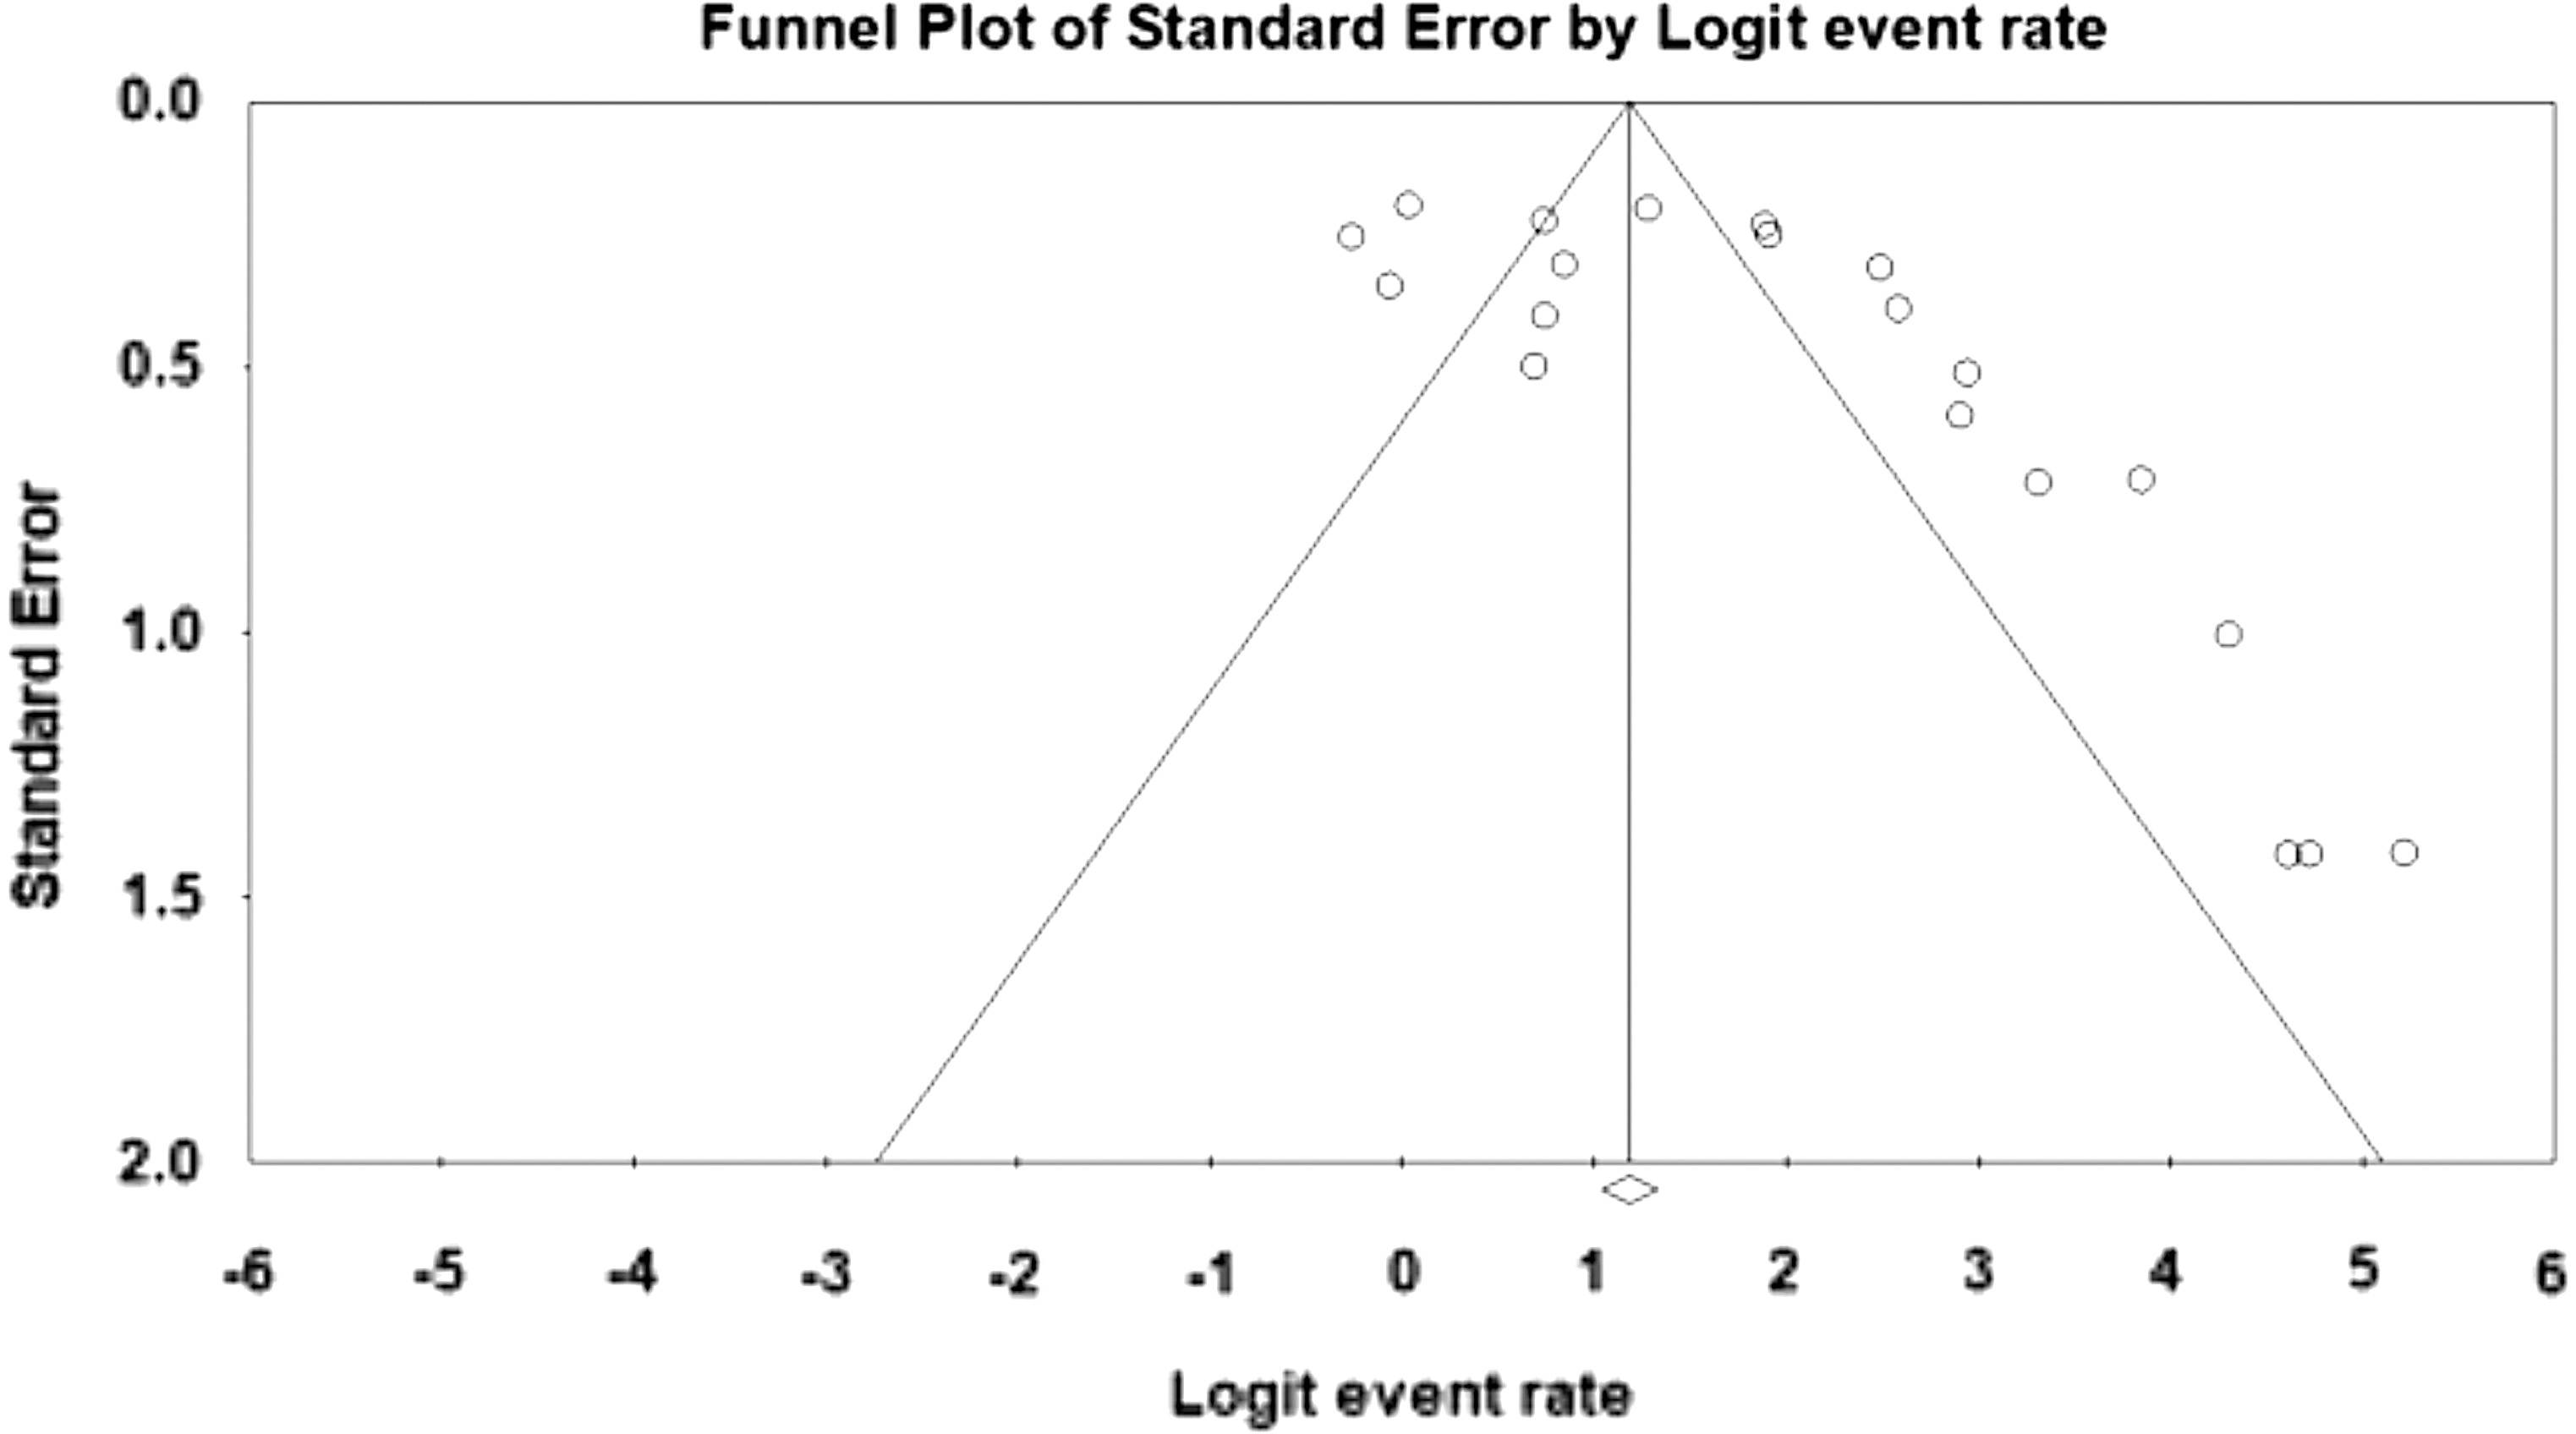
Funnel plot of meta-analysis on the biofilm formation rate in Pseudomonas aeruginosa isolated from clinical samples. A funnel plot is a scatterplot study precision. It is used primarily as a visual assistance for discovering bias or systematic heterogeneity. A symmetric inverted funnel shape arises from a “well-behaved” data set, in which publication bias is unlikely. An asymmetric funnel indicates a relationship between publication bias and study precision. This suggests the possibility of either publication bias or a systematic difference between studies of higher and lower precision (typically “small study effects”).
Biofilm-related genes
The pooled prevalence of laslR, algD, algU, ppyR, and pelF genes was 93.6% (95% CI: 88.1–96.6), 91.4% (95% CI: 80.8–96.4), 89.3% (95% CI: 85.2–92.3), 98.7% (95% CI: 96.5–99.6), and 93% (95% CI: 82.7–97.3), respectively. The frequencies of other biofilm-related genes have been demonstrated in Table 2. The combined prevalence of MDR P. aeruginosa isolates was obtained as 66.9% (95% CI: 42–84.9). As shown in Table 3, the highest pooled rates of antibiotic resistance were against piperacillin/tazobactam, gatifloxacin, ceftriaxone, and carbenicillin with rates of 90% (95% CI: 98–99.9), 87.2% (95% CI: 75–93.9), 80.9% (95% CI: 53.3–94), and 80.5% (95% CI: 32.4–97.3), respectively. Also, the lowest antibiotic resistance rates were against colistin, polymyxin B, and tigecycline with rates of 2.4% (95% CI: 0.3–16.6), 3.1% (95% CI: 0.5–16.6), and 5% (95% CI: 0.3–48.3), respectively. A correlation was observed between biofilm formation and antibiotic resistance in 10 out of 20 included studies in this review.
Subgroups Analysis for Antibiotic Resistance in Pseudomonas aeruginosa Isolated from Clinical Samples
Discussion
Our study showed that the rate of biofilm formation by P. aeruginosa isolates from Iranian patients varied from 43.5% to 99.5% in different locations of Iran. Overall, the pooled ratio of biofilm formation was calculated as 86.5%. In comparison, Abidi et al. reported that most of P. aeruginosa isolates from contact lenses of Karachi-Pakistan patients could form biofilms, in which the biolfilm production was significantly higher than MDR. 32 In a study by Senturk et al. in Turkey, 78% of P. aeruginosa isolates from patients with urinary tract infection produced biofilm. 33 In comparison with our study, several studies have also observed lower rates of biofilm formation by P. aeruginosa, including Prince et al. in the United States (28.6%) 34 and Kádár et al. in Hungary (23.3%). 35 In another report by Hou et al. in China, none of 29 P. aeruginosa isolates recovered from the Ophthalmology ward-produced biofilm. 36
Several intracellular signaling pathways are involved in the induction of transcription factors that activate biofilm-related genes. 37 In our study, the pooled frequencies of lasIR, algD, algU, ppyR, and pelF genes were 93.6%, 91.4%, 89.3%, 98.7%, and 93%, respectively. In the study of Hou et al. in which no P. aeruginosa isolate produced biofilm, 31% of the isolates expressed the pslA gene. 31 Zaranza et al. reported the prevalence of algD gene as 39% in Brazil. 38 Another study conducted by Stehling et al. in Brazil reported the prevalence of algD and algU genes as 100% and 25%, respectively. 39 Mitov et al. in Bulgaria described that algD and lasB genes were expressed in 91.1% and 100% of P. aeruginosa isolates, respectively. 40 Also, Wolska and Szweda found that the algD gene was expressed in 93.5% of P. aeruginosa isolates. 41
Biofilm formation is one of the several mechanisms participating in antibiotic resistance of P. aeruginosa. In our study, the combined prevalence of MDR P. aeruginosa was reported as 66.9%, of which the highest pooled antibiotic resistance was against piperacillin/tazobactam with a resistant rate of 90%. In addition, the lowest resistance rate was observed against colistin (2.4%). Gill et al. demonstrated that 50% of P. aeruginosa isolates from ICU were MDR with the maximum and minimum resistance rates against aminoglycosides (88%) and monobactams (2%), respectively. 42 The findings of Khan et al. from Pakistan showed that 30% of P. aeruginosa strains were MDR with the highest resistance rate against cefuroxime and cefixime (each with 100%) and the lowest resistance rate against amikacin (10%). 43 Gomila et al. in their study in a public hospital in Spain demonstrated that 21.4% of P. aeruginosa isolates were MDR. 44 In the recent study, maximum resistance was observed against ceftazidime and cefepime (nearly 90%), while all of the isolates were sensitive to colistin. 44 Du et al. further reported the highest resistance rate against ampicillin and chloramphenicol (100%) and the lowest against ceftazidime (38%). 45 The European Antimicrobial Resistance Surveillance Network (EARS-Net) in 2015 reported an increasing trend for resistance against piperacillin/tazobactam during 2011–2015, with the highest resistance related to piperacillin/tazobactam (36.1%) and levofloxacin (36.6%), and the lowest (1%) was against colistin in European hospitals. Similarly, resistance to piperacillin/tazobactam, levofloxacin, and colistin was reported as 27.1%, 29.5%, and 1.1%, respectively in the U.S. hospitals.46,47 Overall, our findings were in accordance with previous reports showing relatively low resistance of P. aeruginosa strains against colistin. Therefore, this antibiotic can be appropriate to treat hospital infections caused by P. aeruginosa, especially in patients with the weak immune systems such as patients in the burn unit.
A correlation was found between biofilm formation and antibiotic resistance in 10 out of 20 studies included in this review. This observation indicates that biofilm formation increases the resistance rate and facilitates the chronicity of the infection. In some of these studies, it was reported that biofilms may directly confer resistance against specific antibiotics. In accordance, Banar et al. also noticed that although some P. aeruginosa strains were resistant to ceftazidime in biofilm form, they were susceptible to this antibiotic in the planktonic form. 23 Also, Hemati et al. reported a significant correlation between biofilm formation and the minimum inhibitory concentration (MIC) values of ceftazidime, meropenem, and amikacin. 48 MIC is the lowest concentration of a chemical, usually a drug, which prevents visible growth of a bacterium or bacteria. 49 Out of studies reviewed here, six observed higher rates of biofilm formation, especially the potent subtype, among MDR P. aeruginosa strains. Similarly, Zaranza et al. reported that biofilm formation protected bacteria against the host's immune system and antibiotics. 38 Others also showed that biofilm formation reduced the efficacy of administrated antibiotics.50–52
This study showed that biofilm formation was higher in MDR than non-MDR P. aeruginosa strains. Generally, a significant correlation was observed between biofilm formation and antibiotic resistance in P. aeruginosa retrieved from Iranian patients’ clinical samples. Some studies did not highlight a correlation between biofilm formation and antibiotic resistance, suggesting the involvement of other resistance mechanisms such as efflux pumps, altered outer membrane permeability, toxin/antitoxin systems, and the expression of β-lactam resistance genes. 53 The increasing use of antibiotics and rising numbers of invasive procedures, together with the enhancement of intrinsic and acquired resistance mechanisms of P. aeruginosa, cause the evolution of MDR strains of P. aeruginosa in clinical centers. 54 The intrinsic resistance comprises reductions in membrane permeability, efflux mechanism pumping the antimicrobial agents outside the cell wall, and production of inactivation enzymes. 55 Mutational changes or the acquisition of resistance mechanisms through horizontal gene transfer during chemotherapy are the routine ways of acquired resistance. 56
Biofilm formation can enhance antibiotic resistance in P. aeruginosa, which in turn leads to the chronicity and difficulty in the treatment of the infection, as well as longer hospital stay and higher therapeutic costs, especially in immunocompromised patients. 57 Persistence of infection and the emergence of resistance during antibiotic therapy have been shown to negatively affect patient outcomes. Carmeli and et al. showed that emergence of resistance (at least a fourfold increase in MIC compared to baseline) had significant effects on both mortality and length of hospital stay. 58 Also, Centers for Disease Control and Prevention (CDC) reported that emergence of resistance was related to an average adjusted increase of about 6 days in the length of hospital stay. Briefly, patients who suffered from infection with MDR isolates of P. aeruginosa usually have increased mortality and morbidity. 59
This review from Iran is helping in knowing the antibiotic resistance pattern and consequently prescribing the suitable antimicrobial agents for the treatment of infection caused by P. aueroginosa in clinical settings. Also, data obtained regarding the combined prevalence of biofilm-related genes, and the association between biofilm formation and antibiotic resistance, can provide us with comprehensive information in this area. Certainly, the information, in this case, can help us to take preventive measures.
It has been suggested that using effective antimicrobial agents such as plant extracts along with antibiotics can increase their efficacy by generating a synergistic effect. 60 Also, applying complementary pharmaceuticals alongside with antibiotics is recommended in patients with MDR P. aeruginosa infections to induce virulence genes and reinforce therapeutics’ efficacies. 61
Incorporating unpublished data was not possible in this review, which was the main limitation of our study. Also, in cases of missing data, we did not contact the authors of studies for further clarity.
In conclusion, this study showed that biofilm formation was higher in MDR P. aeruginosa than non-MDRs. Also, a significant correlation was observed between biofilm formation and antibiotic resistance. Regarding the multifaceted etiology of antibiotic resistance and a steady increase in its prevalence and spread worldwide, more frequent outbreaks of infections resulting from MDR isolates are expected. 62 Therefore, using multitargeted and combinational therapies (i.e. antimicrobial agents such as plant extracts along with antibiotics) is useful to increase the efficacy of drugs by generating synergistic effects against pathogens.
Footnotes
References
Supplementary Material
Please find the following supplemental material available below.
For Open Access articles published under a Creative Commons License, all supplemental material carries the same license as the article it is associated with.
For non-Open Access articles published, all supplemental material carries a non-exclusive license, and permission requests for re-use of supplemental material or any part of supplemental material shall be sent directly to the copyright owner as specified in the copyright notice associated with the article.