
Abstract
Tuberculosis drug resistance (DR) is a global problem that is not fully elucidated. Previously, overexpression of esxG and esxH genes was reported in a multidrug-resistant (MDR) Mycobacterium tuberculosis isolate compared with a reference H37Rv strain. To evaluate the roles of esxG and esxH in DR, analysis of their regulatory and coding sequences in sensitive and resistant strains was performed, and the expression levels of their transcriptional regulators IdeR, Zur, and MntR were evaluated. esxG and esxH were expressed heterologously using mycobacterial constructs, and the orthologs Msmeg_0620 and Msmeg_0621 were attenuated in Mycobacterium smegmatis by antisense knockdown. We found no differences in the regulatory and coding sequences of esxG and esxH between the sensitive strain and the MDR isolate. Expression analysis of transcriptional regulators showed that ideR was upregulated in isoniazid (INH)-resistant isolates; in addition, growth inhibition of the M. smegmatis strain was observed in the presence of rifampicin (RIF) and INH when esxG and esxH were expressed heterologously, while faster growth in the presence of RIF was observed when the orthologs were attenuated. In conclusion, the expression of esxG and esxH altered the growth of Mycobacterium in the presence of INH and RIF, suggesting a potential association with DR.
Introduction
Tuberculosis (
Drug resistance (DR) in M. tuberculosis has been associated with specific mutations. 5 However, other molecular mechanisms affect drug activity; these include cell wall thickness, genetic variability among strains, and differential expression of efflux pump and ribosomal genes.6–8 In a previous study, we observed an overexpression of esxG and esxH genes in the first-line drug-resistant M. tuberculosis strain compared with the first-line drug-susceptible strain 9 and later the esxG and esxH expression was evaluated among 24 clinical isolates with different drug-susceptible profiles. The overexpression of these genes was observed in some drug-resistant clinical isolates, but high variability among the isolates was revealed by quantitative reverse transcription PCR (RT-qPCR) analysis. 10 esxG and esxH encode the substrates for the Esx-3 type VII secretion system11,12; these substrates form an immunogenic heterodimer that promotes pathogenesis. Consequently, esxG and esxH are subjects of interest and have been investigated as vaccine candidates.13–15 The expressions of esxG and esxH are mediated primarily by IdeR, Zur, and MntR transcriptional regulators, which in the presence of iron, zinc, and manganese, respectively, bind to their regulatory sequences, thereby downregulating these genes. The aim of this study was to elucidate the role of esxG and esxH in drug-resistant M. tuberculosis, and to evaluate the effects of the IdeR, Zur, and MntR regulators on esxG and esxH expression.
Materials and Methods
Mycobacterial strains
Mycobacterium tuberculosis H37Rv (ATCC® 27294™), a reference strain sensitive to first-line drugs, and clinical isolates with different DR profiles 10 were included in this study. In addition, 22 M. tuberculosis clinical isolates and the clinical CIBIN:UMF:15:99 MDR isolated were selected according to their phenotypic susceptibility profiles to first-line drugs. These isolates were obtained from a repository located in the Centro de Investigación Biomédica del Noreste from Instituto Mexicano del Seguro Social (Table 1). For bacterial transformation, Mycobacterium smegmatis mc 2 155 (ATCC 700084™) and Escherichia coli DH5α strains were used.
Phenotypic Characterization of Drug Susceptibility to First-Line Drugs of Mycobacterium tuberculosis Clinical Isolates
These clinical isolates are also resistant to streptomycin.
EMB, ethambutol; INH, isoniazid; PZA, pyrazinamide; RIF, rifampicin.
DNA isolation
Genomic DNA of M. tuberculosis was isolated using the cetyltrimethylammonium bromide method. 9 Genomic DNA of M. smegmatis was isolated using the MasterPure™ DNA purification Kit following the manufacturer's instructions.
DNA sequencing
Regulatory and coding regions were amplified by PCR, and amplification products were purified using the GENECLEAN® Turbo Kit. The regulatory and coding sequences of esxG-esxH and Msmeg_0620-Msmeg_0621 were amplified by PCR under conditions outlined in Table 2. PCR products were analyzed by electrophoresis using 1% (w/v) agarose gel and stained with GelRed® (Biotium, Hayward, CA), and the purity and concentration of DNA were estimated using a NanoDrop spectrophotometer (Thermo Scientific, Wilmington, DE). For DNA sequencing, a 3130xl Genetic Analyzer and the BigDye™ Terminator v3.1 Cycle Sequencing Kit (Applied Biosystems, Foster, CA) were used. Sequencing was performed to compare regulatory and coding sequences and to verify the sequence fidelity of constructs. Specific primers were designed using Oligo Analyzer 3.1 and Oligo Calc tools (Table 2; Fig. 1). The generated sequences were analyzed using SeqScape v2.7 software, utilizing H37Rv (Gen Bank NC_000962.3) and M. smegmatis mc 2 155 (GenBank CP000480.1) sequences as references.
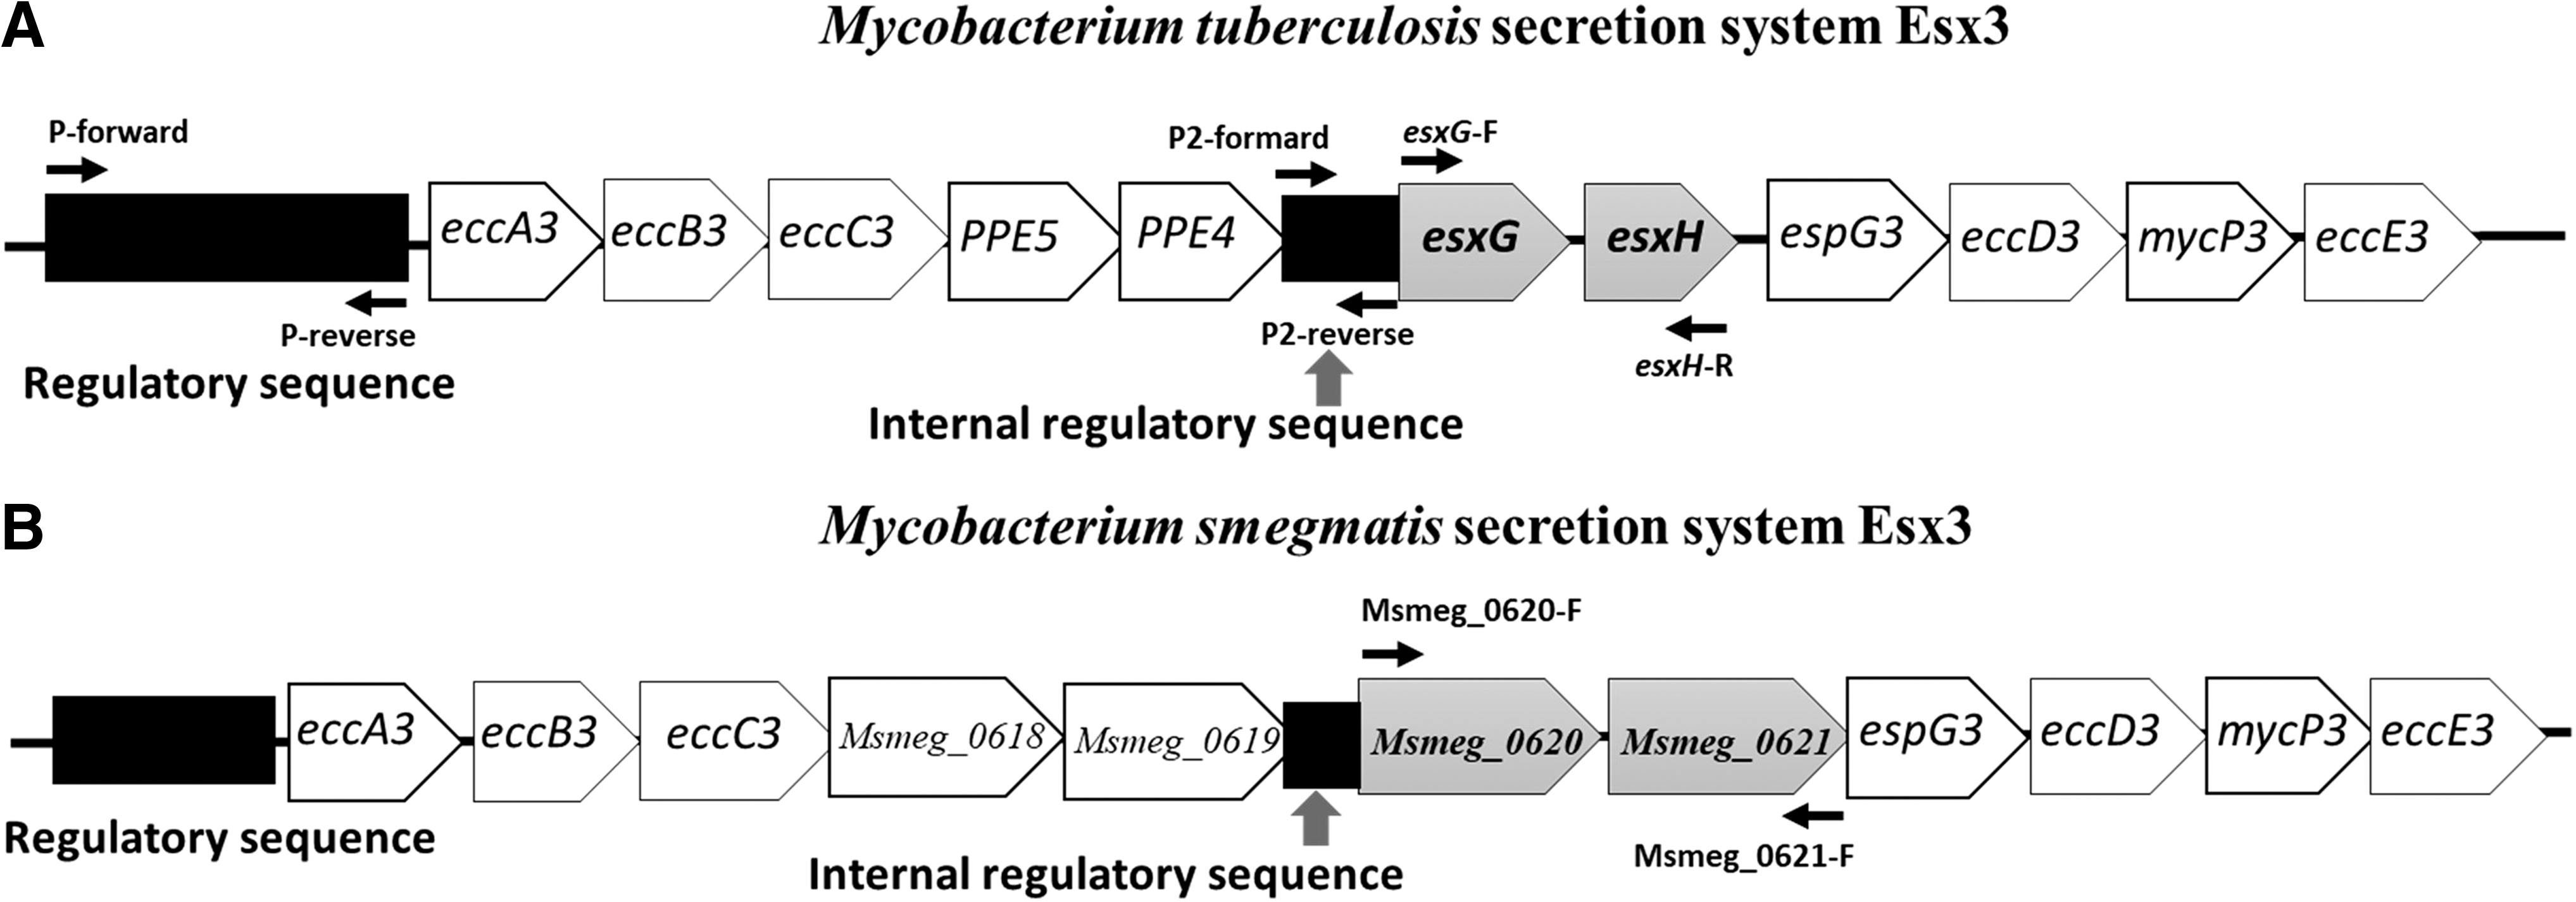
Genomic organization of the Esx3 secretion system of Mycobacteria spp.
Primers Used in This Study
Primers used for sequencing.
Same PCR conditions, except annealing temperature.
F, forward; R, reverse.
RNA isolation and reverse transcription
RNA extraction was performed using the TRIzol (Invitrogen, Carlsbad, CA) reagent and the Fast Prep instrument (MP Biomedicals, Solon, OH) according to the manufacturer's protocol and followed the modifications previously reported. 9 Finally, RNA was treated with DNase I (Invitrogen). The purity and concentration of RNA were estimated using a NanoDrop spectrophotometer and RNA integrity. The synthesis of complementary DNA (cDNA) was carried out using M-MLV reverse transcriptase (Invitrogen) following the manufacturer's instructions. The functionality of cDNA was confirmed by PCR amplification of the constitutive rrs gene of M. tuberculosis and the sigA gene of M. smegmatis and visualized on 1% agarose gel stained with GelRed.
Gene expression by RT-qPCR
Relative expressions of ideR, zur, and mntR were quantified by RT-qPCR using the H37Rv strain, CIBIN:UMF:15:99, and 22 M. tuberculosis clinical isolates phenotypically characterized for first-line drug susceptibility (Table 1). Expression levels of esxG and esxH were evaluated under similar conditions. 10 Real-time PCRs were carried out in 25 μL volumes in 96-well plates containing 1 × TaqMan Universal PCR Master Mix (Applied Biosystems, Carlsbad, CA), primer/probe mix (Table 3), and 3 μL of cDNA as a template. Amplification was conducted during an initial incubation at 50°C for 1 minute, followed by 95°C for 10 minutes, and then 40 cycles at 95°C for 15 seconds and 60°C for 1 minute using a 7500 Fast Real Time PCR System (Applied Biosystems, Foster City, CA). The dynamic range curve was established for each probe (testing cDNA dilutions from 1:32 to 1:1,024) to determine the assay capability, and the 1:128 sample dilution was selected to perform the assay. Each reaction was conducted with technical triplicates, and threshold values were used for analysis according to the comparative method described by Livak and Schmittgen. 16
Primers and Probes Used in This Study
F, forward; R, reverse.
Mycobacterial mutant constructions
The esxG-esxH M. tuberculosis genes and Msmeg_0620 and Msmeg_0621 M. smegmatis genes were amplified by PCR conditions outlined in Table 2. Amplicons of 614 and 616 bp, respectively, were cloned separately into the pET101/D-TOPO® vector (Invitrogen) to generate Topo-esxG-esxH and Topo-Msmeg_0620-0621. The constructs were linearized using restriction enzyme BamHI and ligated into BamHI-digested pMV261 using T4 DNA ligase (New England Biolabs, Ipswich, MA) at 16°C overnight to generate constructs pMV261-esxG-esxH and pMV261-Msmeg_0620-0621antisense. Escherichia coli DH5α strain was then transformed with the constructs. Colonies containing pMV261 constructs that grew in the presence of kanamycin were further characterized by PCR conditions described in Table 2. Colonies with the sense coding sequence of esxG-esxH genes and the antisense coding sequence of Msmeg_0620-0621 genes were then selected using a PCR-based strategy. The primer pMV261-F in combination with either esxG-F or esxH-R primers was used to confirm the sense sequence; combinations of the primer pMV261-F with either Msmeg_0620-F or Msmeg_0621-R primers were used to confirm the antisense sequence (Table 2).
Transformation of M. smegmatis
M. smegmatis mc 2 155 (ATCC 700084™) strain was cultivated in 7H9 liquid medium containing 10% ADC (albumin, dextrose, and catalase) and 0.05% Tween 80, then harvested at log phase, incubated on ice for 1 hour, then washed three times, and resuspended in 10% glycerol. Subsequently, 250 ng of plasmid DNA was added to M. smegmatis mc 2 155 cells. Samples were placed into Bio-Rad (Hercules, CA) cuvettes and electroporated with a Bio-Rad electroporator at 2.5 kV, 1,000 Ohms, and 25 μFD. The cells were then washed out of the cuvette with 1 mL of 7H9 containing 10% ADC and 0.05% Tween 80 and incubated for 2 hours at 37°C. Transformant cells were plated onto 7H10 solid medium containing 10% OADC (oleic acid, albumin, dextrose, and catalase) and kanamycin (20 μg/mL), and incubated at 37°C for 3 days. Colonies were screened by PCR using esxG-F and esxH-R primers for esxG-esxH amplification, and Msmeg_0620-F and Msmeg_0621-R primers for Msmeg_0620 and Msmeg_0621 amplification (Table 2).
Semiquantitative PCR
For semiquantitative PCR assays, cDNA synthesized from the M. smegmatis strain transformed with pMV261-esxG-esxH, pMV261-Msmeg_0620-0621 antisense, or pMV261 was used to amplify esxG-esxH and Msmeg_0620-Msmeg_0621 genes, with sigA used as the internal control (primers are listed in Table 2). Amplification fragments visualized in 1% agarose gels were quantified using ImageJ software version 1.52a.
Protein extraction and Western blot assays
To analyze the expression and secretion of EsxG and EsxH by M. smegmatis-pMV261-esxG-esxH, protein extraction was performed as previously described. 17 Transformed strains were grown to log phase in 100 mL of Luria-Bertani media, then cultures were transferred to 50 mL conical tubes, pelleted by centrifugation for 20 minutes at 2,000 × g at 4°C, and washed twice with equal volumes of phosphate-buffered saline 1 × . The bacterial pellets were lysed using Lysing Matrix B tubes containing 0.1 mm silica beads with protein extraction buffer (50 mM Tris-HCl pH 7.5, 5 mM ethylenediamine tetraacetic acid (EDTA), 0.6% sodium dodecyl sulfate (SDS), 10 mM NaH2PO4, and a protease inhibitor cocktail). The supernatants were collected and filtered twice through 0.22 μm filters, followed by a concentration step with Amicon® Ultra-15 10 K Centrifugal Filter Units (Merck Millipore, Tullagreen, Carrigtwohill, Co., Cork, Ireland). An equal volume of protein extraction buffer with a protease inhibitor was added to the concentrated supernatant. SDS-sample buffer (Santa Cruz Biotechnology, Inc., Dallas, TX) was added to each sample, followed by heating at 95°C for 5 minutes. Protein extracts were separated by SDS-PAGE (polyacrylamide gel electrophoresis), transferred onto 0.2 μm polyvinyl difluoride (PVDF) membranes (Bio-Rad), and probed with EsxG or EsxH rabbit antibodies. Proteins were detected with horseradish peroxidase-conjugated anti-rabbit antibody (1:20,000) and visualized with the ECL™ Western Blotting Analysis System (GE Healthcare, Chicago, IL).
Minimum inhibitory concentration determinations and growth curves
The resazurin microtiter assay (REMA) plate method was performed as previously described 18 to determine the minimum inhibitory concentrations (MICs) for the first-line drugs RIF, INH, and EMB. A 96-well microtiter plate was prepared with serial twofold dilutions of each drug in 100 μL of 7H9 medium at concentrations from 50 to 0.05 μg/mL for RIF, from 256 to 0.25 μg/mL for INH, and from 8 to 0.007 μg/mL for EMB. M. smegmatis cultures were grown in 7H9 medium containing 10% ADC until a turbidity equivalent to 2.7 McFarland turbidity standards was reached. Inoculum was prepared by diluting this culture 1,000 times. The first column of the 96-well microtiter plate was filled with 100 μL of the double required drug concentration, and the remaining wells were filled with 50 μL of 7H9 medium containing 10% ADC kanamycin (20 μg/mL), and then with serial dilutions from the first to penultimate columns. The last column was a control without drug. Finally, each well was inoculated with 50 μL of the diluted M. smegmatis inoculum with 2.77 × 10⁴ bacteria/mL. Tubes with medium without inoculum were included as controls; each assay was carried out with technical duplicates. The plates were incubated at 37°C during 40 hours with constant agitation. After 40 hours of incubation, 30 μL of resazurin dye (0.2 mg/mL) was added to each well and the plates were incubated for an additional 6 hours. MICs were determined as the lowest concentration of antibiotic at which there was no visible growth of M. smegmatis indicated by resazurin dye color conversion. 19
To further evaluate bacterial growth in the presence of drug, growth kinetic curves of transformant strains in liquid media with first-line drugs were determined as follows: M. smegmatis strains were grown in 7H9 medium containing 10% ADC until a turbidity equivalent to 1.0 McFarland standard was reached, then 10 μL (3.08 × 10⁵ colony-former unit [CFU]) of the culture was inoculated in 1 mL of 7H9 media containing 10% ADC, kanamycin (20 μg/mL) as selection drug, and either RIF or INH at concentrations of 0.8 and 1.6 μL or 8 and 16 μL, respectively. Liquid cultures were incubated at 37°C with constant agitation, and the mycobacterial growth was measured in McFarland units every 3 for 27 hours using the equipment DensiCHEK™ Plus (bioMérieux, SA).
Statistical analyses
Data obtained by genetic expression assays of ideR, zur, and mntR in M. tuberculosis clinical isolates were analyzed as follows: first, to determine data distribution, a Shapiro–Wilk test was carried out. Kruskal–Wallis multiple comparison was initially used to contrast the clinical isolates in eight groups according to their drug susceptibility global phenotype. Subsequently, the Mann–Whitney U test was performed to compare resistant and susceptible isolates for each first-line drug. Afterward, a correlation between the expression levels of esxG, esxH, and their transcriptional regulators ideR, zur, and mntR was calculated by the Pearson's correlation test. To analyze growth kinetic results of M. smegmatis strains in the presence of first-line drugs, repeated-measures ANOVA was performed to compare the mean scores of the curves. Results were considered significant when p ≤ 0.05. SPSS v. 20 software was used to perform all statistical analyses.
Results
Comparison of sequences and phylogenetic relationship
To determine whether the previously reported differential expression of esxG and esxH 9 could be caused by the effect of mutations, coding and regulatory sequences of esxG and esxH were obtained and compared between the sensitive strain and the multidrug-resistant isolate. No differences were found among the regulatory regions, which harbor binding sites for IdeR, Zur, and MntR, and the coding sequences for esxG and esxH (data not shown). Afterward, we compared coding sequences of these genes among different Mycobacterium spp. strains using the maximum likelihood method for each nucleotide and amino acid sequences (data not shown). We found no differences between the nucleotide and amino acid sequences of the H37Rv-sensitive strain and the MDR CIBIN:UMF:15:99 isolate, nor among other species of the Mycobacterium tuberculosis complex (MTBC). However, we observed more diversity among nontuberculous species compared with MTBC species.
Comparison of expression levels of regulators among M. tuberculosis clinical isolates
To clarify whether the differential expression levels of esxG and esxH between strains can be caused by the expression levels of their regulators, we determined the expression level of ideR, zur, and mntR in the reference H37Rv strain, CIBIN:UMF:15:99 and in 22 M. tuberculosis clinical isolates previously characterized. Association studies were performed comparing relative gene expression to the susceptibility profile with first-line drugs using nonparametrical statistical tests. There were no associations between regulator gene expression and the complete phenotypic drug susceptibility clustering. Therefore, we proceeded to analyze relative expressions of the regulators for each DR profile using the Mann–Whitney U statistical test. Interestingly, we found 53% of overexpression of ideR (U = 25, p = 0.028) in INH-resistant isolates compared with susceptible isolates to this drug. A trend of mntR overexpression was found in INH-resistant isolates compared with susceptible isolates to this drug (U = 29, p = 0.055). Finally, zur expression was not statistically different between INH-resistant and INH-susceptible M. tuberculosis strains (Fig. 2).

RT-qPCR results of differentially expressed genes in Mycobacterium tuberculosis clinical isolates. Relative expression of ideR
To correlate the genetic expression of esxG and esxH with their regulators ideR, zur, and mntR, Pearson's correlation tests were performed. R2 between 0.70 and 0.89 was considered a strong correlation 20 ; esxG and esxH correlation of expression had an R2 ≥ 0.769 (p < 0.0001). We found the following results: esxG-ideR, R2 = 0.153 (p < 0.0590); esxG-zur, R2 = 0.173 (p < 0.0432); esxG-mntR, R2 = 0.320 (p < 0.0040); esxH-ideR, R2 = 0.040 (p < 0.3458); esxH-zur, R2 = 0.075 (p < 0.0194); and esxH-mntR, R2 = 0.164 (p < 0.0497) (Fig. 3). In all cases, the correlation of the relative expressions of each gene with the known regulator was low, suggesting either an indirect regulatory mechanism or the involvement of other regulatory factors.

Correlation of expression for esxG and esxH genes with ideR, zur, and mntR regulators in clinical isolates. Pearson's correlation test. esxG and esxH
Effect of heterologous expression of esxG and esxH in M. smegmatis
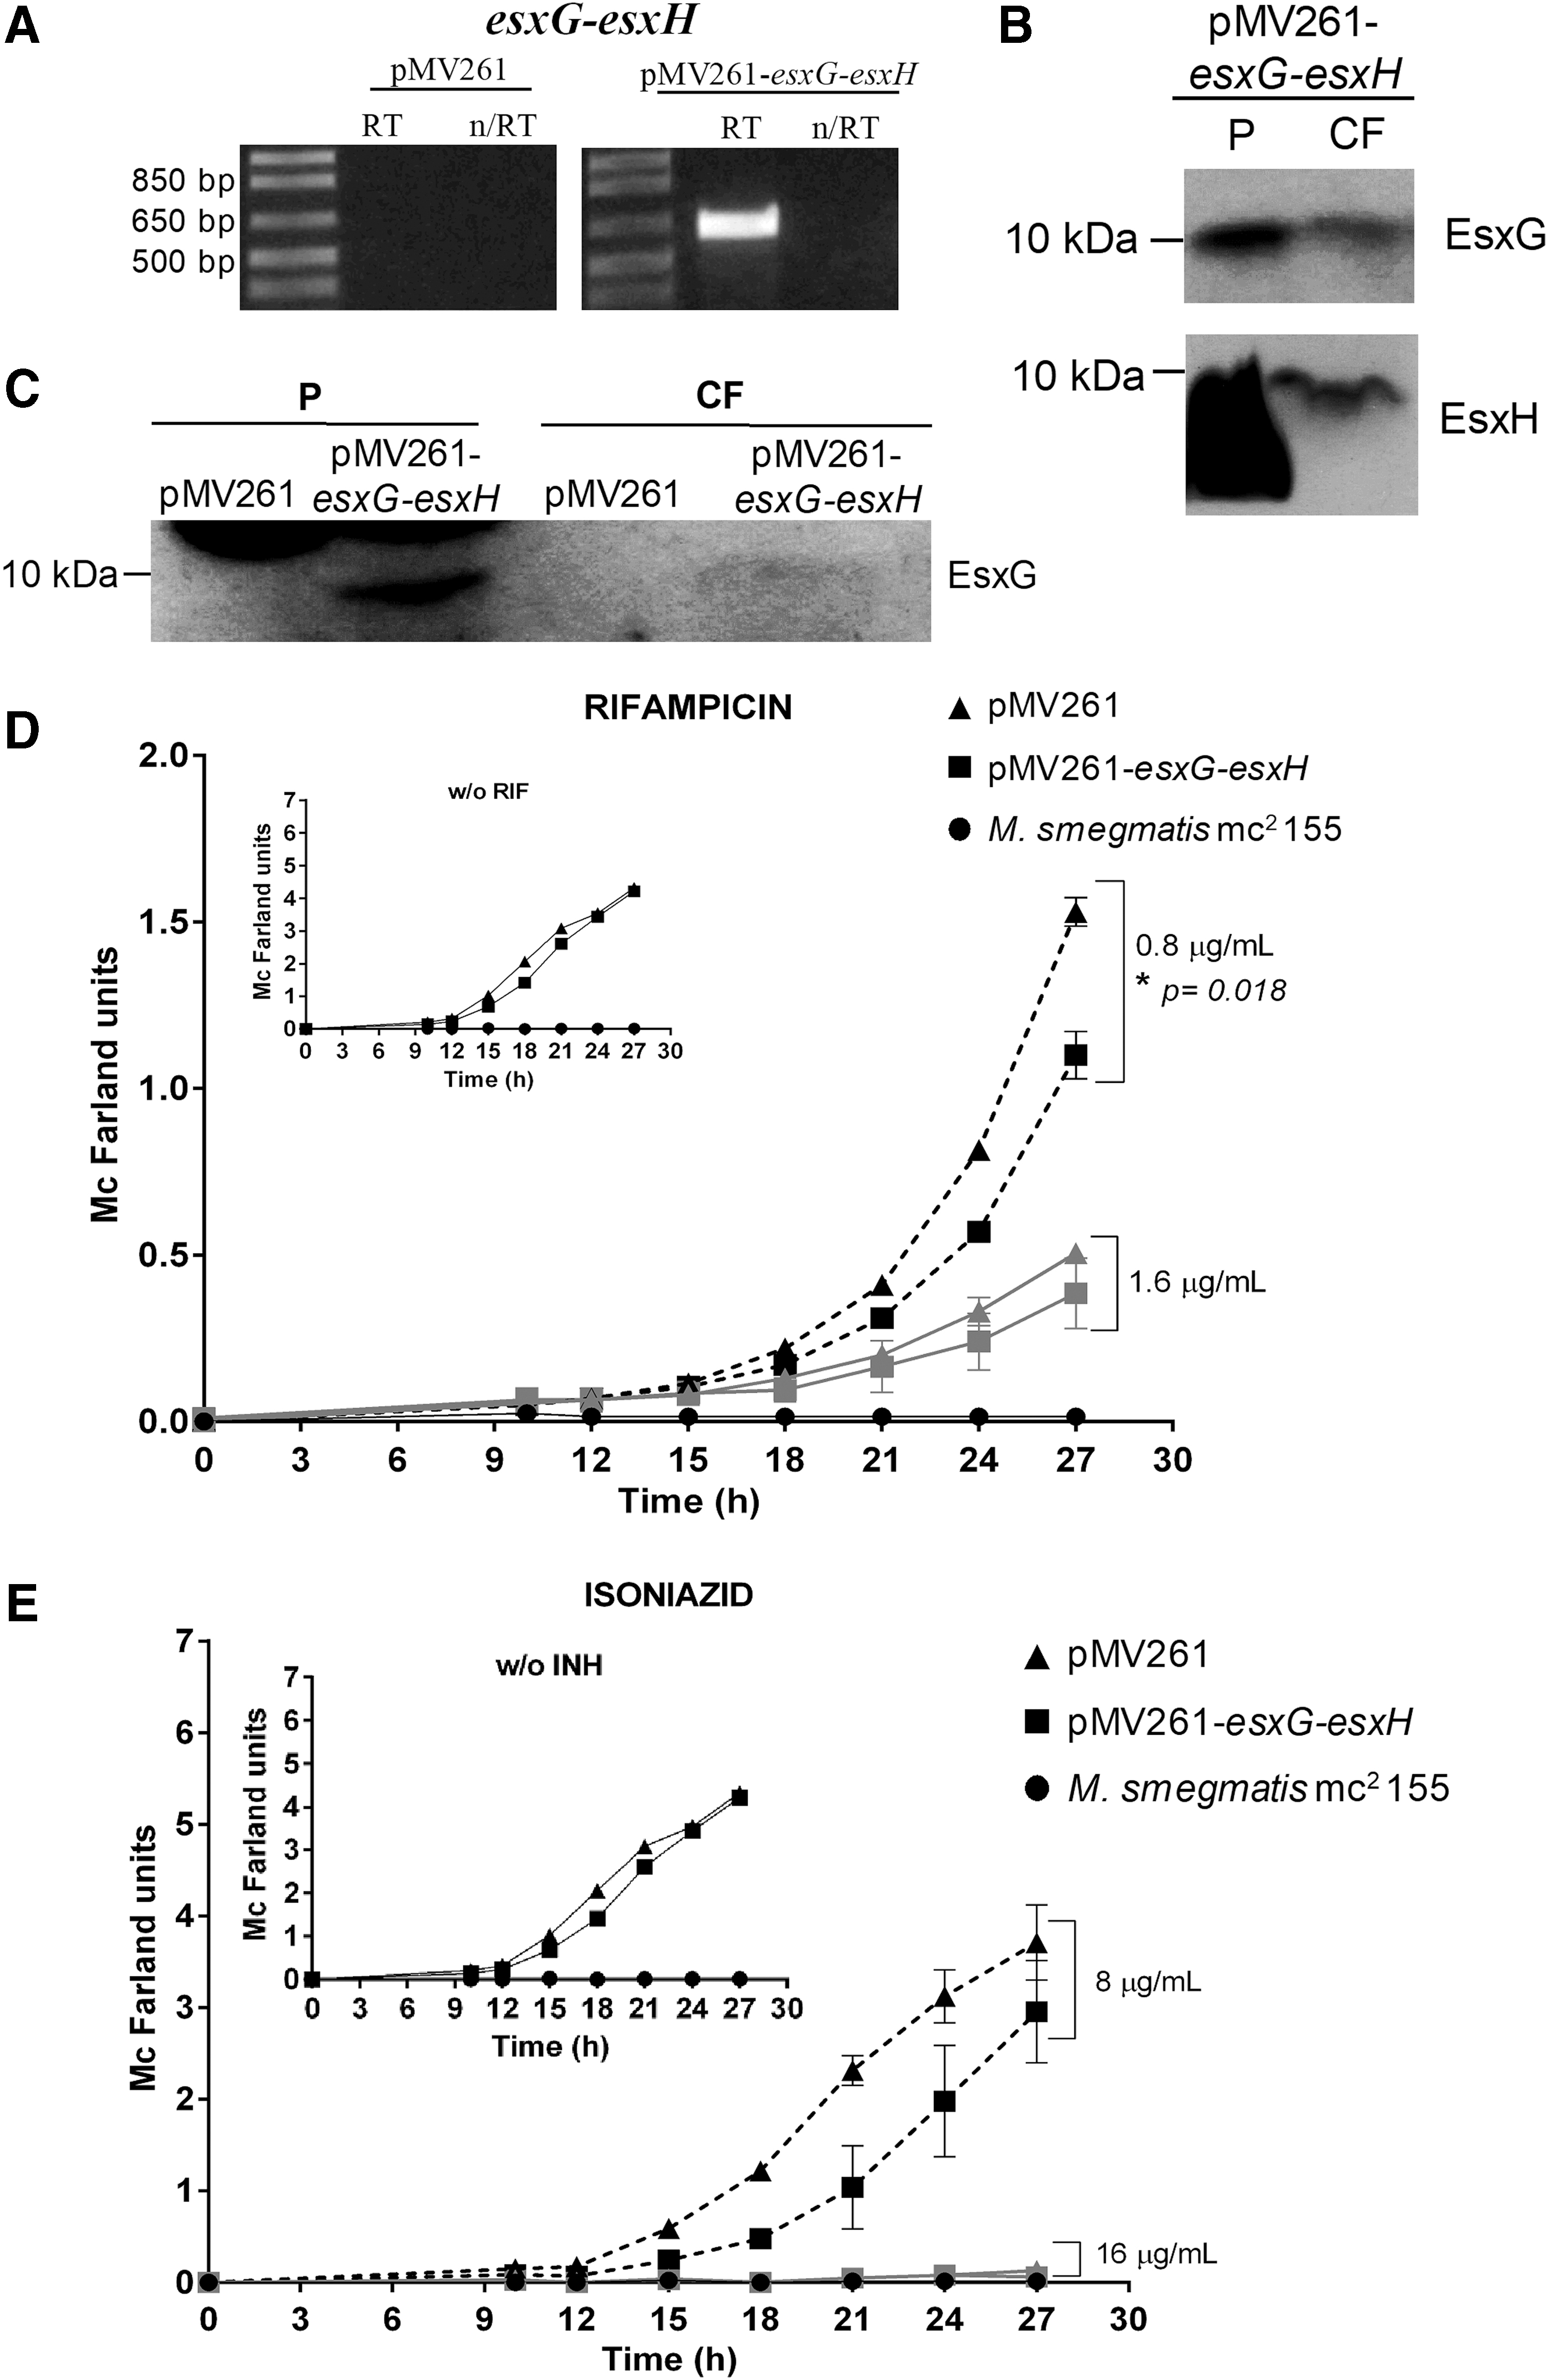
To express the EsxG and EsxH proteins in an M. tuberculosis surrogate, we constructed vectors harboring the esxG and esxH M. tuberculosis genes using the mycobacterial pMV261 plasmid. First, we demonstrated the ectopic expression of esxG and esxH in M. smegmatis using RT-PCR assays (Fig. 4A). Western blot assays were performed to confirm the expression of EsxG and EsxH proteins in both cell lysate (P) and culture filtrate (CF) of an M. smegmatis pMV261-esxG-esxH transformant (Fig. 4B), in which a band of ∼10 kDa was observed, corresponding to the molecular weight of the EsxG protein (9.8 kDa), which was undetectable in the control strain (M. smegmatis-pMV261) (Fig. 4C). Furthermore, the presence of EsxH in the CF of the pMV261-esxG-esxH strain was observed (Fig. 4B). Based on these results, we conclude that both proteins were produced and secreted by the M. smegmatis pMV261-esxG-esxH transformant.
Evaluation of esxG-esxH overexpression in resistance to first-line drugs in Mycobacterium smegmatis strains. Expression profile of esxG-esxH in M. smegmatis strains detected by RT-PCR and Western blot. Representative 1% agarose gel of RT-PCR products corresponding to 614 bp with RT and without the enzyme (n/RT)
To determine the effect of the heterologous expression of esxG and esxH in the resistance to first-line antitubercular drugs in M. smegmatis, we determined the MICs for RIF, INH, and EMB by the REMA plate method as previously described. The MIC for PZA was not determined, because M. smegmatis has intrinsic resistance to this drug. 18 We observed decreased tolerance to RIF and INH when esxG and esxH genes were expressed. The MICs of RIF and INH changed from 1.6 to 0.8 μg/mL and from 32 to 16 μg/mL, respectively (data not shown). No effect on growth was observed when cultures were exposed to EMB. To confirm this finding, bacterial growth kinetic assays in the presence or absence of RIF and INH were performed (Fig. 4D, E) that demonstrated inhibited growth (29%) of the M. smegmatis pMV261-esxG-esxH transformant in liquid cultures with RIF at 0.8 μg/mL. A significant difference (F = 55.226, p = 0.018) between the transformant and control strains was observed. In conclusion, heterologous expression of esxG and esxH modified the growth rate of the M. smegmatis-esxG-esxH transformant in the presence of RIF and INH.
Effect of knockdown of esxG and esxH orthologous in M. smegmatis
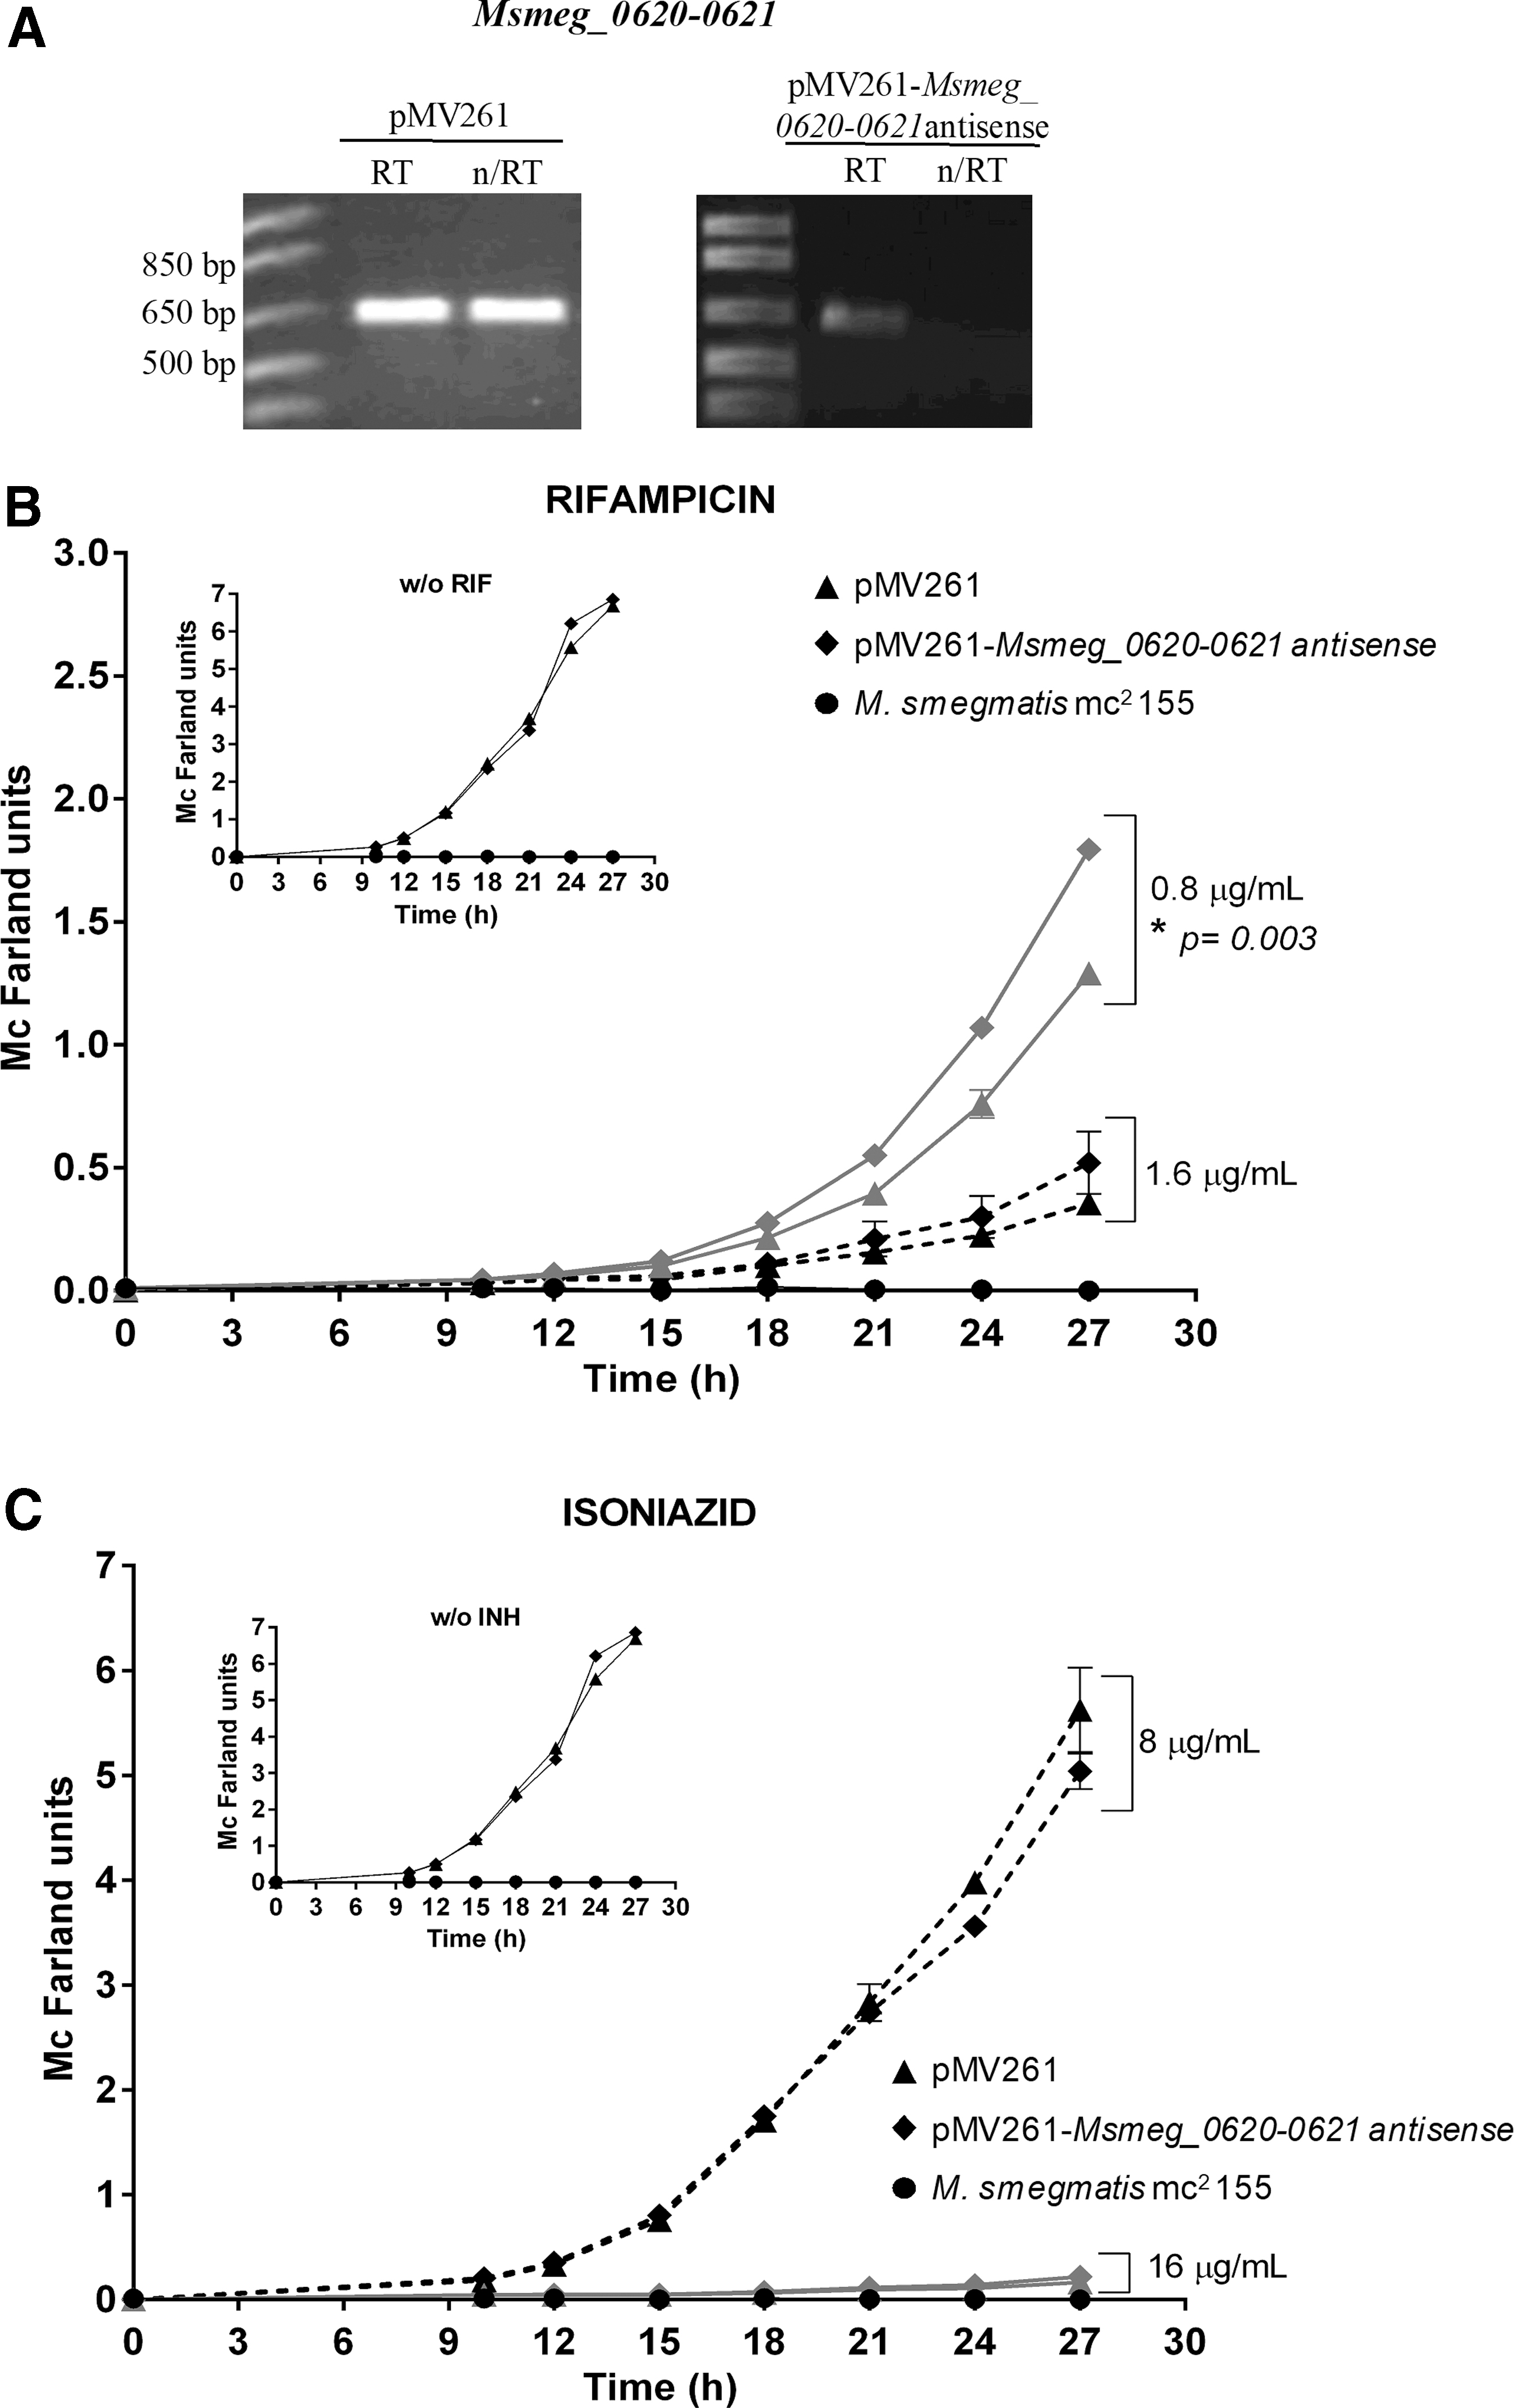
To inhibit the expression of orthologous genes of esxG and esxH in an M. tuberculosis surrogate, we constructed vectors harboring the Msmeg_0620 and Msmeg_0621 genes in an antisense orientation. Constructs were stably transformed in the M. smegmatis mc 2 155 strain. To demonstrate the downregulation of these genes, a semiquantitative PCR was performed using sigA expression as an internal control. We found a 67% reduction of expression in the strain expressing the antisense orientation of Msmeg_0620 and Msmeg_0621 compared with the control containing only the empty vector pMV261 (Fig. 5A). This result demonstrated that the orthologous genes to esxG and esxH in M. smegmatis were inhibited effectively.
Evaluation of Msmeg_0620-0621 inhibition of resistance to first-line drugs in Mycobacterium smegmatis strains. Expression profile of Msmeg_0620-0621 genes in M. smegmatis strains detected by RT-PCR, representative 1% agarose gel of RT-PCR products corresponding to 616 bp
To determine the effect of decreased expression of the esxG and esxH orthologous genes in the resistance to first-line antitubercular drugs in M. smegmatis, REMA and growth kinetic assays were conducted. We found increased resistance to INH in the pMV261-Msmeg_0620-0621 antisense transformant using REMA, with the MIC increasing from 16 to 32 μg/mL compared with the control pMV261 transformant, this phenomenon was not observed in growth kinetics at the same drug concentrations (Fig. 5C). However, growth kinetics in the presence of RIF at 0.8 μg/mL disclosed a significantly faster growth (40%) of the M. smegmatis pMV261-Msmeg_0620-0621 antisense transformant in liquid cultures compared with its control (F = 339.231, p = 0.003) (Fig. 5B). The MIC for EMB was 0.5 μg/mL for both transformants and remained unaltered upon Msmeg_0620-0621 inhibition in M. smegmatis compared with the control (data not shown). There were no observable differences of the growth kinetics of M. smegmatis transformants (either expressing esxG-esxH or repressing Msmeg_0620-0621) compared with the pMV261 control in the absence of drugs, suggesting that heterologous expression or inhibition of these genes does not alter in vitro growth.
No alteration in growth was observed due to vector pMV261, because the same growth was observed in the three transformant strains (pMV261, pMV261-esxG-esxH, and pMV261-Msmeg_0620-0621 antisense) in the presence of kanamycin (selection marker), and in the wild strain M. smegmatis mc 2 155 no growth was observed (Figs. 4D, E, and 5B, C).
Discussion
We have reported the differential expression of several genes in MDR M. tuberculosis compared with a reference strain. Among these genes, esxG and esxH were upregulated in a drug-resistant isolate. 9 Mutations in coding sequences have been associated with DR in M. tuberculosis.21–23 However, we did not find differences in the coding or regulatory sequences of esxG and esxH between the sensitive strain and the MDR isolate. These results support the hypothesis that DR may result from differences in gene expression without sequence alterations, as reported by Yamchi et al., 7 who observed that upregulated efflux pump genes promoted DR without mutations in coding sequences.
We performed molecular phylogenetic analyses of coding sequences and regulatory regions of esxG and esxH among different Mycobacterium spp. (data not shown) and found a high degree of sequence identity between sensitive and resistant M. tuberculosis strains, and among other mycobacteria of the MTBC as well as nontuberculous mycobacteria. These results are concordant with reports that esx3 genes are highly conserved among diverse mycobacterial species.24,25 Mutations of regulatory sequences have been associated with drug-resistant M. tuberculosis; these include mutations in the regulatory regions of ahpC and inhA that confer resistance to INH.26,27 However, we found no differences in the regulatory sequences of esxG and esxH between the sensitive strain and the multidrug-resistant isolate of M. tuberculosis.
Another important aspect of gene regulation is the expression of transcriptional regulators. IdeR, Zur, and MntR transcriptional regulators repress esxG and esxH in M. tuberculosis.28–30 We expected that if esxG and esxH are overexpressed in the MDR isolate compared with a sensitive strain, the repressor genes ideR, zur, and mntR would be downregulated in drug-resistant clinical isolates. However, results of mRNA expression levels of the ideR, zur, and mntR genes showed no significant differences among M. tuberculosis clinical isolates, even when isolates with different global drug susceptibly profiles were compared. This finding suggests alternative mechanisms of esxG and esxH regulation.
Notwithstanding the above, we found that ideR was upregulated in INH-resistant compared with INH-susceptible isolates. The tuberculocidal effect of INH requires its activation by a bacterial catalase encoded by katG 31 ; downregulation of katG increases INH resistance. 32 Rodriguez et al. showed that the expression of katG is iron-dependent, but not directly affected by ideR, even though ideR regulates genes involved in siderophore synthesis and iron storage. 28 ideR upregulation could reduce intracellular iron concentrations to repress katG indirectly, resulting in INH resistance.
The effects of the heterologous expression of esxG-esxH and the attenuation of orthologs Msmeg_0620-0621 on DR were evaluated in M. smegmatis strains. Western blotting showed that EsxG is present in both P and CF, while EsxH was only detected in CF. However, EsxG and EsxH form a 1:1 heterodimer; therefore, they are secreted as a complex.33,34 The secretion of EsxG and EsxH proteins by M. smegmatis is concordant with previous reports that have demonstrated that despite the evolutionary distance between M. smegmatis and M. tuberculosis, the ESX-1 system of M. smegmatis can secrete the EsxA and EsxB proteins of M. tuberculosis paralogous to EsxH and EsxG, respectively, 35 suggesting that substrate recognition is conserved among species. 36 It is important to note that the polyclonal antibodies used in the present investigation to detect EsxG and EsxH M. tuberculosis proteins do not recognize the endogenous homologous proteins of M. smegmatis mc 2 155, as they were not detected in the control pMV261 transformant.
Considering that we observed a slower growth rate of the M. smegmatis-pMV261-esxG-esxH transformant in liquid cultures in the presence of RIF and INH compared with the control transformant, it is possible that the EsxG·EsxH complex has an indirect role in resistance by enhancing the secretion of other proteins, for example, the PE-PPE protein family and other unidentified proteins, such as PPE4, which could remain associated with the cell membrane, or PE11, a cell wall-associated esterase that is associated with EMB, INH, and RIF resistance.34,37,38 Therefore, it will be important to elucidate the function of the target proteins of the EsxG-EsxH complex in DR.
We observed an increase in INH resistance in the pMV261-Msmeg_0620-0621 antisense M. smegmatis transformant compared with the control transformant, in contrast to our expectation of reduced resistance suggested by our previous report that showed overexpression of esxG and esxH in the MDR-TB clinical isolate. 9 This increased INH resistance could be caused by antisense RNA polar effects in 3′ genes of the operon Esx3. These polar effects have been reported previously in studies that utilized antisense RNA. 39 Furthermore, in the M. smegmatis eccD3 mutant, a membrane protein gene of the Esx3 operon (a 3′ gene in the operon; Fig. 1) exhibited a role in maintaining cell wall integrity and permeability; EccD3 might act as a cell wall porin protein that may contribute to INH resistance. 40
We observed no growth of the pMV261-Msmeg_0620-0621 antisense M. smegmatis transformant in the presence of INH at 16 μg/mL during the growth kinetic study, in opposition to the results observed in the REMA assay that suggested strain viability at the same concentration. This contrast may be due to the different conditions of the assays; the incubation time of the REMA assay was 40 hours, compared with the 27-hour incubation during the growth kinetic assay. The exponential phase of M. smegmatis occurs between 12 and 24 hours of incubation, and its stationary phase is observed after 28 hours. 41 Physiologic differences between bacterial growth phases have been documented, for example, during the stationary phase, the expression of iron uptake machinery is inactive, while RNA stability and stress resistance are increased.41,42 Therefore, we suggest that the INH resistance observed at 40 hours may result from phenomena manifested after 27 hours of incubation. Furthermore, variability of results and reproducibility between REMA and other drug susceptibility tests have been documented in previous studies43,44 which report that differences of volume and incubation time may affect MIC results.
Additional studies are required to elucidate the mechanism of this phenomenon by evaluating the interactions of the EsxG-EsxH complex with other intrinsic proteins encoded both within and outside the esx-3 locus, their potential interaction with host cell molecules involved in the infectious process, and if these proteins could be targets of host proteases. 45
In conclusion, our results suggest an effect of EsxG and EsxH expression in mycobacterial RIF and INH resistance.
Footnotes
Acknowledgments
We are grateful to C.P. Gabriela Mendez for the clerical work. We thank Dr. William Jacobs Jr. for providing pMV261 vector and Dr. Brian Weinrick for the constructive criticism of our manuscript. A.L.G.T. and A.B.L. were recipients of CONACyT (no. 462073 and 461983) and IMSS (no. 97205588 and 97205586) scholarships.
Disclosure Statement
The authors declare no conflict of interest.
Funding Information
This work was supported by Instituto Mexicano del Seguro Social (FIS/IMSS/PROT/G15/1457).