
Abstract
Background:
Identifying insulin-resistant (IR) individuals is an issue of particular interest in the assessment of cardiometabolic risk, but there is no simple way to accomplish this task. Our aims were to determine the relationship between uric acid and insulin resistance and to define the optimal uric acid cutoff to identify insulin resistance in women.
Methods:
A population-based sample of 588 women without cardiovascular diseases, diabetes, or low glomerular filtration rate (GFR) was divided according to uric acid tertiles. Systolic blood pressure (SBP), diastolic blood pressure (DBP), fasting glucose, low-density lipoprotein cholesterol (LDL-C), triglycerides (TG), high-density lipoprotein cholesterol (HDL-C), TG/HDL-C ratio, insulin [fasting plasma insulin (FPI)], and homeostasis model assessment of insulin resistance (HOMA-IR) were compared between the mentioned tertiles. Receiver operating characteristic (ROC) curves were constructed to determinate the optimal cutoff of uric acid and identify IR individuals defined by the top tertile of FPI and HOMA-IR. The same variables were compared using the top tertile of uric acid and the maximum Youden index as cutoffs. The P values were adjusted by age, GFR, and body mass index (BMI) using analysis of covariance (ANCOVA).
Results:
FPI, HOMA-IR, and all of the cardiometabolic risk factors increased through uric acid tertiles. Both cutoffs of uric acid, estimated by the top tertile and by ROC, were identical (4.0 mg/dL). FPI, HOMA-IR, SBP, DBP, TG, TG/HDL-C ratio, and fasting glucose were higher, whereas HDL-C was lower in women who had uric acid levels >4.0 mg/dL. All of the differences remained significant after the adjustment by age and GFR.
Conclusion:
In healthy women, uric acid levels >4.0 mg/dL were associated with all the markers of IR.
Introduction
The relationship between uric acid and insulin resistance (IR) is well known, although the mechanisms that keep this relationship functioning are still a great matter of debate. The elevated level of uric acid observed in metabolic syndrome has been attributed to hyperinsulinemia, because insulin reduces renal excretion of uric acid. 5 –7 However, the fact that hyperuricemia can precede the development of hyperinsulinemia, obesity, and diabetes should not be overlooked. 8 –11
To identify IR individuals is a particularly interesting matter when talking about the assessment of cardiometabolic risk; still, the best way to accomplish this task is a debated issue. 12 Diagnosing metabolic syndrome does not provide an effective way to identify IR subjects. 13 Thus, finding new markers of insulin resistance has undoubted clinical importance. The proper tool to accomplish this task should be widely available and inexpensive to help identify the patients in the real world. Uric acid measurements do seem promising from this point of view, and the question concerning whether this substance is a maker or a marker becomes a secondary issue. Consequently, it is necessary to define the level of uric acid that should be used as a cutoff to identify IR subjects.
This study was designed to analyze the relationship between uric acid and cardiometabolic risk factors and to determine the optimal cutoff for uric acid to identify insulin resistance among apparently healthy women.
Material and Methods
The initial study population consisted of 722 women (aged 42±0.7 years) who had participated in the PROCER project (San Andrés de Giles, Buenos Aires) and had completed the laboratory tests. The characteristics of the sample have been published previously. 14 The population was predominantly of European ancestry. Subjects with either CVD, or diabetes, or glomerular filtration rate (GFR) <60 mL/min per 1.73 m2 were excluded from this analysis; therefore, the remaining 588 women were those included in the present study (aged 39±0.6 years).
The project was a community-based program aimed at surveying CVD risk factors and was based in random samples obtained from subjects living in chosen blocks. Ethical Committee permission for these studies was provided by relevant health authorities. Blood pressure was measured with the subject sitting and after a minimum resting period of 5 min using a mercury sphygmomanometer. Phase I and V Korotkoff sounds were used to identify systolic blood pressure (SBP) and diastolic blood pressure (DBP), respectively; SBP and DBP values were an average of three results obtained in three different measurements separated from one another by 2 min. Weight was determined with individuals wearing light clothes and no shoes. Height was also measured with no shoes on, using a metallic metric tape; waist circumference (WC) was measured with a relaxed abdomen using a metallic metric tape on a horizontal plane above the iliac crest. Body mass index (BMI) was calculated using the weight/height 2 formula, and concentrations of plasma creatinine (the Jaffe method without deproteinization, automatized kinetic method), uric acid (enzymatic method, urease/peroxidase/trinder, reagent; Biosystem), glucose (enzymatic method, glucose oxidase/peroxidase Trinder, reagent; Wiener), low-density lipoprotein cholesterol (LDL-C; without pretreatment, reagent, LDL-C plus 2nd generation; Roche) and high-density lipoprotein cholesterol (HDL-C; homogeneous enzymatic colorimetric method; Roche), triglycerides (TG; enzymatic Trinder method, reagent; Biosystem), C-reactive protein (CRP), and insulin [fasting plasma insulin (FPI)] were determined after an overnight fast. GFR was calculated from creatinine levels using the abbreviated Modification of Diet in Renal Disease (MDRD) formula. 15
Plasma for the insulin measurements was extracted by centrifugation (15 min at 3,000 rpm), and frozen at −20°C until assayed. FPI concentrations were determined using a solid-phase chemiluminescent assay (Immunolite Diagnostic Products Co., Los Angeles, CA), with an analytical sensitivity of 1.4 pmol/L, inter- and intraassay coefficient of variation (CV) of less than 8% and proinsulin cross-reactivity of less than 8.5%. The homeostasis model assessment of insulin resistance (HOMA-IR) was calculated with the formula ([Insulin (μU/mL)×glucose (mg/100 mL)/18]/22.5). 16 CRP concentrations were determined applying a turbidimetric method: Latex particles carrying human C-reactive antiprotein antibodies were used.
The sample was divided in FPI tertiles and uric acid tertiles. Age, smoking status, lack of physical activity, alcohol consumption, SBP, DBP, BMI, WC, LDL-C and HDL-C, TG, TG/HCL-C ratio, glucose, uric acid, CRP, HOMA-IR, and GFR values were compared between both FPI and uric acid tertiles. Linear regression was used to analyze the relationships (as continuous variables) between uric acid and direct measurements of insulin levels, FPI, and HOMA-IR. Also, we calculated some different curve regression models to obtain the best parameter estimation, and a separate model was produced for each dependent variable.
Receiver operating characteristic (ROC) curve analysis was used to determine optimal cutoffs of uric acid with the purpose of identifying IR individuals, who were defined using both the top tertile of FPI and the top tertile of HOMA-IR. Also, ROC curve analysis was used to determine the most suitable cutoff to diagnose metabolic syndrome. The optimal test cutoff was determined by the Youden index, which was defined as the maximum value of sensitivity + specificity − 1. The diagnosis of metabolic syndrome was based on the “harmonized” version of the Adult Treatment Panel III (ATP III) and International Diabetes Federation (IDF). 12
Logistic regression was used to estimate the odds ratio (OR), with a 95% confidence interval (95% CI), of being insulin resistant per uric acid tertile. The OR values were adjusted using as covariates age, BMI, and WC.
Finally, SBP, DBP, glucose, TG, HDL-C, TG/HDL-C ratio, FPI, and HOMA-IR were compared using as cutoffs the threshold for the upper tertile of uric acid, as well as the maximum value of Youden index. The P values were adjusted by age, GFR, and BMI.
The differences in continuous variables were compared using analysis of variance (ANOVA) and analysis of covariance (ANCOVA) to adjust according covariates. We used the chi-squared method to determine differences between proportions. All of the significant tests were two-tailed, and P values <0.05 were considered to be statistically significant. All of the statistical analyses were performed using SPSS software (SPSS Inc., Chicago, IL).
Results
Table 1 shows the sample divided according to FPI tertiles. Uric acid, SBP and DBP, WC, BMI, LDL-C, TG; TG/HDL-C ratio, and CRP increased and HDL-C decreased through FPI tertiles. Remarkably, ages and GFR were almost identical among FPI tertiles, and there were no differences in the percentage of smokers and alcohol consumers.
Analysis of variance (ANOVA) between tertiles of FPI.
FPI, fasting plasma insulin; SEM, standard error of the mean; HOMA-IR, homeostasis model assessment of insulin resistance; CRP, C-reactive protein; SBP, systolic blood pressure; DBP, diastolic blood pressure; WC, waist circumference; BMI:, body mass index; LDL-C, low-density lipoprotein cholesterol; HDL-C, high-density lipoprotein cholesterol; TG, triglicerides; GFR, glomerular filtration rate.
Table 2 compares experimental variables as functions of the uric acid tertiles. SBP and DBP, BMI, WC, CRP, TG, TG/HDL ratio, glucose, FPI, and HOMA-IR increased, whereas HDL-C decreased through tertiles. As this table shows, a value of 4.0 mg/dL of uric acid was the cutoff point delimiting the second and the upper tertile.
Analysis of variance (ANOVA) between tertiles of uric acid.
FPI, fasting plasma insulin; HOMA-IR, homeostasis model assessment of insulin resistance; CRP, C-reactive protein; SBP, systolic blood pressure; DBP, diastolic blood pressure; WC, waist circumference; BMI, body mass index; LDL-C, low-density lipoprotein cholesterol; HDL-C, high-density lipoprotein cholesterol; TG, triglycerides; GFR, glomerular filtration rate.
The risk of being IR was significantly higher in the women of the top tertile of uric acid. When insulin resistance was defined using the upper tertile of FPI, the age-adjusted OR (95% CI) was 1.10 (0.72–1.72) for the second tertile of uric acid and 3.03 (1.95– 4.72) for the upper tertile of uric acid. The OR (95% CI) adjusted by age, BMI, and WC gave as results 0.99 (0.58– 1.57) and 1.80 (1.09–2.98) for the second and the top uric acid tertiles, respectively. When insulin resistance was defined by the upper tertile of HOMA-IR, the results were remarkably similar. The age-adjusted ORs (95% CI) were 1.04 (0.66–1.63) and 3.27 (2.10–5.08) for the second and upper tertile, respectively. The OR (95% CI) adjusted by age, BMI, and WC gave as results 0.89 (0.54–1.47) and 1.97 (1.20–3.25) for the second and upper tertile, respectively.
Table 3 and Fig. 1 show the relationships between uric acid with FPI and with HOMA-IR as continuous variables; the correlation between uric acid and FPI was 0.21 (P<0.001) and the correlation between uric acid and HOMA-IR was 0.24 (P<0.001).
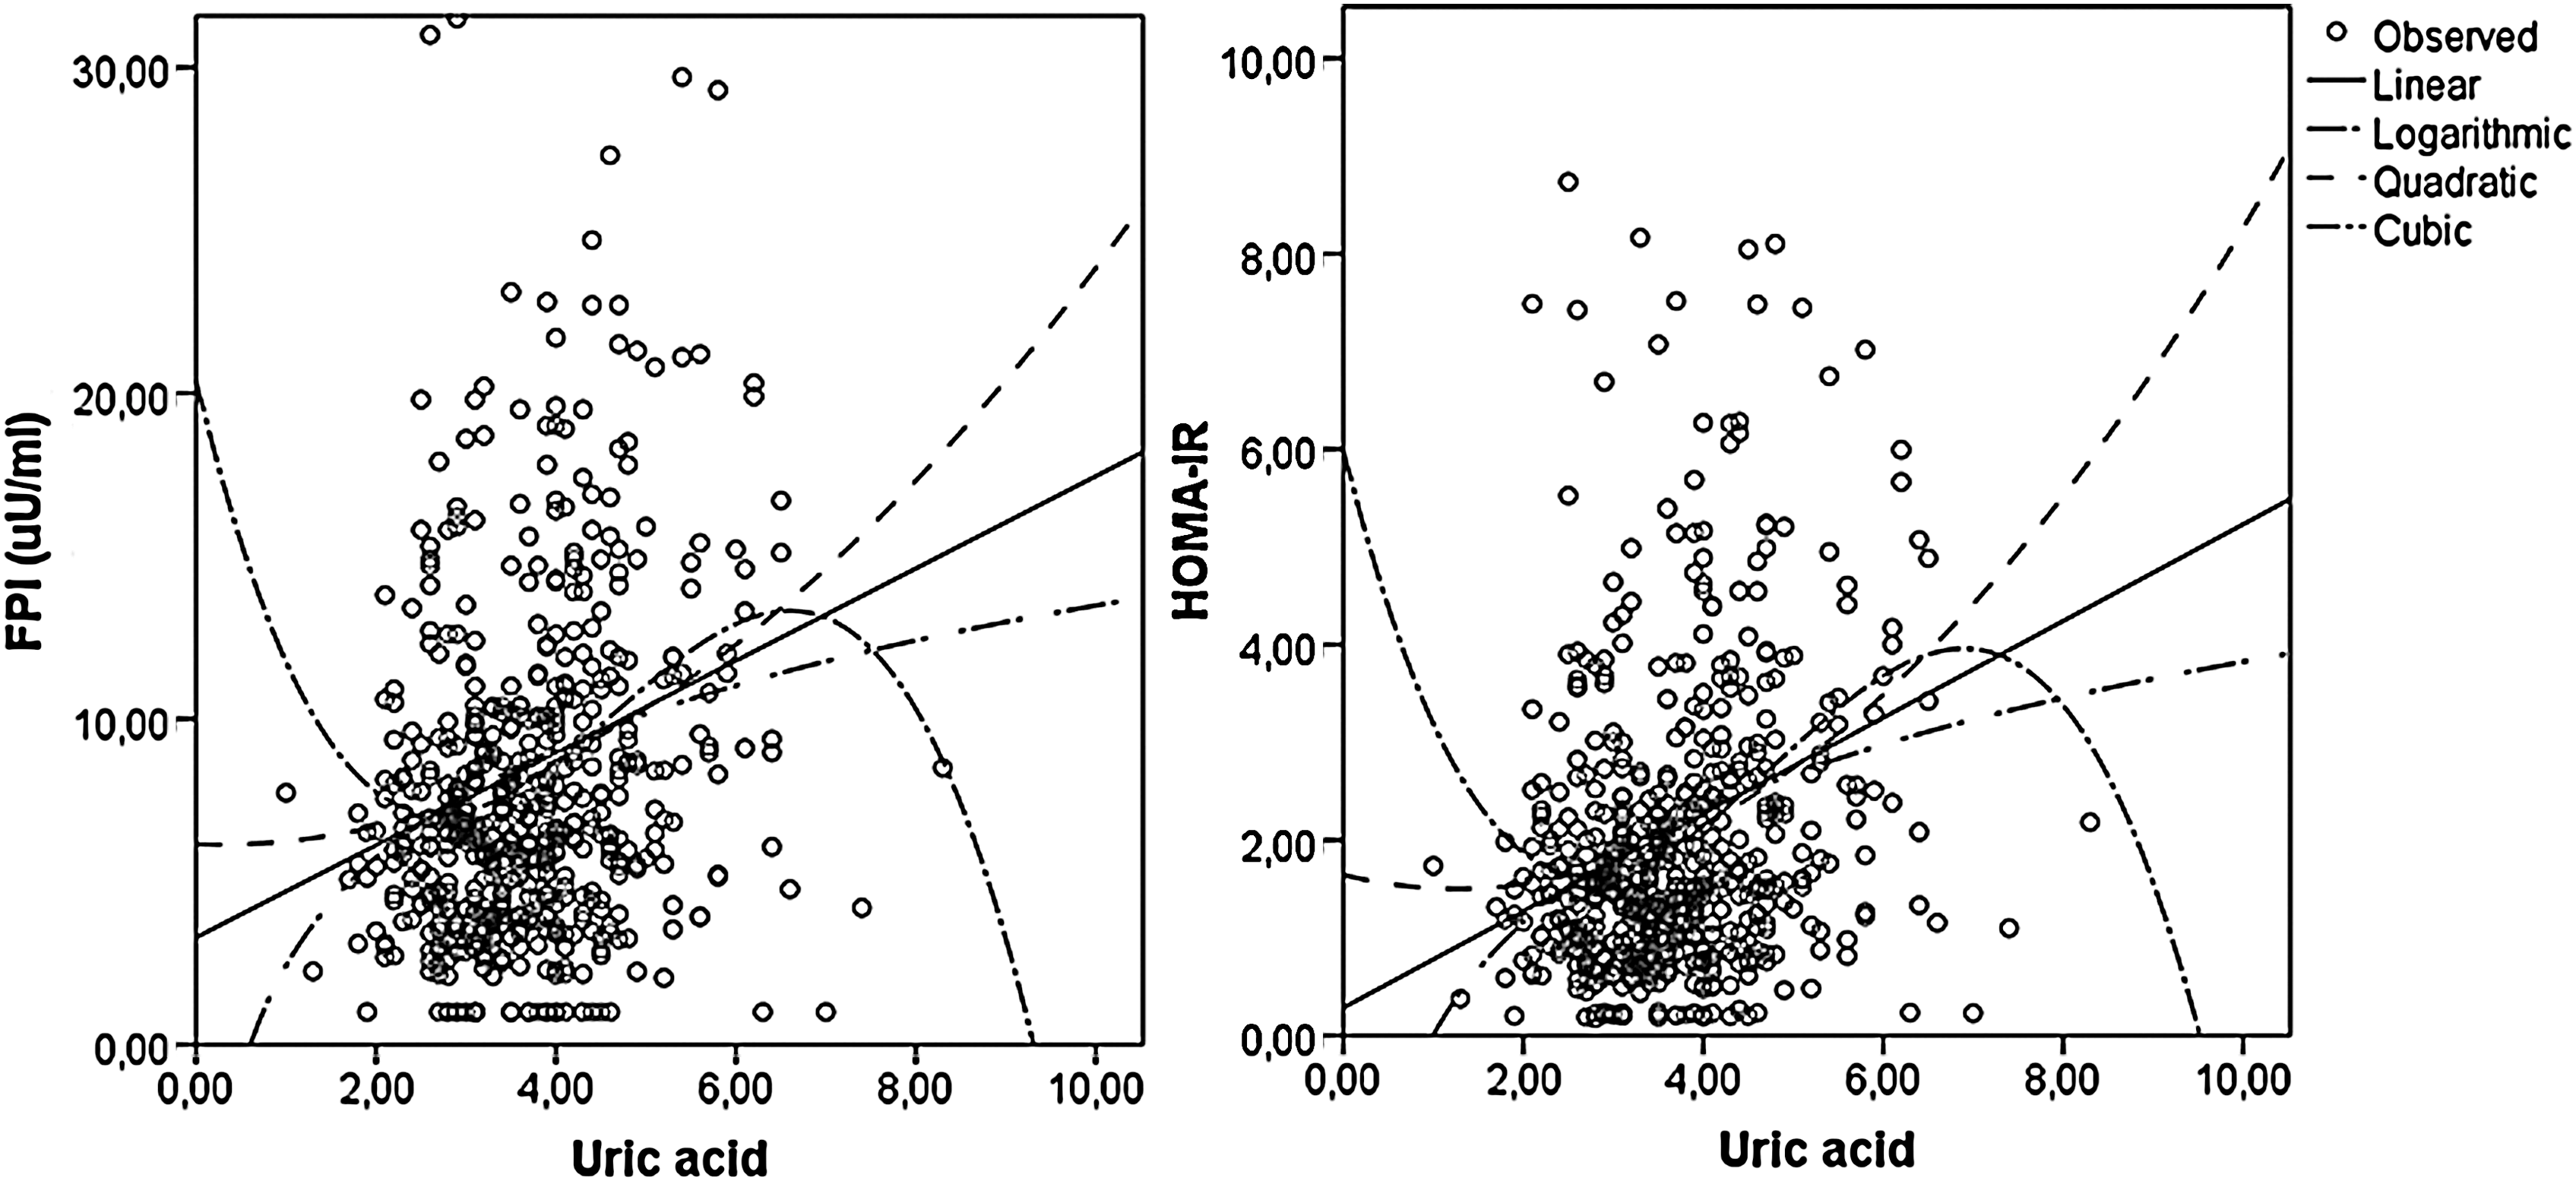
Relationships between uric acid and fasting plasma insulin (FPI, left) and homeostasis model assessment of insulin resistance (HOMA-IR, right) using different regression models.
FPI, fasting plasma insulin; HOMA-IR, homeostasis model assessment of insulin resistance.
ROC curve analysis (Fig. 2) demonstrated that the maximum Youden index to identify an IR individual was obtained at a uric acid value of 4.0 mg/dL, using both FPI and HOMA-IR upper tertiles, and that the most suitable value to identify metabolic syndrome was 3.9 mg/dL. The area under the curve (AUC) was 0.640±0.025 (P<0.001) for the upper tertile of FPI, 0.658±0.025 (P<0.001) for the upper tertile of HOMA-IR, and 0.688±0.025 (P<0.001) for the diagnosis of metabolic syndrome. The limits used to define insulin resistance were 8.8 μU/mL for FPI and 2.1 for HOMA-IR.

Receiver operating characteristic (ROC) curves of serum uric acid levels in relation to the presence of insulin resistance, who were defined using the top tertile of fasting plasma insulin (FPI, left) and the top tertile of homeostasis model assessment of insulin resistance (HOMA-IR, right). Maximum sensitivity plus specificity for insulin resistance was obtained at a uric acid level of 4.0 mg/dL for insulin resistance defined by both FPI and HOMA-IR.
In Figs. 3 and 4, we compared the markers of insulin resistance using 4.0 mg/dL of uric acid as the cutoff value. TG, TG/HDL ratio, and glucose were higher, whereas HDL-C was lower in women who had uric acid >4.0 mg/dL (Fig. 3). All of the differences remained significant after the adjustment by age and by GRF. When the adjustment was made according to age, GFR, and BMI, TG/HDL-C ratio and HDL-C remained significantly different, but TG and glucose had only marginal P values (0.050 and 0.054, respectively). On the other hand, although LDL-C level was higher in women with uric acid >4.0 mg/dL, this difference did not remain significant after the adjustment by age (data not shown).
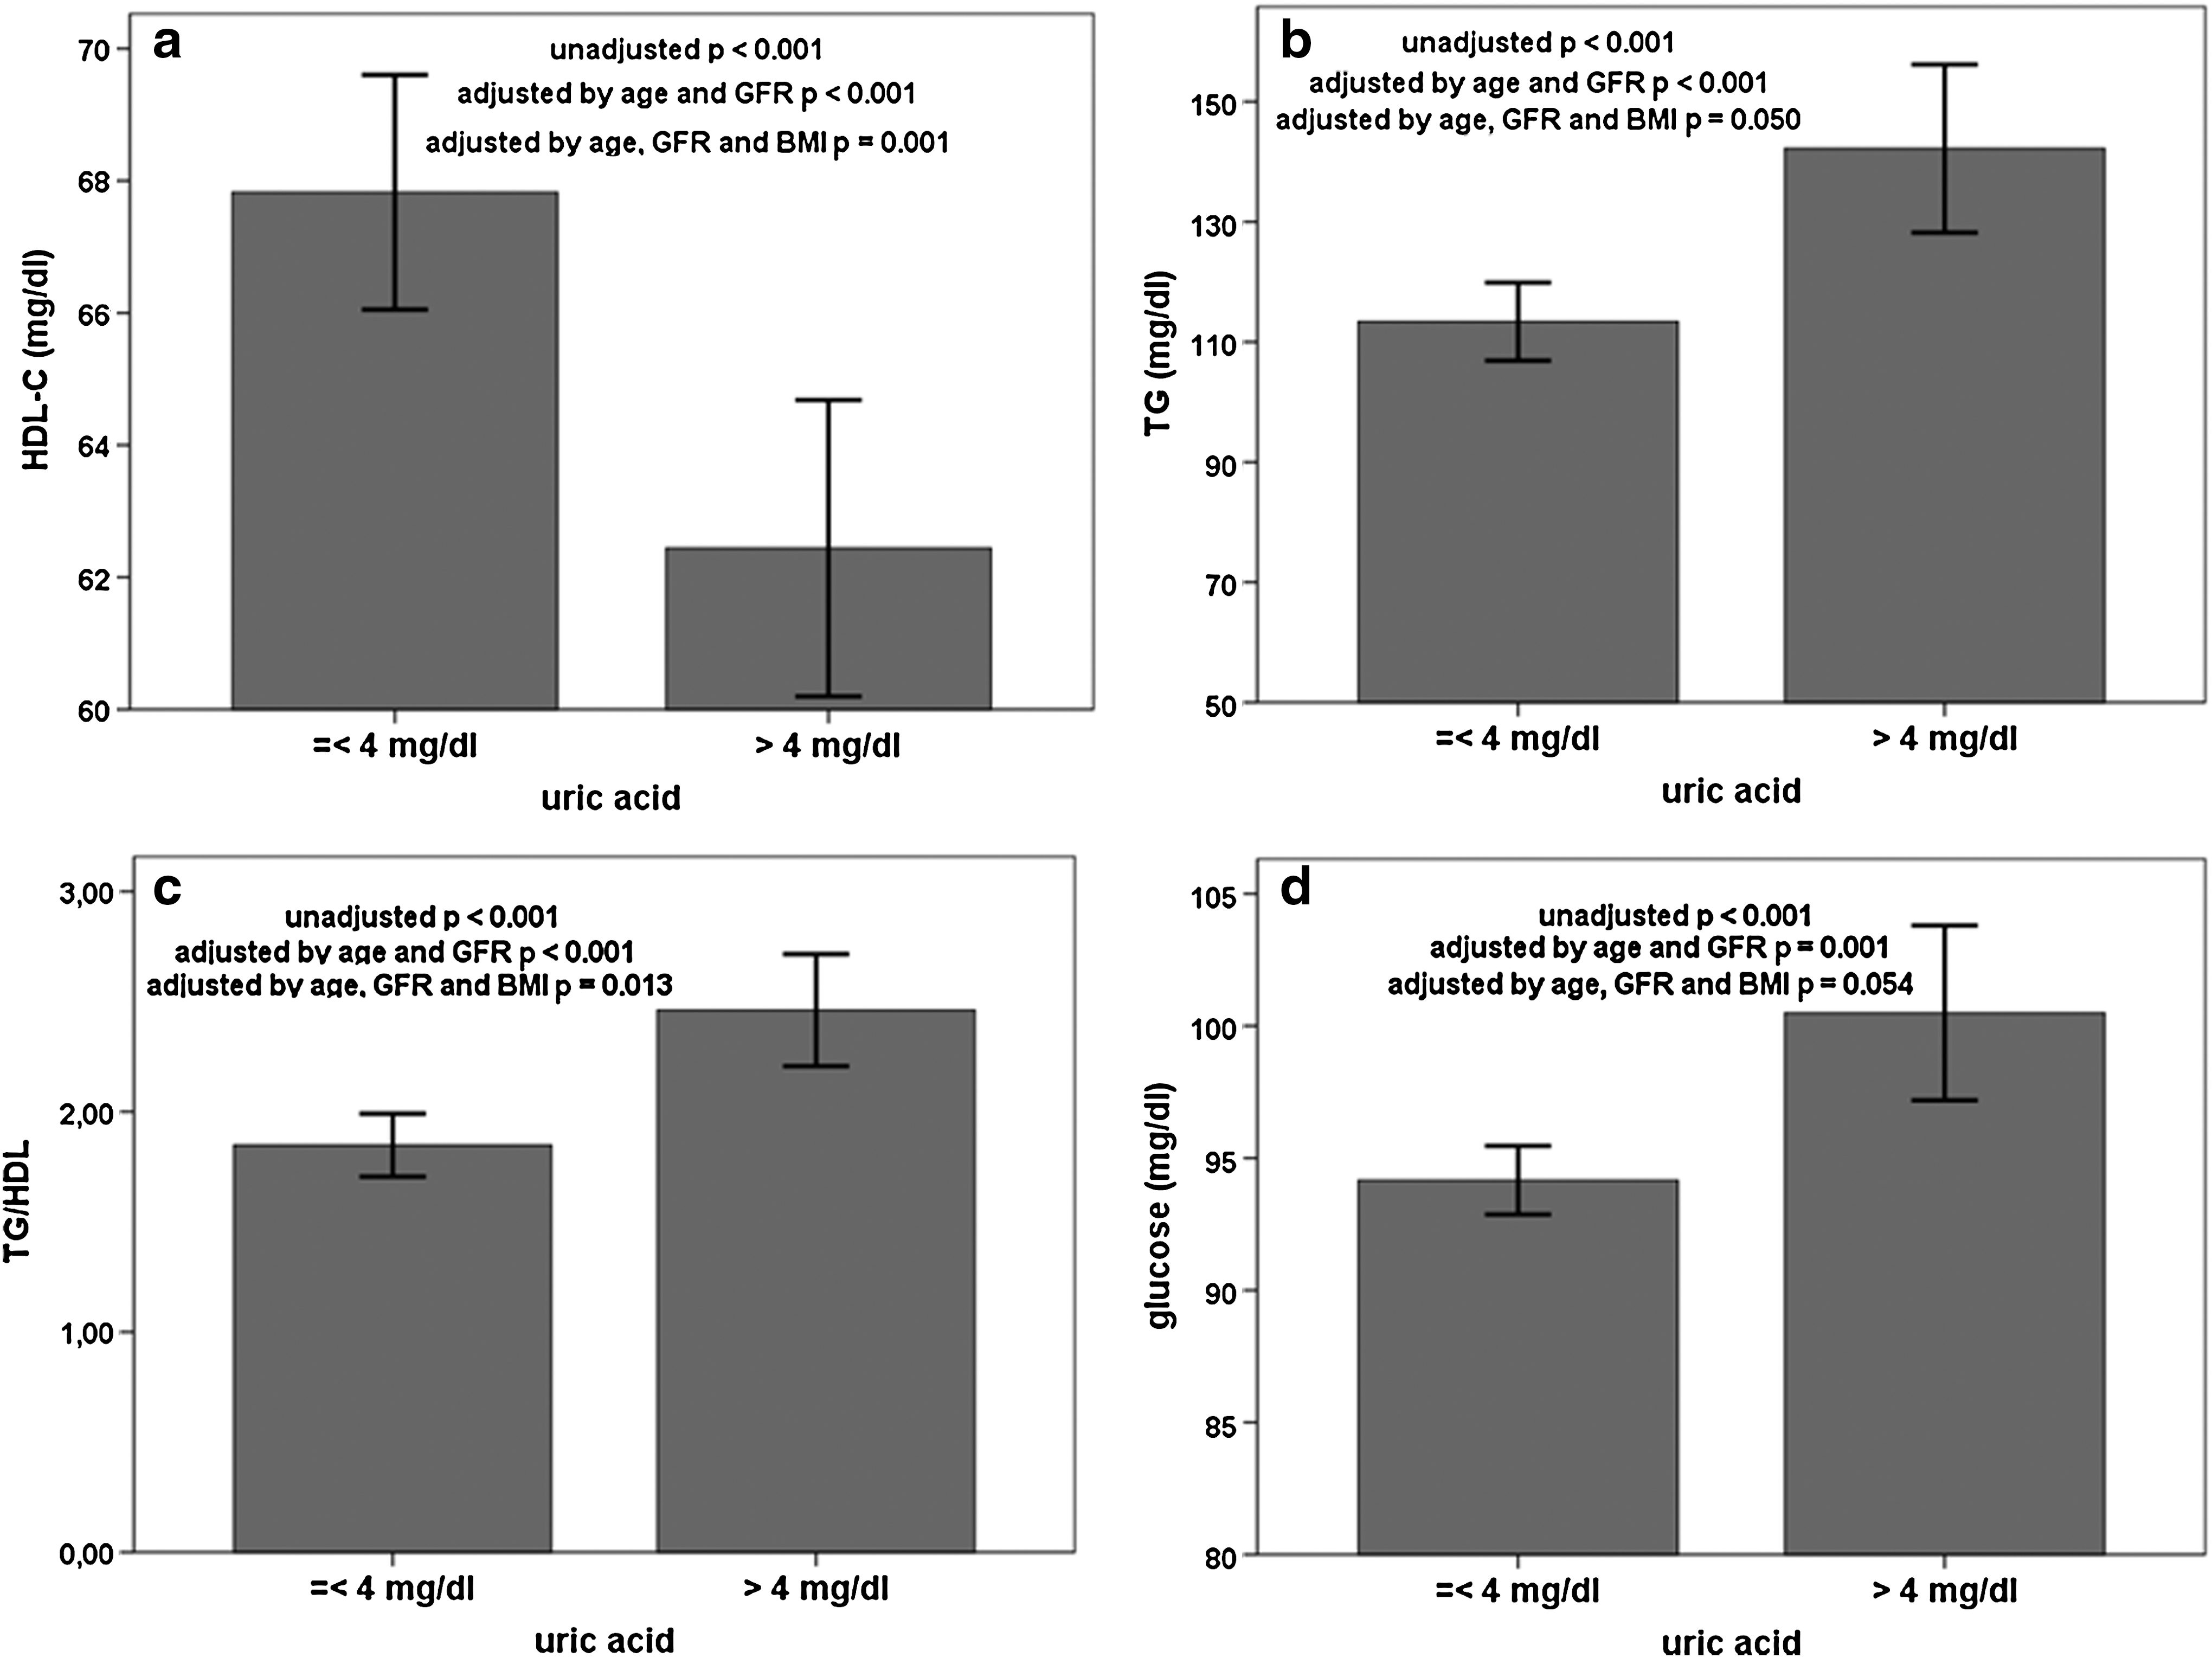
Unadjusted and adjusted by age, glomerular filtration rate (GFR) and body mass index (BMI), differences in high-density lipoprotein cholesterol (HDL-C)

Unadjusted and adjusted by age, glomerular filtration rate (GFR), and body mass index (BMI), differences in insulin levels
FPI and HOMA-IR were higher in women with uric acid >4.0 mg/dL and the differences remained significant after the adjustment by age, GFR, and BMI (Fig. 4a,b). Blood pressure levels were higher in the top tertile of uric acid, but when it was adjusted by age, GFR and BMI, only SBP remained significant (Fig. 4c,d).
Discussion
The relationship between uric acid and insulin resistance has always been well known, although the mechanisms for this relationship still remain uncertain. 7 –11 This study shows clearly that uric acid levels, even within normal ranges, could be a useful marker of insulin resistance, because in our sample all the insulin resistance markers were higher in apparently healthy woman with uric acid >4.0 mg/dL.
When we analyzed the relationships between uric acid and direct measurements of insulin levels (FPI and HOMA-IR) as continuous variables, there were significant, but not strong, correlations. These r values were, in fact, higher than the previously communicated in a large sample of Korean people. 17 These weak relationships in linear regression models could represent more complex, nonlinear associations. The fact that the OR of being IR was almost identical in the first and second uric acid tertile but was three times higher in the third tertile supports the notion of a nonlinear association.
In a recently published study, the TG/HDL-C ratio has been able to identify insulin resistance in African-American men, but not in women. 18 Consequently, the way to identify IR females could be different, and finding new markers, not related with lipid disorders, should be useful. Levels of FPI are not usually accessible in a clinical setting, whereas uric acid measurement is not expensive and is, in fact, widely available; it could become a useful subrogate marker, especially in low-income countries. Remarkably, differences in LDL-C levels (a variable not strongly related to insulin resistance) were not significant after the adjustment by age.
Renal failure is a known cause for elevated uric acid. Therefore, to avoid the effect of this variable, we excluded subjects with GFR <60 mL/min. Furthermore, we adjusted the differences in insulin-resistance markers according to GFR, and the differences were still significant. The statement that relationships between uric acid and markers of insulin resistance were independent from renal function in our sample is supported by a recent and large study specifically designed to analyze the complex relationship between renal function, uric acid, and metabolic syndrome in which a strong association between high uric acid levels and metabolic syndrome was found in women without low GFR. 19 Alcohol has been related to high uric acid as well, but in our study there was no difference in the percentage of alcohol consumers between uric acid tertiles, thus dismissing this explanation regarding the elevation of uric acid levels.
Obesity has been associated with both insulin resistance and elevated uric acid, and there could be a link between them. BMI and WC increased through both FPI and uric acid tertiles, and women in the upper tertile of uric acid had a mean BMI of ≈30 kg/m2. These data support the possibility that the relationship between uric acid and insulin-resistance markers are obesity mediated. However, after the adjustment according to BMI, some insulin resistance–related variables (SBP, HDL-C, and TG/HDL-C) were still significantly higher in women in the top tertile of uric acid, and other variables (TG and glucose) had marginal significance in P values. Also, in the logistic regression analysis, the risk of being IR was still higher in women with uric acid >4.0 mg/dL after the adjustment by BMI and WC. Thus, we could state that the relationship between FPI and uric acid can be at least in part independent of obesity. Supporting this conclusion, a high prevalence of metabolic syndrome has been found in subjects that were not obese but had elevated uric acid levels. 20
In the past years, increasing evidence supporting the concept that atherosclerosis is an inflammatory disease has been published. To evaluate systemic inflammation, we used CRP and its level increased through FPI and uric acid tertiles. The mean values of CRP in the upper tertile of uric acid and in the upper tertile of FPI were very similar. Recently, some investigators have proposed the use of CRP to evaluate cardiovascular risk associated with a systemic inflammation state. 21 However, uric acid is instead more available and presents less false positives than CRP (infection or rheumatic disease, for example). A recent review proposes that serum uric acid concentrations can be used as a cardiovascular risk marker in the same way that CRP is being used, 22 and our results support this point of view.
Historically, the value of uric acid that was considered abnormal had been based in some physical properties (such as solubility) and in their implications in renal and rheumatic diseases. These values are, however, not necessarily valid for identifying cardiometabolic risk. In a study based in a large population sample, the authors concluded that even those subjects with a uric acid concentration in the “normal range” showed higher risk of metabolic syndrome as uric acid concentrations incresed 17 ; because this study's data were not discriminated by sex, it cannot be compared to our results. Furthermore, a recently published study intended to determine the optimal cutoff for uric acid to identify multiple cardiometabolic risk factors among Japanese high school girls and found that the most appropriate value was 4.9 mg/dL 23 ; this value was the cutoff for the upper uric acid quartile. Remarkably, unlike our study, in this study there were no direct measurements of FPI.
Our study used a very low cutoff for uric acid, 4.0 mg/dL. As far as we know, no study had previously used this level of uric acid to evaluate cardiovascular risk. Clearly, any cutoff to a continuous variable will be arbitrary, but some considerations can be made. First, we used tertiles to determine the uric acid cutoff in the same way previous studies have used them to determine the CRP cutoff. Also, approximately a third of our sample had metabolic syndrome. 13,14 As can be seen in Table 2, most of the increase in variables associated with insulin resistance was observed between the second and third tertile. Remarkably, the mean values for blood pressure, WC, BMI, glucose, TG, HDL-C, and CRP were reasonably similar in the top tertile of FPI and in the top tertile of uric acid. Furthermore, both uric acid cutoffs estimated using the top tertile of uric acid and estimated using the ROC curves were identical and very near to the most appropriate value to identify metabolic syndrome. Also, for the construction of ROC curves, we defined insulin resistance using tertiles of FPI and of HOMA-IR. Nevertheless, to test the robustness of our results, we repeated the analyses defining insulin resistance using the upper quartile of FPI and the upper quartile of HOMA-IR. In each analysis, the optimal cutoffs of uric acid were almost identical to the values found using tertiles (data not shown).
Finally, the age-adjusted risk of being IR (either when it was defined by FPI or HOMA-IR) was three times higher for women with uric acid >4.0 mg/dL. After the adjustment according to BMI and WC, the risk remained being almost twice as high, suggesting that uric acid could be a good marker even when concerning thin IR women.
Some limitations ought to be mentioned. The results only include women, most of them descendants of European populations, and are not necessarily applicable to other populations or ethnic groups. Also, we only used subrogates of insulin resistance. However, the association between uric acid and cardiometabolic risk factors, FPI, and HOMA-IR was consistent, independent of age and renal function, and seemed to be partially independent of obesity. Furthermore, this study suggests the need of a change in the cutoffs of uric acid currently used to lower levels, at least to detect insulin resistance. Finally, the AUC of the ROC had only modest (although statistically significant) values; nevertheless these values are similar to the previously described for other diagnostic tools, such as ATP III and the IDF diagnostic criteria. 13,24
Obviously there is not a single way to identify all the IR individuals, but the frequently forgotten, inexpensive, and widely available uric acid could be a valuable tool in the evaluation of cardiometabolic risk in clinical practice.
Footnotes
Acknowledgment
This study could not have been conducted without the help of the nurses from the “Hospital Municipal of San Andrés de Giles”.
Author Disclosure Statement
No competing financial interests exist.