
Abstract
Background:
Nonalcoholic fatty liver disease (NAFLD) is the hepatic manifestation of metabolic syndrome and is one of the most common causes of chronic liver disease, worldwide. Lipoprotein-associated phospholipase A2 (Lp-PLA2) was recently characterized as a novel inflammatory biomarker that is correlated with several components constituting the metabolic syndrome.
Methods:
In this study, we determined the serum levels of Lp-PLA2 in patients with definite nonalcoholic steatohepatitis (NASH, n=25), borderline NASH (n=22), simple fatty liver (n=10), and healthy controls without evidence of liver disease (n=38). The levels of Lp-PLA2 were measured by enzyme-linked immunosorbent assay and compared in the four study groups. Moreover, concentrations of Lp-PLA2 were assessed in relation to the general characteristics of the study participants and the results of liver biopsy.
Results:
Concentrations of Lp-PLA2 were significantly higher in patients with definite NASH (161.8±0.9 μg/L, P<0.001), borderline NASH (135.4±47.7 μg/L, P=0.001), and simple fatty liver (132.4±46.2 μg/L, P=0.042) compared with healthy controls (86.2±40.7 μg/L). Furthermore, the serum Lp-PLA2 level was strongly associated to histological steatosis scores in patients with NAFLD (β=0.32, t=2.50, P=0.016).
Conclusion:
Although subject to future confirmation, our data suggest that Lp-PLA2 levels are elevated in NAFLD.
Introduction
Lipoprotein-associated phospholipase A2 (Lp-PLA2) was recently characterized as a novel vascular-specific inflammatory biomarker correlated with several components constituting the metabolic syndrome and implicated in atherosclerosis and incident cardiovascular disease. 11,12 Several clinical epidemiological studies have been published demonstrating the relationship between serum Lp-PLA2 levels and increased risk of cardiovascular disease. 13 –15
In this observational case–control study, we investigated serum levels of Lp-PLA2 in patients with NAFLD and examined the association between levels of this molecule and clinical, biochemical and histological phenotypes in this patient group.
Methods
Study subjects
The study protocol was approved by our local ethics committee, and all volunteers gave written informed consent. Fifty-seven patients with NAFLD (35 men and 22 women; mean age 41.6±10.4 years) and 38 healthy comparison subjects (22 men and 16 women; mean age, 40.2±10.4 years) were included in the study. The patients who had admitted to our clinic in the last 1 year with high transaminase levels and with diagnosis of NAFLD in histopathological evaluation were included into the study. All of them had alanine aminotransferase (ALT) elevations for at least 6 months; they had no history of any hepatotoxic drugs, hormone replacement therapy, or herbal products, and drinking no more than 20 g/day alcohol. Ultrasonographic examinations were performed after exclusion of ingestion of alcohol or hepatotoxic drugs (including herbals), viral serology, autoimmune markers, iron status, ceruloplasmin, serum and 24-h urinary copper, alpha-1 antitrypsin levels, thyroid functions, eye examination for Kayser–Fleischer rings, and malignancy and/or cholestatic diseases.The patients that had hepatosteatosis in ultrasonography were followed up for 6 months. An ultrasonography (US)-guided liver biopsy was performed in the patients with high transaminase levels persisting after the 6th month and those having NAFLD diagnosis were enrolled in the study. Prior to liver biopsy, all patients provided written informed consent. The local ethical committee gave approval to the study (Registration No.: 11/J, GEAH-05.04.2011). The healthy control group had no illness, no usage of alcohol, drugs, or herbal substances, no history of previous liver diseases, and was negative for viral hepatitis serology tests and with normal liver US.
Clinical assessment
A complete physical examination was performed in all of the subjects. Anthropometric assessment of height and weight was performed, body mass index (BMI; kg/m2) was calculated, and waist circumference (cm) was measured. Blood pressure was measured after 10 min of rest in a quiet room. Venous blood samples were taken in the morning after a 12 h of fasting. Complete blood counts and biochemical parameters were assessed using standard methods. The serum samples were centrifuged for 10 min at 2500×g, and serum was stored at −80°C until analysis. The Adult Treatment Panel III 16 for metabolic syndrome and American Diabetes Association 17 criteria were used for diabetes mellitus diagnosis. Homeostasis model assessment of insulin resistance (HOMA-IR) index [fasting plasma insulin (mU/mL)×fasting plasma glucose (mg/dL)/405.23] were used for determining insulin resistance. All ultrasonographic examinations and US-guided percutaneous liver biopsies were performed by the same radiologist.
Serum Lp-PLA2 levels were measured in duplicate using an enzyme-linked immunosorbent assay (Uscn Life Science Inc., Wuhan, China) kit according to the manufacturer's instructions. The minimum detectable value was 0.5 μg/L. The intraassay and the interassay coefficients of variation for Lp-PLA2 were <10%, respectively. In our study, Lp-PLA2 was evaluated by means of its mass, but its activity was not measured. All biochemical tests were performed in a blind manner.
Histological analysis
All of the patients in this study underwent US-guided percutaneous liver biopsy. The liver specimens obtained were accepted as sufficient if the length of the tissues was greater than 2 cm and/or showing more than six portal areas in histological examination. The liver specimens were stained with Hematoxylin & Eosin, Masson's trichrome, and reticulin silver stains. They were scored and evaluated by an experienced hepatopathologist blind to the clinical status of the patients. Histological evaluation was done according to the NAFLD scoring system recommended by National Institute of Diabetes and Digestive and Kidney Diseases NASH Clinical Research Network.
18
Briefly, hepatic steatosis was graded from 1 to 3 according to the steatosis ratio as 5%–33%, 33%–66%, and >66% representing scores 1, 2, and 3, respectively. Lobular inflammation was defined as an overall assessment of all inflammations: 0, no foci; 1, <2 foci per 200× field; 2, 2–4 foci per 200× field; 3, more than 4 foci per 200× field. A ballooning scoring was defined as 0 if there was no ballooning of hepatocytes, 1 if there were few, and 2 if there was numerous ballooning. Fibrosis was staged as follows
Statistical analysis
Data were processed on a personal computer and analyzed using SPSS 16.0 (SSPS Inc., Chicago, IL). Normally distributed continuous variables are presented as mean±standard deviation; skewed continuous variables were characterized by the medians and interquartile ranges. The Student t-test was used in the evaluation of the difference between the two averages of the independent groups. Differences in the levels of Lp-PLA2 among the four groups were determined by one-way analysis of variance (ANOVA) followed by Bonferroni multiple-comparison post hoc test. Categorical data were analyzed by using the chi-squared test. Spearman rank correlation was used to examine the relationship between variables. Multiple linear regression analysis was performed to evaluate the independence of the association between Lp-PLA2 levels, clinical, biochemical, and histological parameters of liver injury in NAFLD patients. The covariates for these analyses were BMI, waist circumference, low-density lipoprotein cholesterol (LDL-C), triglycerides, ALT, and histological steatosis scores. Receiver operating characteristic (ROC) curve analysis was used to identify the optimal cutoff value of Lp-PLA2 for distinguishing between NAFLD and healthy controls. P values>0.05 were considered statistically significant.
Results
The main clinical and laboratory characteristics of the patients and controls are described in Tables 1 and 2. The age, gender distribution, and smoking rates were similar between patients with NAFLD and controls. As expected, BMI, waist circumference, systolic (SBP) and diastolic blood pressure (DBP), white blood cells, hemoglobin, C-reactive protein, HOMA-IR index, total cholesterol and LDL-C, triglycerides, transaminase, uric acid, and ferritin levels in patients with NAFLD were significantly higher from those of the controls (Table 1). Ten (17.5%) patients had simple steatosis, 25 (44%) patients had borderline NASH, and 22 (38.5%) patients had definite NASH in the NAFLD group (Table 2). Metabolic syndrome was found in 64% of the patients with NAFLD.
Data are shown as the mean (±standard deviation or interquartile ranges) and numbers, with statistical analysis using a Student t-test for means and a Pearson chi-sqaured test for numbers.
Normal values in laboratory tests: sedimentation (0–20 mm/h); C-reactive protein (<8 mg/L); white blood cell count (4–10×109/L); platelet (150–400×109/L); hemoglobin (130–180 g/L in males and 110–160 g/L in females); glucose (3.6–5.8 mmol/L); HbA1c (4.3–5.8 proportion of total hemoglobin); total cholesterol (2.6–5.2 mmol/L); triglyceride (0.7—1.7 mmol/L); LDL-C (1–3.37 mg/dL); HDL-C (>0.9 mmol/L); AST (5–32 U/L); ALT (5–38 U/L); ferritin (54–755 μg/L in males and 25–755 μg/L in females); BMI (18–25 kg/m2); HOMA-IR, Lp-PLA2, and metabolic syndrome are described in the text.
NAFLD, nonalcoholic fatty liver disease; NS, not significant; BMI, body mass index; HOMA-IR, homeostasis model assessment of insulin resistance; LDL-C, low-density lipoprotein cholesterol; HDL-C, high-density lipoprotein cholesterol; AST, aspartate aminotransferase; ALT, alanine aminotransferase; Lp-PLA2, lipoprotein-associated phospholipase A2.
NS, not significant; BMI, body mass index; ALT, alanine aminotransferase; LDL-C, low-density lipoprotein cholesterol; HOMA-IR, homeostasis model assessment for insulin resistance; Lp-PLA2, lipoprotein-associated phospholipase A2.
Levels of Lp-PLA2 in the study groups are reported in Fig. 1. Levels of Lp-PLA2 in patients with NAFLD were significantly higher than those of the controls (P<0.001) (Table 1). As assessed by one-way ANOVA, circulating Lp-PLA2 levels were significantly different across the four study groups (P<0.001). Specifically, the Bonferroni multiple comparison post hoc test indicated that concentrations of Lp-PLA2 were significantly higher in patients with definite NASH (161.8±60.9 μg/L, P<0.001), borderline NASH (135.4±47.7 μg/L, P=0.001), and simple fatty liver (132.4±46.2 μg/L, P=0.042) compared with controls (86.2±40.7 μg/L).
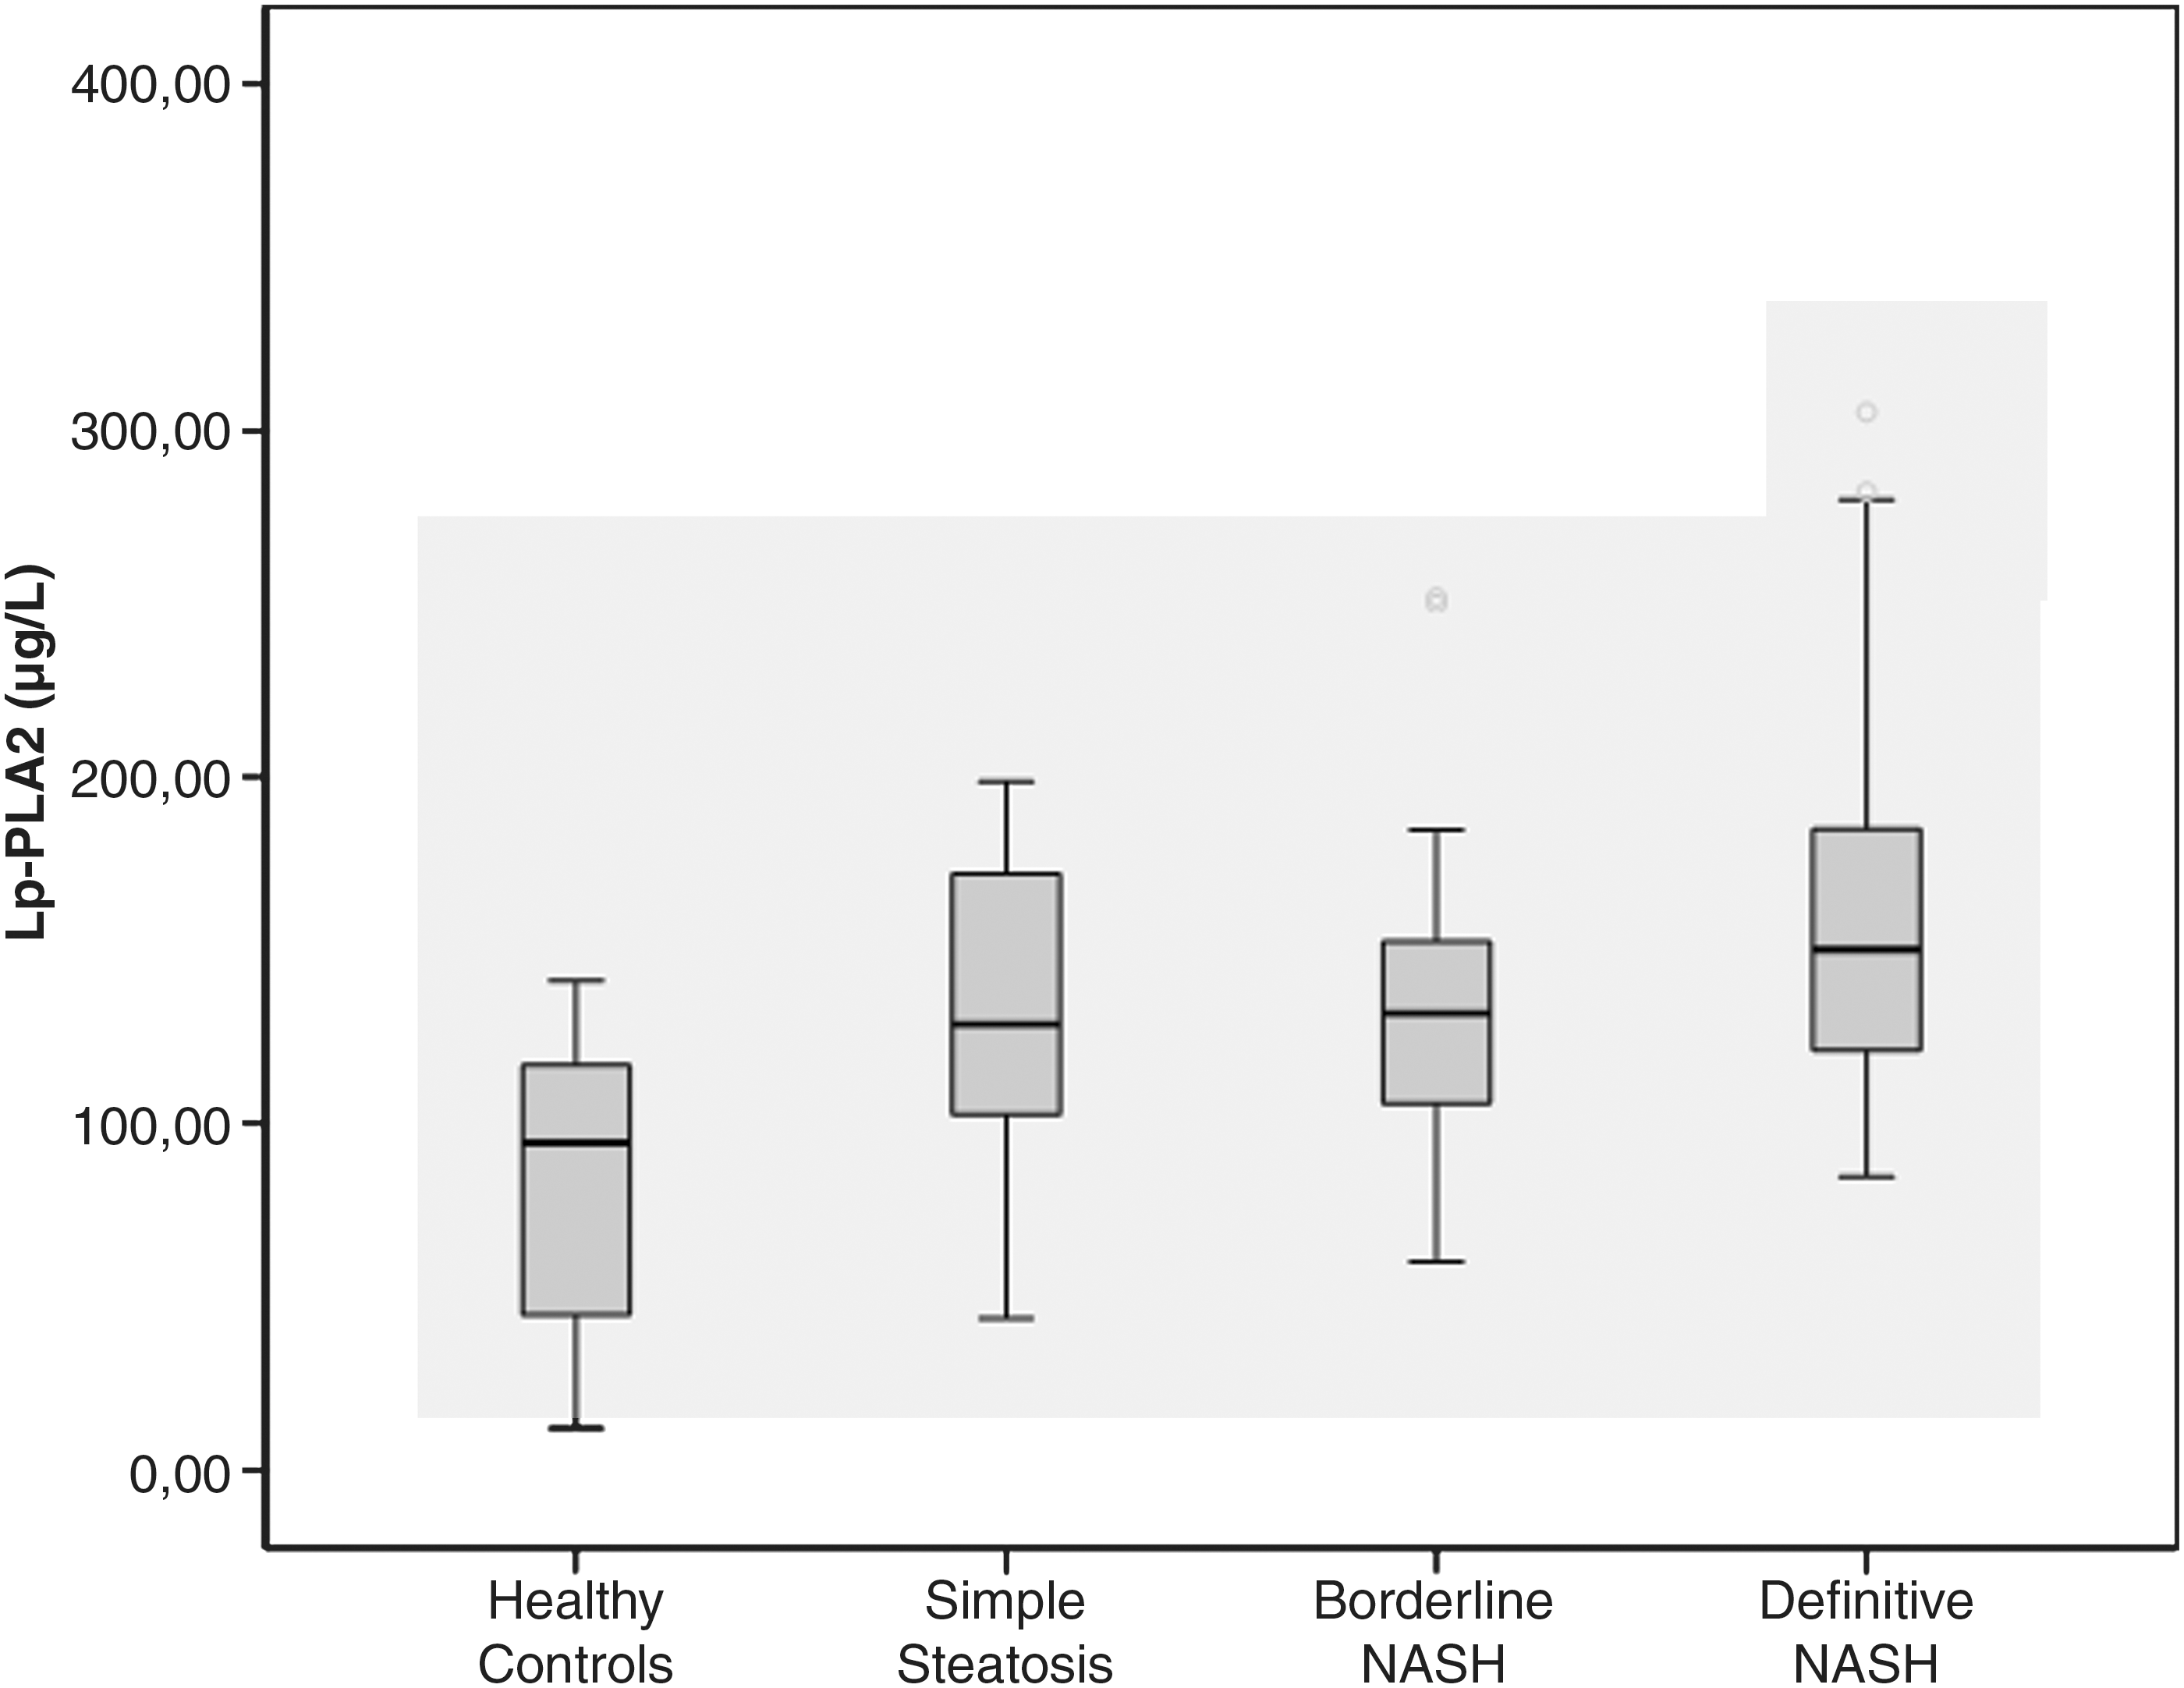
Serum lipoprotein-associated phospholipase A2 (Lp-PLA2) levels in the four study groups. NASH, nonalcoholic steatohepatitis.
Serum Lp-PLA2 levels in control group and NAFLD patients with or without metabolic syndrome were 86.2±40.7, 131.3±41.9, and 152.5±58.4 μg/L, respectively. The difference between the control group and both NAFLD groups was statistically significant (P<0.001 with metabolic syndrome and P<0.003 without metabolic syndrome), whereas the difference between these subgroups of NAFLD was not statistically significant (P=0.265) (Fig. 2). The serum levels of Lp-PLA2 were 144.3±55.6 and 147.7±49 μg/L in diabetic versus nondiabetic patients of NAFLD group. The difference between the groups was not statistically significant.

Serum lipoprotein-associated phospholipase A2 (Lp-PLA2) levels in the healthy controls, in NAFLD patients with and without metabolic syndrome (MS). NAFLD, nonalcoholic fatty liver disease.
There were 29 nonobese and 9 obese cases in the control group, and 20 nonobese and 37 obese patients in NAFLD group. (Nonobese is defined as BMI <30 and obese as BMI ≥30 kg/m2). Serum Lp-PLA2 levels were 97.7±50.8, 117.8±84.6, 130±48.3, and 150.8±46.1 μg/L, respectively, in these groups. There was a significant difference between the nonobese control group and the obese NAFLD group (P=0.001), whereas there were no difference between other subgroups.
In correlation analyses of the entire study cohort, Lp-PLA2 was significantly and positively associated with white blood cell count (r=0.323, P=0.001), BMI (r=0.300, P=0.003), waist circumference (r=0.334, P=0.001), SBP (r=0.291, P=0.004), LDL-C (r=0.371, P<0.001), triglycerides (r=0.618, P<0.001), and ALT (r=0.366, P<0.001); borderline positive correlation was found with glycosylated hemoglobin (HbA1c) (r=0.234, P=0.051) and glucose (r=0.195, P=0.06). In the multiple-regression model, LDL-C level was a strongly associated to Lp-PLA2 (β=0.527, t=3.10, P=0.001) (Table 3). Additionally, significant correlation was present between levels of Lp-PLA2 and histological steatosis scores in patients with NAFLD (r=0.301, P=0.023). After stepwise linear regression analysis, serum Lp-PLA2 level was an independent predictor of histological steatosis scores in patients with NAFLD (β=0.294, t=2.50, P=0.016).
Lp-PLA2, lipoprotein-associated phospholipase A2; NAFLD, nonalcoholic fatty liver disease; BMI, body mass index; LDL-C, low-density lipoprotein cholesterol; ALT, alanine aminotransferase.
The area under the ROC curve for distinguishing between NAFLD and healthy controls using Lp-PLA2 was 0.814 (Fig. 3). Using a cutoff level of greater than 117.65 μg/L for Lp-PLA2 levels yielded sensitivity and specificity values of 71.9 and 78.9%, respectively. The positive and negative predictive values for the serum Lp-PLA2 level of 117.65 μg/L were 83.7% and 65.2%, respectively. There was no association between the levels of Lp-PLA2 and NASH scores, and they did not discriminate between simple steatosis and definite NASH.
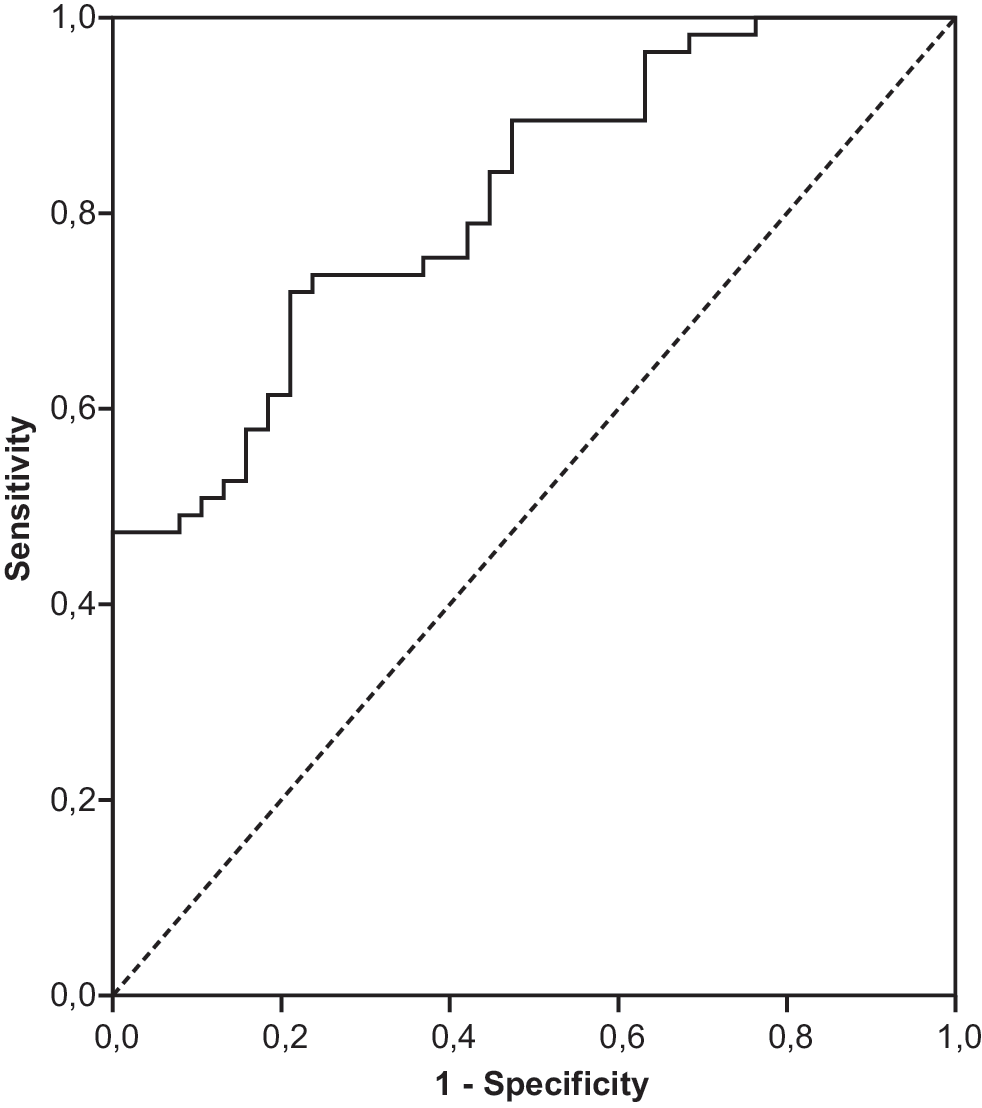
Receiver-operating characteristics (ROC) curve for serum lipoprotein-associated phospholipase A2 (Lp-LPA2) levels in patients with nonalcoholic fatty liver disease (NAFLD) and healthy controls.
Discussion
We report two major findings from this cross-sectional study. First, levels of Lp-PLA2 in patients with NAFLD were significantly higher from those of the controls, and this difference was more prominent in the setting of more advanced disease (definite and borderline NASH). Second, the serum Lp-PLA2 level was an independent predictor of histological steatosis scores in patients with NAFLD. Although subject to future confirmation, our preliminary data suggest that serum Lp-PLA2 levels may be useful as a noninvasive marker for the more advanced forms of NAFLD.
Lp-PLA2 is produced mainly by monocytes, macrophages, T lymphocytes, liver, and mast cells 19,20 and rapidly cleaves oxidized phosphatidylcholine molecules produced during the oxidation of LDL and the atherogenic lipoprotein Lp(a), generating the soluble proinflammatory and proapoptotic lipid mediators, lyso-phosphatidylcholine and oxidized nonesterified fatty acids. 21 These proinflammatory lipid mediators predispose to atherosclerotic processes and cardiovascular diseases. In a meta-analysis documented by the Lp-PLA2 Studies Collaboration including 32 prospective studies, there was a positive correlation between Lp-PLA2 levels and increased cardiovascular disease risk. 22 In our study in patients with NAFLD, we also found a positive statistically significant correlation between Lp-PLA2 levels and risk factors for cardiovascular diseases, which are BMI, waist circumference, SBP, and LDL-C levels in patients with NAFLD. Persson and colleagues demonstrated that the serum level of Lp-PLA2 in patients with metabolic syndrome was increased and that this increase was associated with cardiovascular disease risk. 11 In type 2 diabetic patients compared to controls, Nelson and colleagues found no differences in levels of Lp-PLA2. 23 In our study, 64% of the patients with NAFLD met the criteria for metabolic syndrome. In the patient group, there was no correlation between Lp-PLA2 and serum glucose or HbA1c levels; however, a statistically significant correlation was present for Lp-PLA2 levels and all the other metabolic syndrome criteria (waist circumference, SBP, serum lipids).
Lp-PLA2 is an enzyme involved in lipoprotein metabolism and inflammatory pathways. 24 Lp-PLA2 levels correlated with LDL-C levels. In humans, 80% of Lp-PLA2 circulates bound to LDL-C, 10%–15% circulates with high-density lipoprotein cholesterol (HDL-C), and the remaining 5%–10% circulates with very-low-density lipoprotein cholesterol (VLDL-C). 25 In our study, there was a significant correlation between serum LDL and Lp-PLA2 levels. Apart from these findings, we also detected Lp-PLA2 to be an independent predictor of the histological steatosis score in regression analysis. According to the two-hit hypothesis of NAFLD pathogenesis, with the first hit, the increased lipoprotein metabolism generates hepatosteatosis and in the second hit the inflammatory process is added, culminating in NASH. 26 In our study, there was a slight increase in serum Lp-PLA2 levels in patients with simple steatosis compared to the healthy control group (P=0.042), but this difference was more prominent in the more severe forms of NAFLD (borderline NASH, P=0.001; definitive NASH, P<0.001). This result suggests that Lp-PLA2 levels may have a role in the inflammatory process.
Several caveats are inherent in this study. First, the causal link between serum Lp-PLA2 levels and hepatic steatosis could not be clarified because this was a case–control study. To overcome this defect, a longitudinal study has to be planned related to the causal relationship between serum Lp-PLA2 level and liver steatosis. The number of patients limiting the certainty of our results was the second issue. Third, the study group consisted of only Turkish ethnicity, limiting the generalization of these conclusions. Fourth, for exclusion of NAFLD in control group, just the normal biochemical and ultrasonographic findings were accepted as sufficient, and, because of ethical concerns, no liver biopsies were performed. Fifth, some studies have shown that there was a correlation between mass and activity of Lp-PLA2, 22,27,28 despite contradictory results, have been reported by some others. 23,29 In our study, we measured just the Lp-PLA2 mass but not its activity. Finally, we were unable to study hepatic Lp-PLA2 expression in liver biopsies. Such data would generally present more information about the source of elevated circulating Lp-PLA2 levels and the regulation of Lp-PLA2 in hepatic steatosis.
In conclusion, this is the first study that evaluated the serum Lp-PLA2 levels in patients with NAFLD. This study had a cross-sectional nature and therefore cannot assess whether the continuous increase of Lp-PLA2 levels observed in NAFLD may have a prognostic significance in this setting. Thus, this issue should be addressed in future studies. The clinical use of Lp-PLA2, a biomarker for NAFLD, requires the standardization of analytical methods, characterization of analytical features, assessment of performance characteristics, incremental yield of different markers for given clinical indications, and demonstration of cost-effectiveness.
Footnotes
Author Disclosure Statement
No competing financial interests exist