
Abstract
Background:
Adiponectin and leptin and their ratio have been associated with incident type 2 diabetes (T2DM), although the data presented are conflicting and the populations studied have been small. In this large, prospective, nested, case referent study, we hypothesized that these associations are sex specific and may be modified by insulin resistance.
Methods:
Men and women aged 30–60 years with incident T2DM (n=640) and a prior health survey within the Västerbotten Intervention Programme (VIP) and matched referents (n=1564) were identified. Using conditional logistic regression analyses, we tested whether baseline plasma adiponectin and leptin levels and their ratio independently predicted incident T2DM, stratified for gender and insulin resistance.
Results:
Adjusted for traditional risk factors, fourth-quartile levels of adiponectin were associated with a reduced risk of T2DM in men [odds ratio (OR) 0.55 (0.36–0.86)] and women [OR 0.47 (0.27–0.83)]. Quartile four of the leptin/adiponectin ratio predicted T2DM in both men [OR 3.08 (1.68–5.67)] and women [OR 3.31 (1.56–7.03)], whereas quartile-four levels of leptin predicted T2DM only in men [OR 2.30 (1.32–4.02)]. When stratified for insulin sensitivity and adjusted for body mass index (BMI), loge-transformed leptin predicted T2DM in insulin-sensitive men [OR 1.56 (1.13–2.17)] but not in insulin-resistant men [OR 1.03 (0.76–1.39)]. The effect of adiponectin and the leptin/adiponectin ratio was not influenced by the insulin sensitivity status.
Conclusions:
Leptin in men and adiponectin in both sexes were independent predictors of T2DM. The association was modified by the degree of insulin sensitivity. The leptin/adiponectin ratio may add predictive information beyond the separate hormones.
Introduction
Leptin may have a detrimental effect on β-cells 8,9 and may decrease insulin sensitivity, 4 but prospective studies have been inconsistent about whether leptin independently predicts T2DM. 10 –18 Notably, leptin-associated risk of T2DM and cardiovascular disease may be sex specific, 11,19 possibly owing to differences in leptin signaling as shown in mice. 20
Adiponectin has both antiinflammatory and insulin-sensitizing properties and may decrease the risk for diabetes through several mechanisms. High adiponectin levels have consistently been associated with a decreased risk of T2DM. 21 Low adiponectin levels were recently shown to be associated with T2DM only in insulin-resistant and not in insulin-sensitive persons. 22
The leptin/adiponectin ratio may better classify obesity-related aberrations than either of the two hormones alone, 23 and it has been suggested to better reflect insulin resistance than a homeostasis model assessment (HOMA). 24,25 We hypothesize in this study that leptin and adiponectin and their ratio independently predict T2DM, and that these associations are sex specific and may be modified by insulin resistance.
Methods
Study subjects
The Västerbotten Intervention Programme (VIP) was initiated in 1985 with the aim of preventing cardiovascular disease and diabetes in Västerbotten County in northern Sweden. The methodology has been described previously. 26,27 In summary, all inhabitants were invited to a health survey at their nearest health care center in the year they turned 30, 40, 50, or 60 years old for a health examination, including measurements of height, weight, and blood pressure. Participants were offered a standardized oral glucose tolerance test (OGTT) after fasting overnight, and their plasma lipids were measured. They were asked to complete a questionnaire about lifestyle factors, sociodemographic characteristics, heredity, and quality of life. Moreover, participants were asked to donate blood samples for research; the samples were stored at −80°C at the Northern Sweden Medical Biobank. Participants differed only marginally from nonparticipants in social conditions. In all, 96% of the participants were born in Sweden and were presumptively Europids, although ethnicity was not registered.
The diabetes registry
In 2002, when over 60,000 unique individuals had participated in the VIP, the VIP registry was linked to the registry for inpatient and outpatient care in the county to identify subjects with a diabetes diagnosis. Altogether, 1923 subjects were identified, and of these, 68% consented to participate in the registry. Together with 5% deceased patients, this gave 1413 eligible diabetes patients. Research nurses visited all health institutions in the county to collect data from medical records. Each case was reviewed by a specialist in internal medicine and classified according to the 1999 World Health Organization (WHO) recommendations. The study population and the validation process for the diagnosis up to the year 2002 have been described previously. 28 The same procedure was repeated in 2007 when the VIP register was additionally linked to the pharmaceutical registry at the National Board of Health and Welfare to identify subjects using antidiabetic drugs in Västerbotten. At this time point, over 85,000 unique individuals had participated in the VIP and 86% had consented to participate in research and donate blood to the Biobank. At the time of assembly of this study, 1501 cases were available. Of these, 42 were classified as diabetes type 1 (2.8%), 1342 as type 2 (89.4%), and 117 were unclassifiable (7.8%). The year of diagnosis of T2DM was known, and June 30 was chosen as the day of diagnosis. Patients diagnosed <1 year after the VIP survey date were excluded, leaving 371 men and 269 women with T2DM for this study. Mean duration between the date of the survey and the date of diagnosis was 6.4 years (range 1.0–15.5 years). A referent population of 1564 VIP participants without a diabetes diagnosis was selected and group-matched for sex, age, geographic region, and examination date.
This study was approved by the research ethics committee at Umeå University, Umeå, Sweden, and informed consent was obtained from participants.
Baseline measurements
Physical activity was measured as frequency of leisure-time physical exercise in changed clothing. For the analysis, two groups were identified, those who had exercised once or more per week during the last 3 months versus those with less frequent exercising. Smoking was classified as daily cigarette smoking. Many Swedes use tobacco in the form of “snus,” a moist form of snuff, and users were those taking “snus” daily. Height and weight were measured in light clothing, and body mass index (BMI) was calculated. Blood pressure was measured in the supine position after 5 min of rest, and hypertension was defined as systolic blood pressure (SBP) ≥140 mmHg and/or diastolic blood pressure (DBP) ≥90 mmHg, and/or on antihypertensive medication.
The majority of subjects had a 2-h 75 g OGTT. Fasting and postload glucose levels were determined by a Reflotron benchtop analyzer (Roche Diagnostics, Basel, Switzerland) until 2004; from 2005, a HemoCue benchtop analyzer (Quest Diagnostics, Madison, NJ) was used. Plasma cholesterol and triglycerides were analyzed on the Reflotron analyzer. Samples from participants with increased cardiometabolic risk were tested for lipid fractions at the nearest hospital from 1993 onward. In this study, triglycerides were analyzed in 79% and high-density lipoprotein (HDL) (omitted from further analysis in this study) in 30% of the participants.
The following analyses were performed on stored samples from the Biobank. Leptin and adiponectin were analyzed with double-antibody radioimmunoassays (RIAs) (Millipore, Billerica, MA). Total coefficient of variation (CV) for leptin was 4.7% at both low (2–4 ng/mL) and high (10–15 ng/mL) levels. For adiponectin, the total CV was 15.2% at low (2–4 μg/mL) and 8.8% at high (26–54 μg/mL) levels. Fasting levels of insulin and C-peptide in serum were analyzed with Roche Elecsys assays on a Modular E170 analyzer (both Roche Diagnostics, Basel, Switzerland). Total CV for insulin was <5% at 20 mIU/L and <4% at 100 mIU/L. Total CV for C-peptide was <6% at both 0.6 nmol/L and 3.2 nmol/L.
Insulin resistance and β-cell function estimated by HOMA2 (HOMA2-IR and HOMA2-B, respectively) were calculated using an online calculator (
Statistical analysis
Nonnormally distributed data were loge-transformed prior to analysis. Descriptive statistics are presented as means, and skewed data as geometric means, with 95% confidence intervals (CIs). Differences in means between cases and referents were tested using the Student unpaired t-test. Continuous variables were categorized into quartiles by the distribution of the referent values, separately for men and women. Missing values for categorical variables were treated as a separate category (not included in the tables).
The influence of studied variables on incident T2DM, stratified for sex and insulin sensitivity status, was tested by univariate and multivariable logistic regression analysis using the conditional maximum likelihood routine designed for matched analysis to estimate odds ratios (ORs) and 95% CIs. The sex-specific distribution among referents of HOMA2-IR was used to define insulin sensitivity status, forming two groups with a cutoff between quartiles 3 and 4. Values below cutoff were defined as insulin sensitive and above cutoff as insulin resistant.
The distribution of cases and controls over quartiles was tested with a chi-squared test for linear trend. The association between loge-transformed values of leptin, adiponectin, and BMI was explored with a BMI-adjusted, sex-specific, partial correlation in referents, using a two-tailed test.
Possible interaction between leptin and adiponectin was studied by construction of combination terms, including high and low levels (below and above the median value for referents, stratified for sex). Synergy indices with 95% CIs were calculated. 29 A synergy index >1.00 was taken to indicate positive interaction, whereas a value <1.00 was seen as a sign of antagonism. The impact of leptin, adiponectin, and their ratio (dichotomized into high and low values based on cases only) on time to diagnosis was tested using Kaplan–Meier analysis (log-rank test).
A P value <0.05 was considered statistically significant. All calculations were performed with the statistical program SPSS, version 18 (SPSS Inc., Chicago, IL).
Results
The baseline characteristics of the study population stratified for sex and diabetes status are presented in Table 1. Most traditional risk factors for T2DM as well as leptin and adiponectin differed substantially between diabetic patients and referents in both men and women. Women with future T2DM had a lower educational level than women without. Family history of diabetes was more common in men and women developing T2DM.
Values given are numbers (n).
Means (* indicates geometric mean) with 95% confidence interval (CI) and for categorical proportions % and differences between groups.
Numbers (n) with missing data are presented for referents/type 2 diabetes mellitus.
HOMA2–B and HOMA2–IR is homeostasis model asessment 2 β-cell function and insulin resistance, respectively.
Hypertension was defined as systolic blood pressure ≥140 mmHg and/or diastolic blood pressure ≥90 mmHg and/or being on blood pressure medication.
Physical exercise was defined as excercise in changed clothing once or more per week the last 3 months.
T2DM, type 2 diabetes mellitus; BMI, body mass index.
Leptin correlated strongly with BMI in both men (r=0.66) and in women (r=0.73) (all P<0.0001), whereas the correlation between adiponectin and BMI was weaker in both men (r=−0.10, P<0.005) and in women (r=−0.17, P<0.001). Leptin did not correlate with adiponectin in men and only weakly in women (r=−0.08, P<0.05) after adjustment for BMI.
Table 2 presents univariate and BMI-adjusted ORs for risk factors for incident T2DM. Most risk factors were associated with similar T2DM risk in men and women. High leptin levels predicted T2DM in both men and women in the univariate analysis (all P<0.001), but after adjustment for BMI, leptin still predicted diabetes in men (P<0.001) but not in women (P=0.3). Leptin per BMI unit (leptin/BMI ratio) showed similar results (P<0.001 and P=0.4, respectively). High adiponectin levels predicted decreased risk of T2DM in all models in both men and women (all P<0.001).
Figures given are univariate and BMI adjusted odds ratios (OR) with 95% confidence intervals (95% CI) for future type 2 diabetes mellitus (T2DM), stratified for gender.
Diabetes heredity refers to first–degree heredity.
Hypertension was defined as systolic blood pressure ≥140 mmHg and/or diastolic blood pressure ≥90 mmHg and/or taking blood pressure medication.
Physical exercise was defined as excercise in changed clothing once or more per week the last 3 months.
ln, Loge transformed; HOMA2–B and HOMA2–IR, homeostatic model asessment 2 β-cell function and insulin resistance, respectively; leptin/BMI, leptin per body mass index (BMI unit).
The risk estimates for future diabetes related to quartiles of leptin, adiponectin, and the leptin/adiponectin ratio are presented in Table 3. High leptin levels were associated with an increased risk of T2DM in both men and women. In all multivariable models tested, the increased risk for the upper leptin quartiles remained in men, but not in women, once adjusted for BMI. When BMI was removed from models 2–5 in women, the OR for quartile four was 3.37 (1.84–6.18), 2.48 (1.29–4.78), 3.37 (1.77–6.39), and 2.83 (1.53–5.22), respectively. Adding triglycerides or “snus” to models 2–5 did not alter the risk estimates associated with leptin (data not shown). The risk associated with quartile 4 of leptin was 1.87 (1.03–3.41) in men and 1.56 (0.77–3.19) in women when insulin was used instead of HOMA2-B in model 3. The leptin/BMI ratio gave similar results as for leptin alone in both the univariate and multivariable models (data not shown).
Figures given are cutoff values for leptin, adiponectin, and leptin/adiponectin ratio, numbers (cases/controls), odds ratios (95% confidence interval), and test for linear trend (P value).
Hypertension was defined as systolic blood pressure ≥140 mmHg and/or diastolic blood pressure ≥90 mmHg and/or being on blood pressure medication.
Physical exercise was defined as excercise in changed clothing once or more per week the last 3 months.
Model 1 adjusted for body mass index (BMI).
Model 2 adjusted for BMI, cholesterol, hypertension, regular cigarette smoking, physical activity, university education, first–degree diabetes heredity, fasting, and postload glucose.
Model 3 adjusted as model 2+for loge transformed HOMA2–B (homeostatic model assesment 2, β-cell function).
Model 4 adjusted as model 2+for loge transformed HOMA2–IR (homeostatic model assesment 2, insulin resistance).
Model 5 adjusted as model 2+for loge transformed adiponectin or loge transformed leptin (for quartiles of leptin and adiponectin, respectively).
High adiponectin levels expressed as quartiles three and four were associated with decreased risk of T2DM in both men and women in all tested models. An increasing leptin/adiponectin ratio was strongly associated with increased risk of T2DM in both men and women. Notably, the ratio remained associated with diabetes in women despite adjustments.
After stratification for insulin sensitivity and adjustment for BMI, loge-transformed leptin (continuous) remained associated with future T2DM only in insulin- sensitive men (Table 4). By contrast, in both insulin-sensitive and insulin-resistant men and in women, a high adiponectin level decreased the risk while a high leptin/adiponectin ratio increased the risk of T2DM.
Figures shown are univariate and adjusted odds ratios (OR) with 95% confidence interval (95% CI) for type 2 diabetes mellitus (T2DM) stratified for sex and insulin resistance.
Insulin sensitivity and resistance were defined by the distribution of homeostasis model assessment of insulin resistance (HOMA2–IR) among controls with quartiles 1–3 defined as insulin sensitive, and quartile 4 as insulin resistant.
Cutoffs for insulin resitance were for men 1.35 and for women 1.27, respectively.
BMI, body mass index; ln, Loge transformed.
At each level of leptin, decreasing levels of adiponectin increased the risk for future diabetes in both men and women (Fig. 1). The unadjusted synergy index for the combination of high leptin and low adiponectin was 1.24 (0.88–1.74) in men and 1.45 (0.98–2.15) in women, indicating interaction. These estimates were, however, attenuated after adjustment for BMI, being 1.09 (0.72–1.64) and 1.01 (0.62–1.63), respectively.
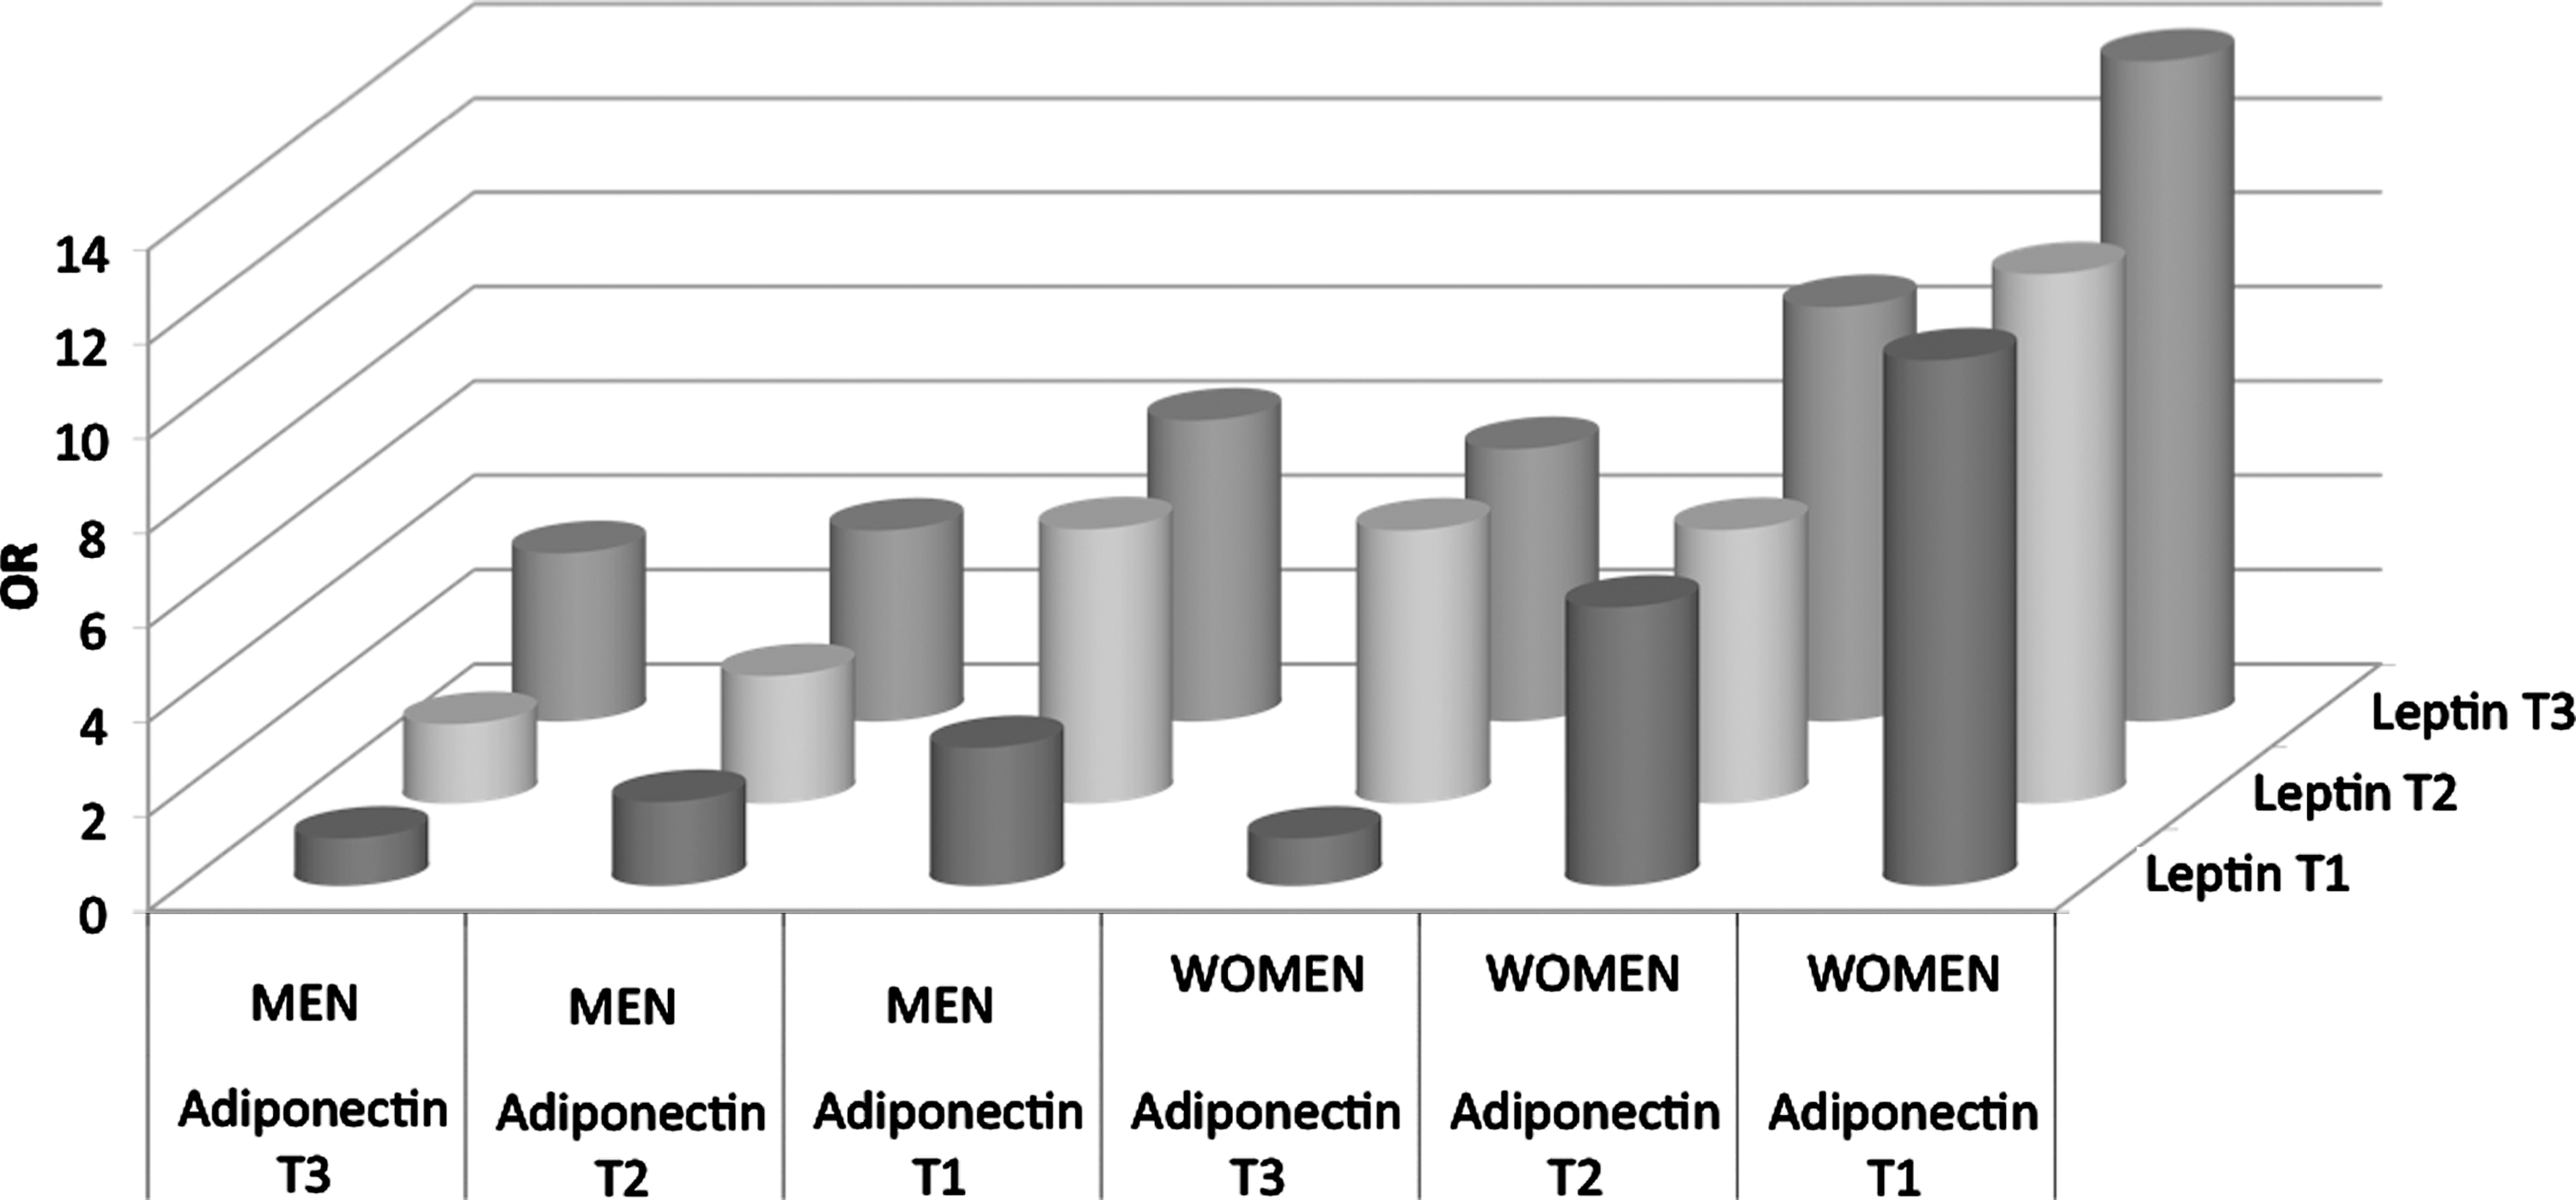
Body mass index
The median time between the survey and diagnosis, shown in Fig. 2, was shorter for men with a high leptin/adiponectin ratio compared with those with a low ratio [66 (57–75) and 86 (75–97) months, respectively (log rank 0.046)]. The same tendency, although not significant, was seen in women (log rank 0.154). Dichotomized groups for leptin and for adiponectin did not differ in time to diagnosis (data not shown).
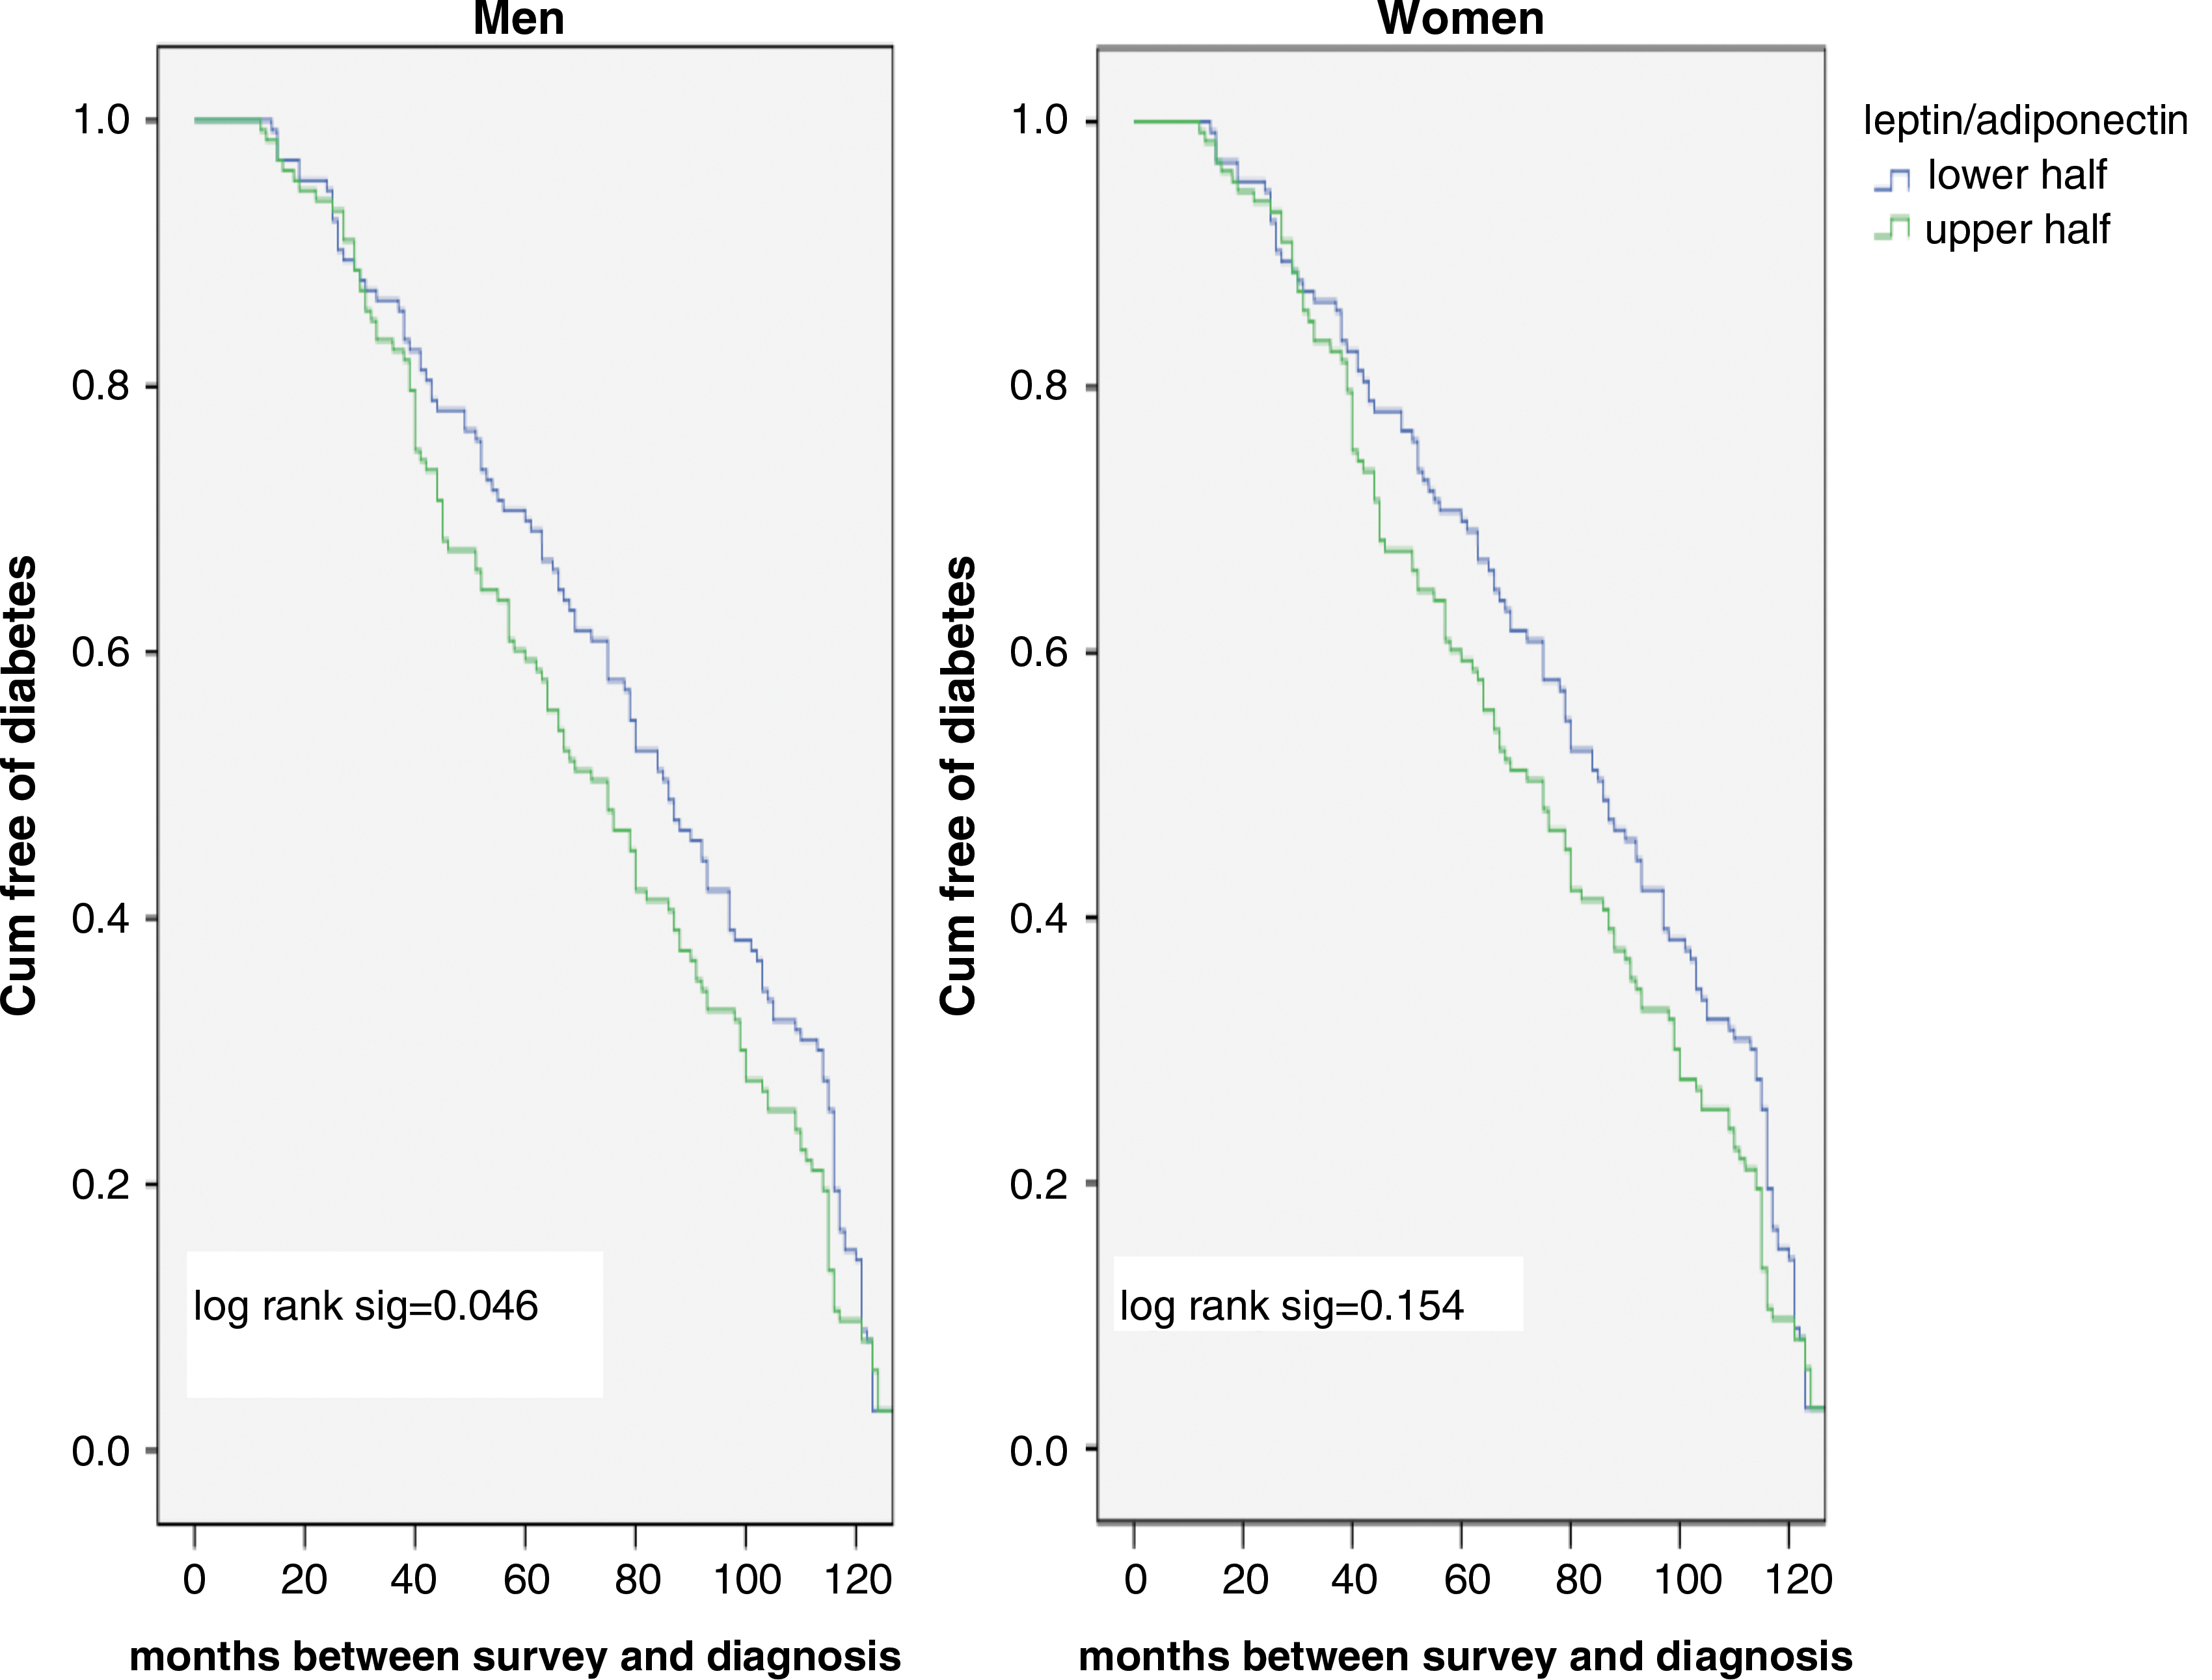
Kaplan–Meier curves showing median time from survey to diagnosis of type 2 diabetes mellitus (T2DM) in men and women stratified for a high and low leptin/adiponectin ratio (above and below median in cases only). Cum, cumulative.
Discussion
We report that the risk for future T2DM linked to leptin, adiponectin, and their ratio differs between men and women and between insulin-sensitive and insulin-resistant individuals. Leptin predicts T2DM only in insulin-sensitive men. This has not been shown previously. We also demonstrate that high adiponectin levels were associated with decreased risk of T2DM in both men and women and in both insulin-sensitive and insulin-resistant individuals. In contrast to our findings, a recent study demonstrated that low adiponectin levels predicted T2DM only in insulin-resistant individuals. 22 Together these results indicate the possibility of a yet incompletely understood interaction of adipocyte hormones with insulin sensitivity status. Whether this potential difference in action of leptin and adiponectin reflects different pathogenesis leading to T2DM or different time frames within the same pathogenetic pathway needs further investigation.
The divergent results as to whether leptin actually predicts T2DM 10 –18 can partially be explained by a varying degree of insulin resistance in the different populations. There are other possible explanations. For example, Snijder et al. 16 argue that adjustment for any metabolic factor could be problematic, as they all may be mediators in potential causative pathways, including leptin. Obesity is linked to many causative pathways leading to diabetes and strongly correlates with leptin. To adjust for obesity (e.g., using BMI) may therefore be questionable. In a previous report based on 177 cases also included in this study, we demonstrated that a composite “obesity factor” including leptin was associated with T2DM in both men and women and that this “obesity factor” was strongly correlated to other explanatory factors. 18 Furthermore, leptin levels for a specific level of obesity differ between ethnic groups. 30 The use of different adjustment models in different studies also makes comparisons difficult.
An adipo-insular axis for the metabolic communication between the adipose tissue and the β-cell has been postulated, with insulin and leptin as plausible mediators in a bidirectional mode. 8,31 Insulin is the main regulator of leptin production, and the β-cell expresses receptors for leptin, but the effect of leptin on insulin secretion is uncertain, because both inhibitory and stimulatory effects have been demonstrated. 8 A reduced peripheral insulin sensitivity has also been associated with hyperleptinemia, although presented studies report inconsistent results. 4 Adiponectin has several antidiabetogenic features, such as acting as a peripheral insulin sensitizer, increasing glucose uptake in muscles, and decreasing gluconeogenesis in the liver. 32 Adiponectin lowers glucose levels in diabetic mice, 33 and reduced adiponectin levels precede hyperinsulinemia in Rhesus monkeys, suggesting a causative role for adiponectin. 5 In addition, similarly to leptin, insulin regulates adiponectin expression and release in adipose tissue. 34 Both adiponectin and leptin are related to adiposity and increased free fatty acid levels in blood, which may promote leptin resistance and reduce circulating adiponectin levels. 35
For the leptin/adiponectin ratio, where previous studies are inconsistent, 14,17 we demonstrate a strong association with incident T2DM. The ratio remained significantly predictive in both men and women despite adjustments. Men with a high ratio had a shorter time until diagnosis and this could not be demonstrated for the separate hormones. This may indicate a predictive capacity for the ratio beyond that of the separate hormones, for which the predictive capacity only marginally exceeds the predictive ability of traditional risk scores. 36
This study has several strengths, such as the large number of well-defined diabetic patients, in combination with extensive data from the baseline examination, the high participation rate, the nested prospective case–referent design, and the long follow-up time. Possible limitations are the identification of incident cases through routine care, not including an OGTT. As this will underreport the incidence, we assume that it may have reduced our ability to detect an effect of the studied variables. Further limitations are the lack of a standardized lipid analysis and the lack of waist measurement, because this was not included in the VIP protocol at this stage. However, it should be noted that leptin was associated with T2DM in Mauritian men despite adjustment for waist. 11
To conclude, this large prospective study demonstrates that adiponectin in both men and women and leptin in men are independently associated with future T2DM and that the association differs according to the insulin sensitivity status. We also propose that the leptin/adiponectin ratio may add further prognostic information.
Footnotes
Acknowledgments
We are indebted to the Västerbotten Intervention Programme and the Medical Biobank and the funds supporting them. This study was supported by grants from the Swedish Heart and Lung Foundation, the county councils of Northern Sweden (Visare Norr) and the Faculty of Medicine at Umeå University. Dr. Lilja received support from the Research and Development Unit of Jämtland County Council, Östersund, Sweden. Dr. Söderberg was supported by grants from the Västerbotten County Council (ALF) and Sjölunds Foundation. The authors are grateful to Paul Franks for valuable input and work with the initial data file, and to Margareta Danielsson and Åsa Ågren for assistance in technical matters. We also express our gratitude to the Swedish National Research School in General Practice.
Author Disclosure Statement
No competing financial interests exist.