
Abstract
Background:
Metabolic is a heterogeneous concept that includes five elements, each of which has individual thresholds that might be different when considered as a criterion in the metabolic syndrome. Therefore, some individuals might present different levels of metabolic syndrome. This study aims to identify two different severities of patients with metabolic syndrome—moderate versus severe—and the respective association of these severities with lifestyle habits and physical capacity.
Methods:
The sample included 2,281 adults aged between 19 and 85 years from the National Health and Nutrition Examination Survey (NHANES) study. Subjects were subcategorized into three groups: No metabolic syndrome, moderate metabolic syndrome, or severe metabolic syndrome. Physical activity and dietary habits were assessed by questionnaires. Cardiorespiratory fitness (CRF) was measured in adults aged <50 years, whereas physical capacity was measured in adults ≥50 years of age.
Results:
Thirty-eight percent of subjects had metabolic syndrome. From those, 15.3% had severe metabolic syndrome. No difference was observed among groups for energy intake. Subjects aged <50 years having severe metabolic syndrome had a lower CRF compared with moderate metabolic syndrome, whereas subjects ≥50 years reported less vigorous exercise (P≤0.05). Finally, subjects aged ≥50 years old having severe metabolic syndrome reported more physical incapacity compared to the other groups.
Conclusion:
This study confirms that metabolic syndrome is a heterogeneous condition that may be subclassified. Severe metabolic syndrome is associated with lower physical capacity and CRF compared to moderate metabolic syndrome. Studies are needed to determine if metabolic syndrome categorization can be useful for clinical practice.
Introduction
During the past decade, criteria to define metabolic syndrome have been often discussed and criticized. 6 Despite various definitions, an association has been established between metabolic syndrome and several outcomes, such as lower mobility, 7 type 2 diabetes, 8 coronary heart disease, 9 and mortality. 10 On the basis of the harmonized definition, 1 four out of five criteria used to categorize metabolic syndrome are lower than the cutoff used to diagnose the specific condition or diseases. For example, the cutoff used to identify diabetic patients is 7.0 mmol/L of glucose, 11 whereas the metabolic syndrome criterion is 5.6 mmol/L (Table 1). Consequently, individuals who reach the criterion for diabetes might be at higher risk for cardiovascular diseases 12 and physical incapacities 13 than those with only the metabolic syndrome criteria. Actually, Church et al. demonstrated that type 2 diabetes patients also having metabolic syndrome are at greater risk of premature death than those displaying only the metabolic syndrome. 14 The identification of individuals with moderate versus severe metabolic syndrome is not trivial considering the high prevalence of metabolic syndrome in modern societies, 15 especially in the older population. 3 Also, from a clinical and a scientific point of view, combining both moderate and severe metabolic syndrome may invalidate results of analysis of the data. To our knowledge, no study as yet investigated and compared individuals displaying moderate versus severe metabolic syndrome on lifestyle habits and physical capacity.
Waist circumference for white, African Americans, or others.
Waist circumference for Mexican Americans or another Hispanic ethnicity.
M, men; W, women.
The present study was conducted to: (1) Estimate the prevalence of adults displaying moderate and severe metabolic syndrome, (2) document exercise and food habits in adults categorized as moderate metabolic syndrome or severe metabolic syndrome, and (3) quantify the impact of both conditions on physical capacities of older adults. We hypothesized that individuals displaying severe metabolic syndrome would also have worse exercise and diet habits and lower physical capacities compared to those having moderate metabolic syndrome or no metabolic syndrome.
Methods
Study population
The study sample consisted of 2,281 men and women aged between 19 and 85 years old who participated to the 1999–2000 and the 2001–2002 National Health and Nutrition Examination Survey (NHANES). From the 10,291 adults included in the original samples, 7,243 had missing data for at least one of variables included in the metabolic syndrome definition and were consequently excluded from the present study. Individuals selected for the present study were similar for age (48.6±20.1 vs. 50.6±19.1 years) and gender (46.9% vs. 43.2% male) compared to the participants who were excluded.
In NHANES, subjects were identified using a stratified multistage probability sampling design. Detailed survey operation manuals and consent forms are available on the NHANES website. 16 Briefly, the NHANES survey consisted of a home interview and a thorough health examination. During the interview, participants were asked questions about their health status, disease history, and lifestyle behaviors. The health examination was performed in a mobile exam center. All participants provided written and informed consent. The National Center for Health Statistics approved the protocol.
Metabolic syndrome
The harmonized metabolic syndrome definition proposed by Alberti and al. 1 was used [high waist circumference (sex and ethnicity specific thresholds), low HDL-C (women,<1.3 mmol/L; men, <1.04 mmol/L), elevated triglyceride levels (women and men, ≥1.7 mmol/L), high resting blood pressure (women and men, ≥130 mmHg/85 mmHg), and high fasting glucose levels (women and men, ≥5.6 mmol/L) (Table 1).
Furthermore, criteria for severe metabolic syndrome such as diabetes (fasting blood glucose ≥7.0 mmol/L), hypertension (resting systolic blood pressure ≥140 mmHg and/or resting diastolic blood pressure ≥90 mmHg), and high triglycerides (fasting triglycerides ≥2.3 mmol/L) based on the American Heart Association risk factors chart were used (Table 1). 2 Note that waist circumference and HDL-C criteria were the same for both classifications. Subjects were then categorized into three groups: (1) No metabolic syndrome (less than three criteria for moderate metabolic syndrome), (2) moderate metabolic syndrome (three or more criteria for moderate metabolic syndrome), or (3) severe metabolic syndrome (three or more criteria for severe metabolic syndrome).
Food habits
Total daily energy intake (kcal/day) and quality of food habits were assessed using a 24-h food recall. Diet quality was based on adherence to the United States Department of Agriculture's recommendations 17 for seven different macronutrients: Proteins (10%–35% of total calories), carbohydrates (40%–45% of total calories), total fat (20%–35% of total calories), saturated fat (<10% of total calories), cholesterol (<300 mg/day), fiber (>25 g/day for women, >30 g/day for men), and sodium (<2,400 mg/day). A score of 1 was given when meeting the recommendation for one nutrient. Then, the number of recommendations met was computed to create a diet quality index with values ranging from 0 to 7. This strategy has been previously used for the same NHANES cycles. 18
Estimated physical activity levels
Estimated physical activity levels were assessed using the Physical Activity Questionnaire. The following variables were considered: The number of minutes of physical activities every week and self-reported intensity reached when doing physical activities (moderate or vigorous). Participants were also asked whether or not they were engaged in 48 different leisure-time activities in the previous month (e.g., walking, gardening, etc.). Information about frequency and duration of engagement in different activities was used to compute a mean time of physical activity during a typical week. To estimate physical activity intensity, a score of 1 was given to participants if they had done any moderate or vigorous activities that caused heavy sweating, for at least 10 min, in the past 30 days. Finally, a score of 1 was also given to those who did some resistance training during the same period, while those who answered negatively received a score of 0. 18
Cardiorespiratory fitness
A submaximal cardiorespiratory fitness (CRF) test on a treadmill was performed to assess VO2peak for participants aged <50 years (n=460). The test consisted of a 2-min warm up, two 3-min exercise stages, and a 2-min cool-down period. Participants were asked to rate their perceived exertion using the Borg scale (ranging from 6 to 20) at the end of the warm-up period and after each exercise stage. Subjects had to reach 75% of their maximal heart rate predicted for age (220− age) during the test to be considered valid. Details of the protocols and fitness calculation formulas are available on the NHANES web site.
Physical capacity
Physical capacity was measured using objective tests and self-reported questions. Only those aged ≥50 years were tested (n=1,191). Walking speed (m/sec) was measured using a 20-ft walk at usual pace on a flat floor. 19 Self-reported physical capacity was also assessed using five questions regarding difficulty in performing the following tasks: (1) Walking for one-quarter of a mile; (2) walking up 10 steps without resting; (3) stooping, crouching, or kneeling; (4) lifting or carrying 10 pounds; and (5) standing on their feet for 2 h. Possible responses for each question were: No difficulty (3 points), some difficulty (2 points), much difficulty (1 point), and unable to do (0 point). A factor analysis was performed to confirm that all self-reported physical capacity measures could be used to create an aggregated factor score. The analysis revealed that each of the five measures was highly related (r≥0.82) to the factor score. Therefore, responses from all questions were summed to create a global self-reported capacity score, as previously described. 18 Scores ranged between 0 and 15.
Covariates
Covariates included in the analyses were age (continuous variable), gender, race/ethnicity (non-Hispanic white, non-Hispanic black, Hispanic, and other), smoking status, and daily alcohol consumption. Alcohol intake was calculated as follows: Nondrinker, light drinker (<1 drink/day), moderate drinker (1–2 drinks/day), and heavy drinker (>2 drinks/day). Smoking status was determined using the following categories: (1) Current smokers (smoked cigarettes at the time of the survey), former smokers (did not smoke at the time of the survey, but smoked more than 100 cigarettes in their life), and (3) nonsmokers (smoked less than 100 cigarettes in their life). The following conditions were also considered based on a medical questionnaire: Trouble seeing even with glasses/contacts, arthritis, lung diseases (emphysema, asthma, or chronic bronchitis), and cardiac problems (congestive heart failure, coronary heart disease, angina, stroke, or heart attack). A score of 1 was given to each of the four conditions when subjects answered positively.
Statistical analysis
Data are presented as unadjusted mean±standard deviation (SD) and prevalence N (%) for categorical variables. Linear regression models were used to identify differences in continuous variables among the three groups. Bonferroni post hoc analyses were used to identify any group differences. Logistic regression models were used to identify differences for dichotomized dependent variables. All analyses regarding lifestyle (physical activity and diet) were adjusted for age, gender, race/ethnicity, alcohol intake, and smoking status. Further adjustment was done for arthritis, lung diseases, and cardiovascular diseases when analyzing physical activity levels. Further adjustments were done for trouble seeing even with glasses/contacts when analyzing physical capacity in adults aged ≥50 years. No interaction was detected between gender and the studied groups. Therefore, men and women were combined for analyses. Data management and statistical analyses were performed using SAS version 9.1 (SAS Institute, Cary, NC). A P≤0.05 was considered significant. Statistics accounted for the sample weights and complex survey design (strata, probability sampling units).
Results
The prevalence of moderate and severe metabolic syndrome was 22.3% (n=509) and 15.3% (n=348), respectively. Once stratified by age groups (age <50 years vs. ≥50 years), moderate (15.9% vs. 28.2%; P≤0.05), and severe (8.0% vs. 21.9%; P≤0.05) metabolic syndrome were more prevalent in older individuals. In fact, the severe metabolic syndrome was almost three-fold more prevalent in individual aged ≥50 years (Fig. 1). The proportion of younger and older women categorized as severe metabolic syndrome was higher compared to men of the same age group (P≤0.05).

Subjects in the moderate and the severe metabolic syndrome groups had higher body mass index (BMI) values and were older compared to the no metabolic syndrome group (P≤0.05; Table 2). The severe metabolic syndrome group also displayed a higher proportion of Hispanic individuals compared to the no metabolic syndrome group (P≤0.05). Furthermore, individuals in the severe metabolic syndrome group drank significantly less alcohol and smoked less than those in the no metabolic syndrome and the moderate metabolic syndrome groups (P≤0.05). Only a higher prevalence of arthritis was reported in severe metabolic syndrome subjects compared to the moderate metabolic syndrome group (P≤0.05), while both metabolic syndrome groups displayed a greater prevalence for the four self-reported chronic conditions compared to the no metabolic syndrome group (P≤0.05). Finally, to the exception of resting diastolic blood pressure, the severe metabolic syndrome group displayed worse values for all metabolic syndrome variables compared to the moderate metabolic syndrome group (P≤0.05).
Data presented as unadjusted mean [standard deviation (SD)] and N (%) for the categorical variables.
Different from no metabolic syndrome.
Different from moderate metabolic syndrome, P≤0.05.
Table 3 shows that adults aged <50 years displaying severe metabolic syndrome reported doing less moderate-intensity exercises as well as a lower frequency of resistance training compared no metabolic syndrome individuals (all P≤0.05). The severe metabolic syndrome group also had lower CRF compared to the no metabolic syndrome and the moderate metabolic syndrome groups (P≤0.05). On the other hand, 10.7% of individuals in the severe metabolic syndrome group aged ≥50 years reported doing less vigorous intensity exercises compared to 19.8% (P≤0.05) in the moderate and 22.9% in the no metabolic syndrome groups (P≤0.05).
Data presented as unadjusted mean [standard deviation (SD)] and N (prevalence) for the categorical variables.
Analyses are adjusted for age, gender, race/ethnicity, alcohol intake, smoking status, arthritis, lungs problems, and cardiac problems.
Different from no metabolic syndrome.
Different from moderate metabolic syndrome; P≤0.05.
As for total energy intake and diet quality, no difference was observed among groups in individuals aged <50 years as well as individuals aged ≥50 years. No difference was also observed between moderate and severe metabolic syndrome groups.
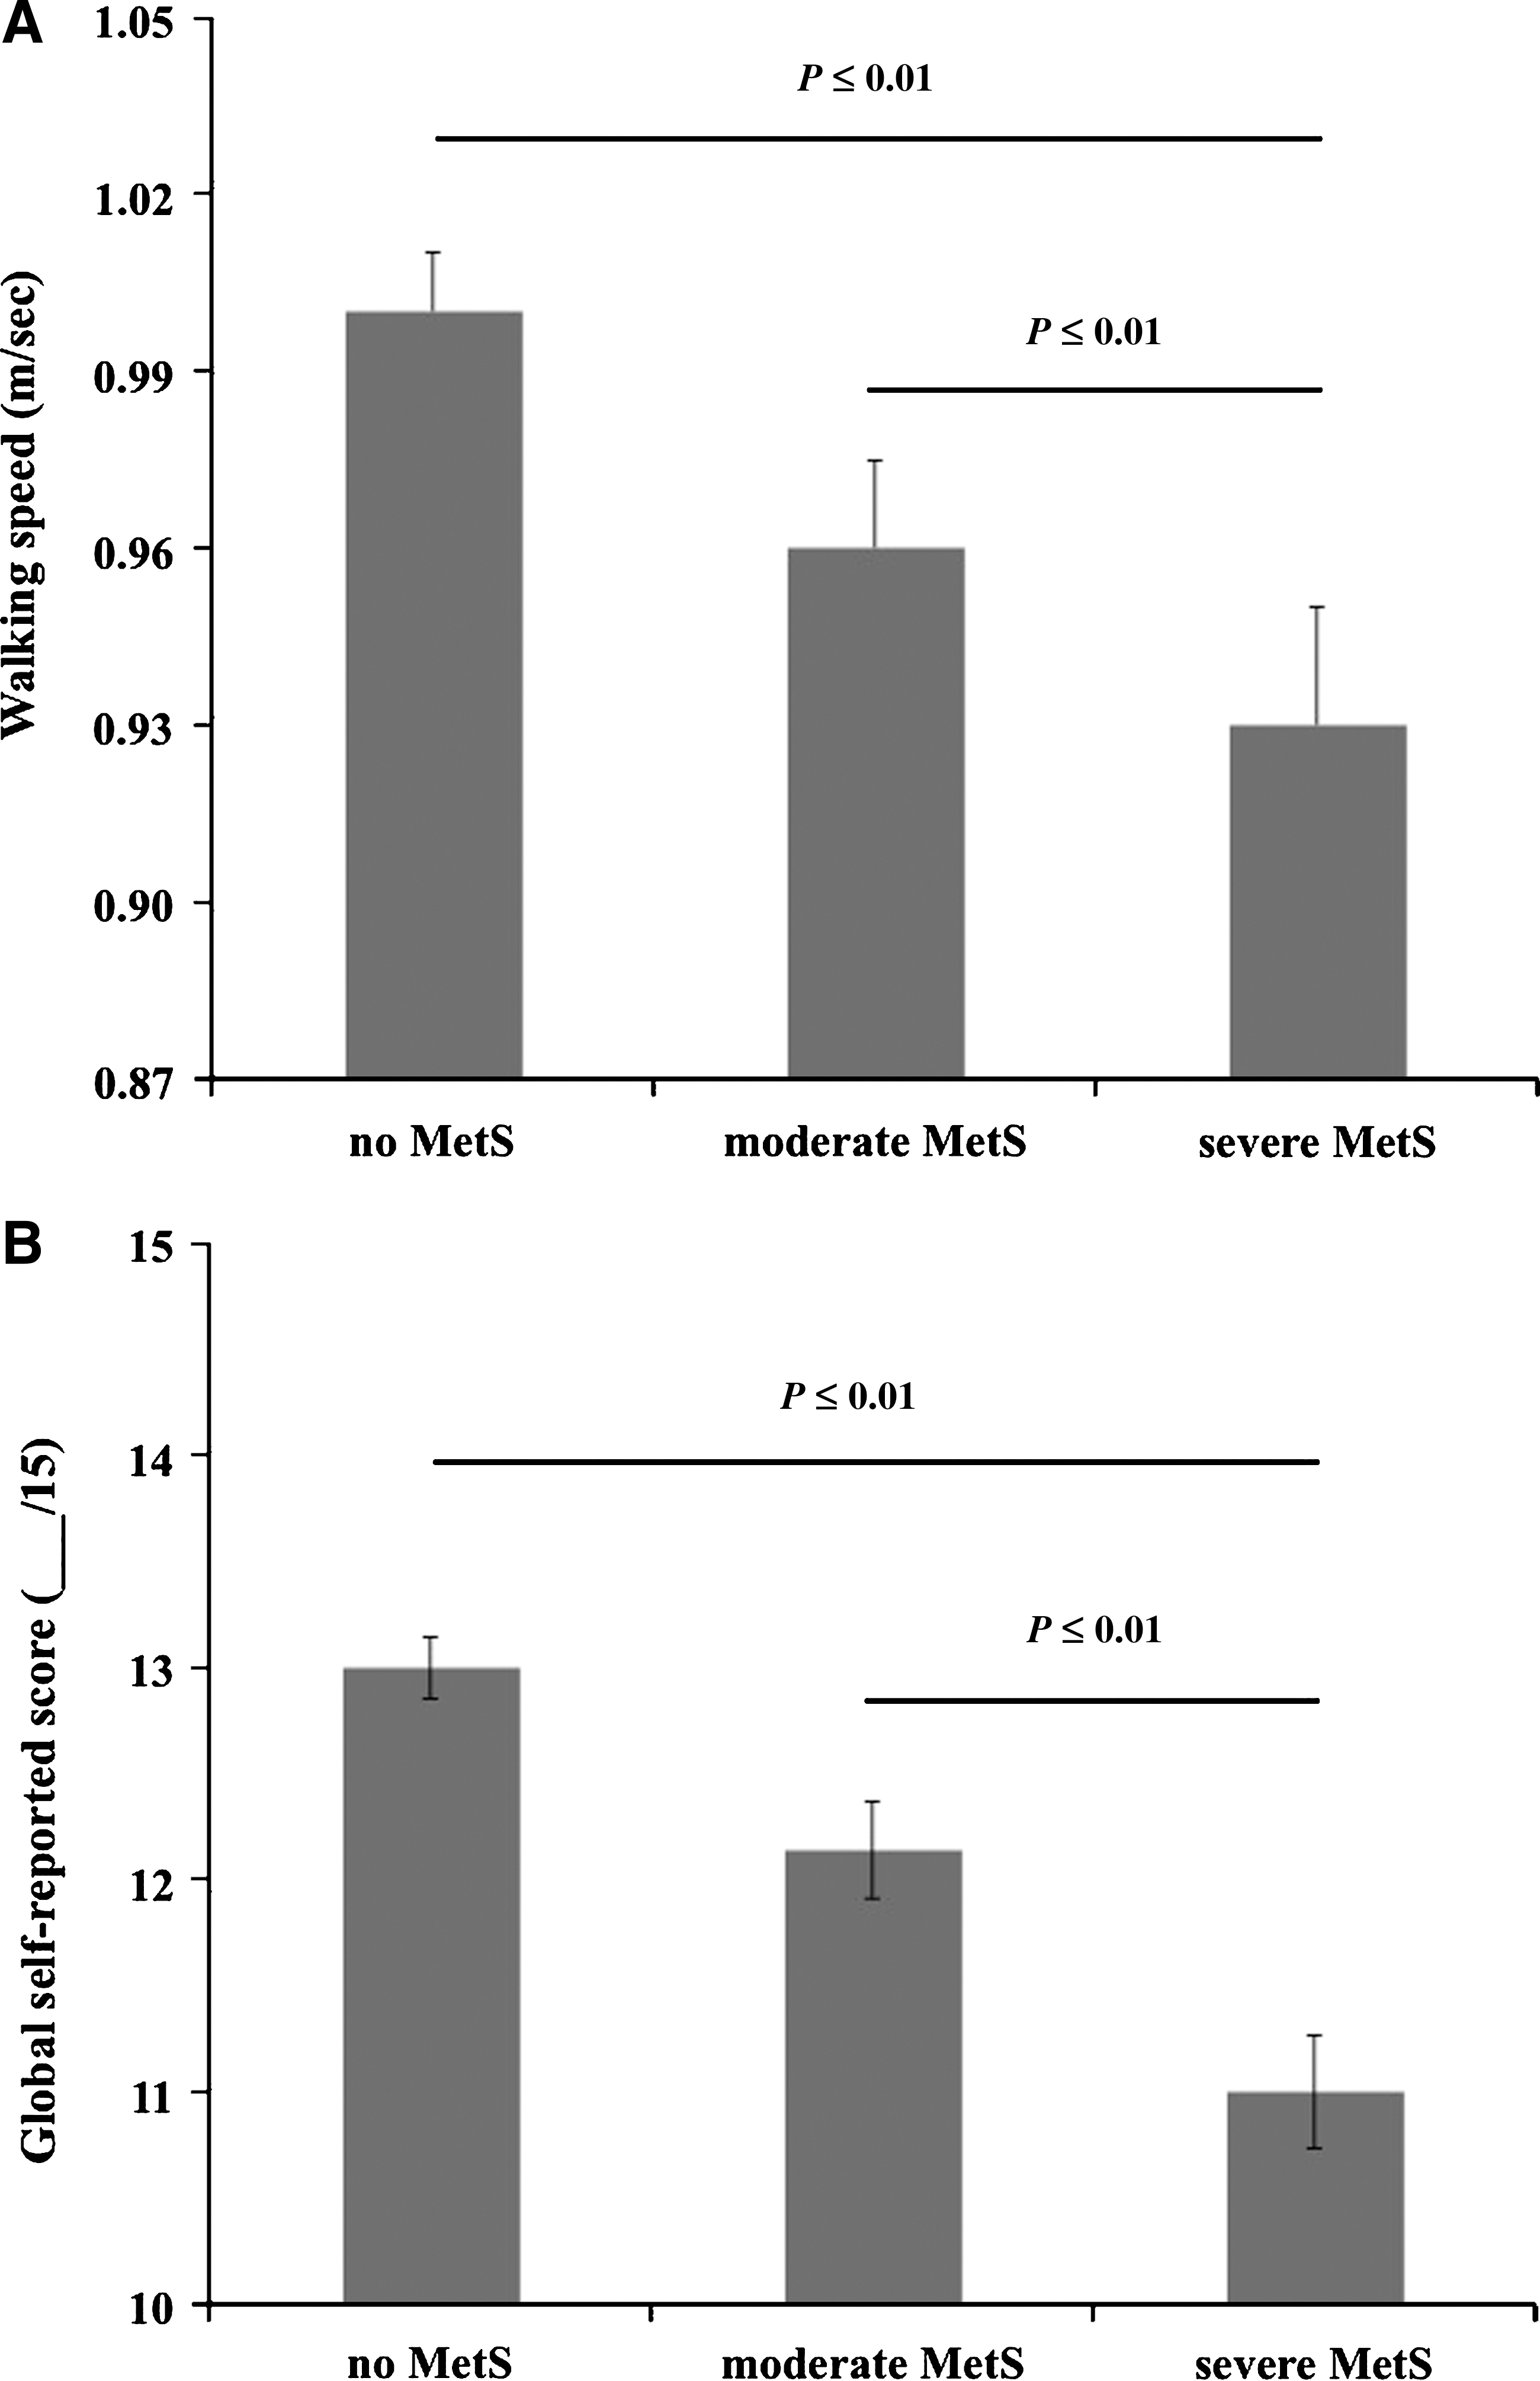
In subjects aged ≥50 years old, those in the severe metabolic syndrome group displayed a lower performance for the global physical capacity score (P≤0.01) and the walking speed test (P≤0.01) compared to the no metabolic syndrome and the moderate metabolic syndrome groups (both P<0.01). Finally, no difference was observed between the moderate metabolic syndrome and the no metabolic syndrome groups for these dependent variables (Fig. 2).
Conclusions
The present study shows that a greater proportion of adults aged ≥50 years presented severe metabolic syndrome (21.9%) compared with younger adults (8.0%). Also, women presented a higher prevalence of severe metabolic syndrome compared to men (<50 years, 76.3% vs. 20.7%; ≥50 years, 86.2% vs. 13.8%). No difference was observed among groups regarding dietary habits, whereas significant differences were observed for physical activity habits (intensity of physical activities and resistance training). Furthermore, in adults aged ≥50, the presence of severe metabolic syndrome was associated with more physical incapacities and lower walking capacity compared to individuals having no metabolic syndrome or displaying moderate metabolic syndrome.
In the present study, the fact that age was significantly different among groups was not surprising because it is well established that age is associated with the development of metabolic syndrome. In fact, data indicate that the prevalence of metabolic syndrome is higher in individuals after 65 years old. 3,20 Our results also showed that a greater proportion of women displaying severe metabolic syndrome compared to men. Similarly to us, Park et al. 21 in previous NHANES cycles reported a greater prevalence of metabolic syndrome in Mexican-American women compared to Mexican-American men (using the conventional metabolic syndrome definition). 22 Exploratory analyses in our sample confirmed a higher proportion of Hispanic women (49.5%) than Hispanic men (39.6%), including both moderate and severe metabolic syndrome (results not shown). However, our observations are surprising because recent data published by Ford et al. reported a higher prevalence of metabolic syndrome in men. 3 The gender disparity between our results and those of Ford et al. might be explained by differences in physical activity levels between the two samples. Unfortunately, physical activity was not reported in their study. The discrepancy may also be explained by the use of different metabolic syndrome definitions. In support of that, Villegas et al. 23 showed that the prevalence of metabolic syndrome in men and women was different depending the definition used.
Physical activity levels as well as CRF have been associated with metabolic syndrome. 24 Our findings extend previous research showing an association between metabolic syndrome and CRF in adults aged <50 years, as shown in Table 3. 25 Our results also showed that CRF was lower in subjects with severe metabolic syndrome compared to those displaying no metabolic syndrome or moderate metabolic syndrome. This result suggests that CRF differences previously reported between individuals with and without metabolic syndrome 25,26 might be simply the result of the inclusion of subjects having severe metabolic syndrome.
Contrary to what was observed for CRF, and despite a tendency, no significant difference among groups was observed for self-reported physical activity levels in older and younger individuals. This result is somewhat surprising in younger individuals considering the association previously reported between physical activity levels and CRF. 27 However, our results are similar to those obtained by Lakka et al., 28 who also reported that middle-aged men having low CRF were at greater risk of metabolic syndrome compared to those displaying high CRF. Similarly, in a review by Dionne et al., the authors concluded that CRF was associated more with health outcomes than with physical activity levels. 29 Consequently, this suggests that CRF would be a better determinant of metabolic syndrome than self-reported physical activity levels in younger individuals. It is also likely that objective measures of physical activity levels (such as using an accelerometer) would have been better than self-reported questionnaires to quantify the association with metabolic syndrome.
In individuals aged ≥50 years, despite no significant difference among groups for self-reported physical activity levels, those having severe metabolic syndrome reported doing less vigorous physical activities compared to those in the no metabolic syndrome and the moderate metabolic syndrome groups. This was only observed in the oldest age group, which may suggest that vigorous activities may play an important role in preventing more severe metabolic disorders in older adults. Studies pertaining to different intensity of exercises are needed in older adults to better understand the potential association between the severity of metabolic syndrome, physical activity levels, exercise intensity, and CRF.
As opposed to the association between aerobic exercise and metabolic syndrome, results from studies investigating the impact of resistance training on metabolic syndrome are inconsistent. 24,30 In fact, a review by Lakka and Laaksonen concluded that resistance training has a mild to moderate impact on metabolic syndrome, 30 whereas a more recent meta-analysis showed greater effects. 31 In the present study, the practice of resistance training was significantly lower in younger individuals displaying severe metabolic syndrome compared to those in the no metabolic syndrome group, whereas no difference was observed in subjects aged ≥50 years. On the basis of these results, it could be hypothesized that resistance training might have a greater impact on metabolic syndrome in adults aged <50 years due to a greater effect on muscle mass. 32 However, studies could have overestimated or underestimated the real impact of resistance training considering that no distinction was made between moderate and severe metabolic syndrome. 33
No difference among groups was observed for energy intake and diet quality. In terms of individual macro- and micronutrients, only total fat and fiber were different among groups, with no consistent pattern. The role of diet in the etiology of the metabolic syndrome remains unclear because some studies reported a significant association in older and younger individuals, 34 –36 whereas others reported limited or inconsistent results. 37,38
Our study shows that individuals aged ≥50 years displaying severe metabolic syndrome had more functional incapacities in comparison to the no metabolic syndrome and the moderate metabolic syndrome groups. This result extends previous associations between metabolic syndrome and physical capacity in older adults. 39 Also, linear regression analyses revealed that the metabolic syndrome status (none, moderate, and severe) was an independent predictor of physical capacity in older adults. Interestingly, no significant difference was observed between the no metabolic syndrome and the moderate metabolic syndrome groups in older individuals. This result suggests that combining subjects having moderate and severe metabolic syndrome may invalidate results of statistical analysis regarding the possible associations between metabolic syndrome and physical capacity. However, further studies are needed to investigate this aspect.
In summary, the present study indicates that the metabolic syndrome is a heterogeneous condition. In other words, there is a significant proportion of adults categorized as having metabolic syndrome that display greater metabolic alterations, which put them at greater risk of physical incapacity. Increasing physical activity volume and intensity as well as improving fitness might be a strategy to avoid the progression of metabolic syndrome. Finally, further studies are needed to validate our results and to explore other health outcomes.
Footnotes
Acknowledgments
Martin Sénéchal is supported by the Canadian Institutes of Health Research while I.J. Dionne is supported by Fonds de la recherche en santé du Québec.
Author Disclosure Statement
The authors declare no conflict of interest.