
Abstract
Background:
Despite established relationships between physical activity (PA) or physical fitness (fitness) and metabolic risk, the prospective association is not well understood. The purpose of this study was to determine whether metabolic risk in young adults is associated with 20-year PA or fitness trajectories.
Methods:
Young adults were from the Coronary Artery Risk Development in Young Adults (CARDIA) study, baseline ages 18–30 years (n=4161). PA was determined from a self-reported questionnaire administered at baseline and at follow-up exams at years 2, 5, 7, 10, 15, and 20. Fitness (seconds) was estimated from a graded exercise treadmill test at baseline and years 7 and 20. Baseline metabolic risk was calculated using age-adjusted principal components analysis (elevated=top 10% of first factor), for each sex–race group, from mean arterial pressure, glucose, waist circumference, triglycerides, and high-density lipoprotein cholesterol. Repeated measures general linear modeling estimated PA and fitness trajectories over 20 years, separately in sex–race groups, adjusting for age and smoking status.
Results:
PA was significantly lower among those with elevated metabolic risk compared with normal risk at baseline and each subsequent time point (black and white men, white women; all P<0.0001; black women P=0.27). Significant and consistent results were also found with fitness trajectories for all sex–race groups (P<0.0001). Despite these lower PA and fitness levels at baseline in young adults with elevated metabolic compared with normal risk, 20-year trajectories declined at similar rates.
Conclusion:
Elevated metabolic risk is associated with lower levels of PA and fitness in early adulthood, and these differences persist over 20 years.
Introduction
Despite these established relationships between PA or fitness and metabolic risk, the prospective association of metabolic risk with future levels of PA or fitness is not well understood. Ferreira et al. found that young adults with metabolic syndrome had an increase in lower intensities of PA, a decrease in higher intensities of PA, and a decrease in fitness over a period of 23 years. 14 This study was one of the first to examine longitudinal patterns of these PA characteristics, and it was done from adolescence into young adulthood (through age 36). Thus, the aim of this study was to examine the 20-year longitudinal trajectories of PA and fitness of adults through middle age and their association with metabolic risk. This research will provide insights into the relationship between an individual's metabolic risk and the observed PA and fitness patterns through adulthood across sex–race groups.
Methods
Longitudinal data from the multicenter Coronary Artery Risk Development in Young Adults (CARDIA) were used for this study. CARDIA began in 1985–1986 with 5115 black and white adults (baseline ages 18–30 years). Details of the study design, protocol, and procedures have been published previously. 16 All participants gave written informed consent prior to each measurement, and all procedures were given Institutional Review Board (IRB) approval from each study site at each examination. After baseline assessment, participants were followed up at years 2, 5, 7, 10, 15, and 20, with 90%, 86%, 81%, 79%, 74%, and 72%, respectively, of the surviving cohort returning, and measured for various cardiometabolic factors and lifestyle behaviors. Specific variables included in this analysis are outlined below.
Information regarding age, race/ethnicity, cigarette use, medications, and medical history was obtained through questionnaire. Cigarette smoking (former, never, current) was obtained from a self-administered questionnaire.
Height and weight were measured in light clothing, with removal of shoes. Body mass index (kg/m2) was calculated. Waist circumference was measured in duplicate and averaged, at the narrowest abdominal girth to the nearest 0.5 cm.
Cardiometabolic risk factors
Cardiometabolic risk factors were taken at baseline according to standard CARDIA procedures. 16 Following a 5-min rest, blood pressure was assessed in triplicate, 1-min apart, from the right arm using a Hawksley random-zero sphygmomanometer. The average of the second and third measures for systolic and diastolic (Phase I and Phase V Korotkoff sounds) were used for the analysis.
Participants were instructed to fast ≥12 hr before blood laboratory assessment. Detailed descriptions of the lipid and metabolic measurement and quality control have been previously reported. 17 Blood was drawn into EDTA vacutainers, separated into plasma and serum, and frozen and shipped to the central laboratory overnight for analysis. Serum insulin was measured by radioimmunoassay, and glucose was measured with the hexokinase method. 4 Insulin resistance was estimated by the homeostasis model of insulin resistance (HOMA-IR) and calculated by [(fasting glucose (mmol/L)*fasting insulin (μU/mL)/22.5]. 18 Plasma cholesterol and triglycerides were determined using enzymatic procedures, 19 and high-density lipoprotein cholesterol (HDL-C) after precipitation with dextrate sulfate magnesium chloride. 20 Diabetes status at baseline was assessed by self-report.
Physical activity
Participants were asked about the frequency of participation in 13 different activity categories (8 vigorous; 5 moderate) of recreational sports, exercise, leisure, and occupational activities over the previous 12 months. Vigorous activities included running, racquet sports, bicycling faster than 10 miles per hour, swimming, vigorous exercise classes, sports (e.g., basketball, football), heavy lifting, carrying or digging on the job, and home activities such as snow shoveling and lifting heavy objects. Moderate activities included nonstrenuous sports (e.g., softball), walking, bowling/golf, home maintenance (e.g., gardening, raking), or calisthenics. A total PA score was computed by multiplying the number of months of participation by the intensity of the activity with a weighting factor for the months of more frequent participation, and then summing all activities. Because participants were not asked explicitly about duration of activity, PA scores are expressed in exercise units. This questionnaire has been validated to assess leisure and work time PA. 21
Physical fitness
Prior to the fitness test, participants were asked to perform an overnight fast and refrain from smoking. Eligible participants had symptom-limited maximal graded exercise tests using a modified Balke treadmill protocol at the baseline visit, year 7, and year 20. The exercise test protocol consisted of nine, 2-min stages that increased in difficulty. Fitness was determined with duration (seconds) from the graded exercise test. At year 7, a procedural violation occurred in Minneapolis, MN, and the resulting data were eliminated for individuals at this site during this year. However participants from Minneapolis, MN, remained in physical fitness analyses if they had data at any previous and/or subsequent time point, resulting in 9 individuals being eliminated from the dataset. Therefore, data are limited to a subsample of participants with valid data at any of the three time points (baseline, year 7 and year 20).
Metabolic risk
Metabolic risk was estimated at baseline by principal components analysis (PCA) separately within sex and race and also controlling for age. Cardiometabolic risk factors for the analysis included mean arterial blood pressure (MAP) [1/3(systolic blood pressure−diastolic blood pressure)+diastolic blood pressure], glucose, insulin, HDL-C, triglycerides, and waist circumference. Glucose, insulin, and triglycerides were log-transformed due to nonnormality. We classified those at elevated metabolic risk as individuals exceeding the top 10% of the continuous scores for the first factor within the sex–race groups.
A total of 5115 participants were available for the current analysis. Cardiometabolic risk factors that were more than three standard deviations (SD) from the mean (log-transformed data were used for nonnormal variables) were eliminated as potential outliers (n=168) before PCA. Participants were excluded if they had diabetes at baseline (n=43), were pregnant, did not know pregnancy or breastfeeding status (n=98), or did not have a fasted blood draw (n=429). Finally, participants who were missing data for risk factors (n=109), smoking (n=82), or fitness (n=25) were also excluded from this analysis. The final sample size was n=4161 (81% of original sample size) for all analyses.
Statistical analyses
All statistical analyses were performed using SAS software version 9.2 (SAS Institute, Cary, NC). t-tests determined differences in the cardiometabolic risk factors within and between sex and race and between metabolic risk groups within sex. Trajectories of PA and fitness were determined using linear mixed modeling with repeated measures (SAS Proc Mixed), separately within men and women. For this analysis, the outcome or dependent variable was PA levels over time (year 0, 2, 5, 7, 10, 15, 20) or physical fitness levels over time (year 0, 7, 20). CARDIA participants were included if they had at least one PA or fitness measurement at any of the time points. The mean number of PA measures within an individual was 5.7±1.8 (maximum of 7), and the mean number of fitness measures within an individual was 2.1±0.8 (maximum of 3). Our primary independent variable of interest was baseline metabolic risk (elevated risk vs. normal risk). Other covariates included time, age at baseline, smoking status, and race/ethnicity. To account for various trajectory shapes over the 20-year period, we included a squared and cubic term for time in the initial model, and nonsignificant terms were removed in a backward elimination. The cubic term was not significant and thus removed from all final PA and fitness models. The squared time term (positive) was significant and remained in all the final models for PA, indicating a plateauing of the trajectory over time. The squared time term was not significant for fitness, and was removed. We next examined two- and three-way interactions between metabolic risk, time, and race within the sex-stratified models. The three-way interactions were significant (P≤0.0001), so we chose to stratify our models further by race/ethnicity groups—white men, black men, white women, and black women. The final model fitting did not show any two-way interaction terms of metabolic risk and time for any of the sex-race specific models, indicating that there was no significant difference in rate of decline between the metabolic risk groups, so they were removed from the final models. Additional information on model fit can be found in Table S1 (Supplementary Data are available at
Results
Baseline characteristics (mean±SD) of the CARDIA subsample (n=4161) are presented in Table 1. The mean age was 24.8±3.6 years of age, and the cohort consisted of 22% black men, 23% white men, 28% black women, and 27% white women. Significant differences between sex–race groups did occur for demographic characteristics and cardiometabolic risk factors.
Significant difference between race within sex by t-test (P≤0.05).
Significant difference between sex within race by t-test (P≤0.05).
Note: Due to missing data, BMI for white women is n=1119; AA women n=1149.
CARDIA, Coronary Artery Risk Development in Young Adults; SD, standard deviation; BMI, body mass index; HDL-C, high-density lipoprotein cholesterol; HOMA-IR, homeostasis model assessment of insulin resistance.
As previously mentioned, per our statistical design, 10% of each sex–race group was classified with elevated metabolic risk. Table 2 presents the cardiometabolic risk factors characteristics between the elevated and normal metabolic risk groups within sex–race groups. Except for age, all cardiometabolic risk factors were significantly different between those with elevated metabolic risk versus those with normal metabolic risk, within sex–race groups.
Significant difference between those with elevated metabolic risk vs. normal risk within gender by t-test (P≤0.05).
CARDIA, Coronary Artery Risk Development in Young Adults; SD, standard deviation; BMI, body mass index; HDL-C, high-density lipoprotein cholesterol; HOMA-IR.
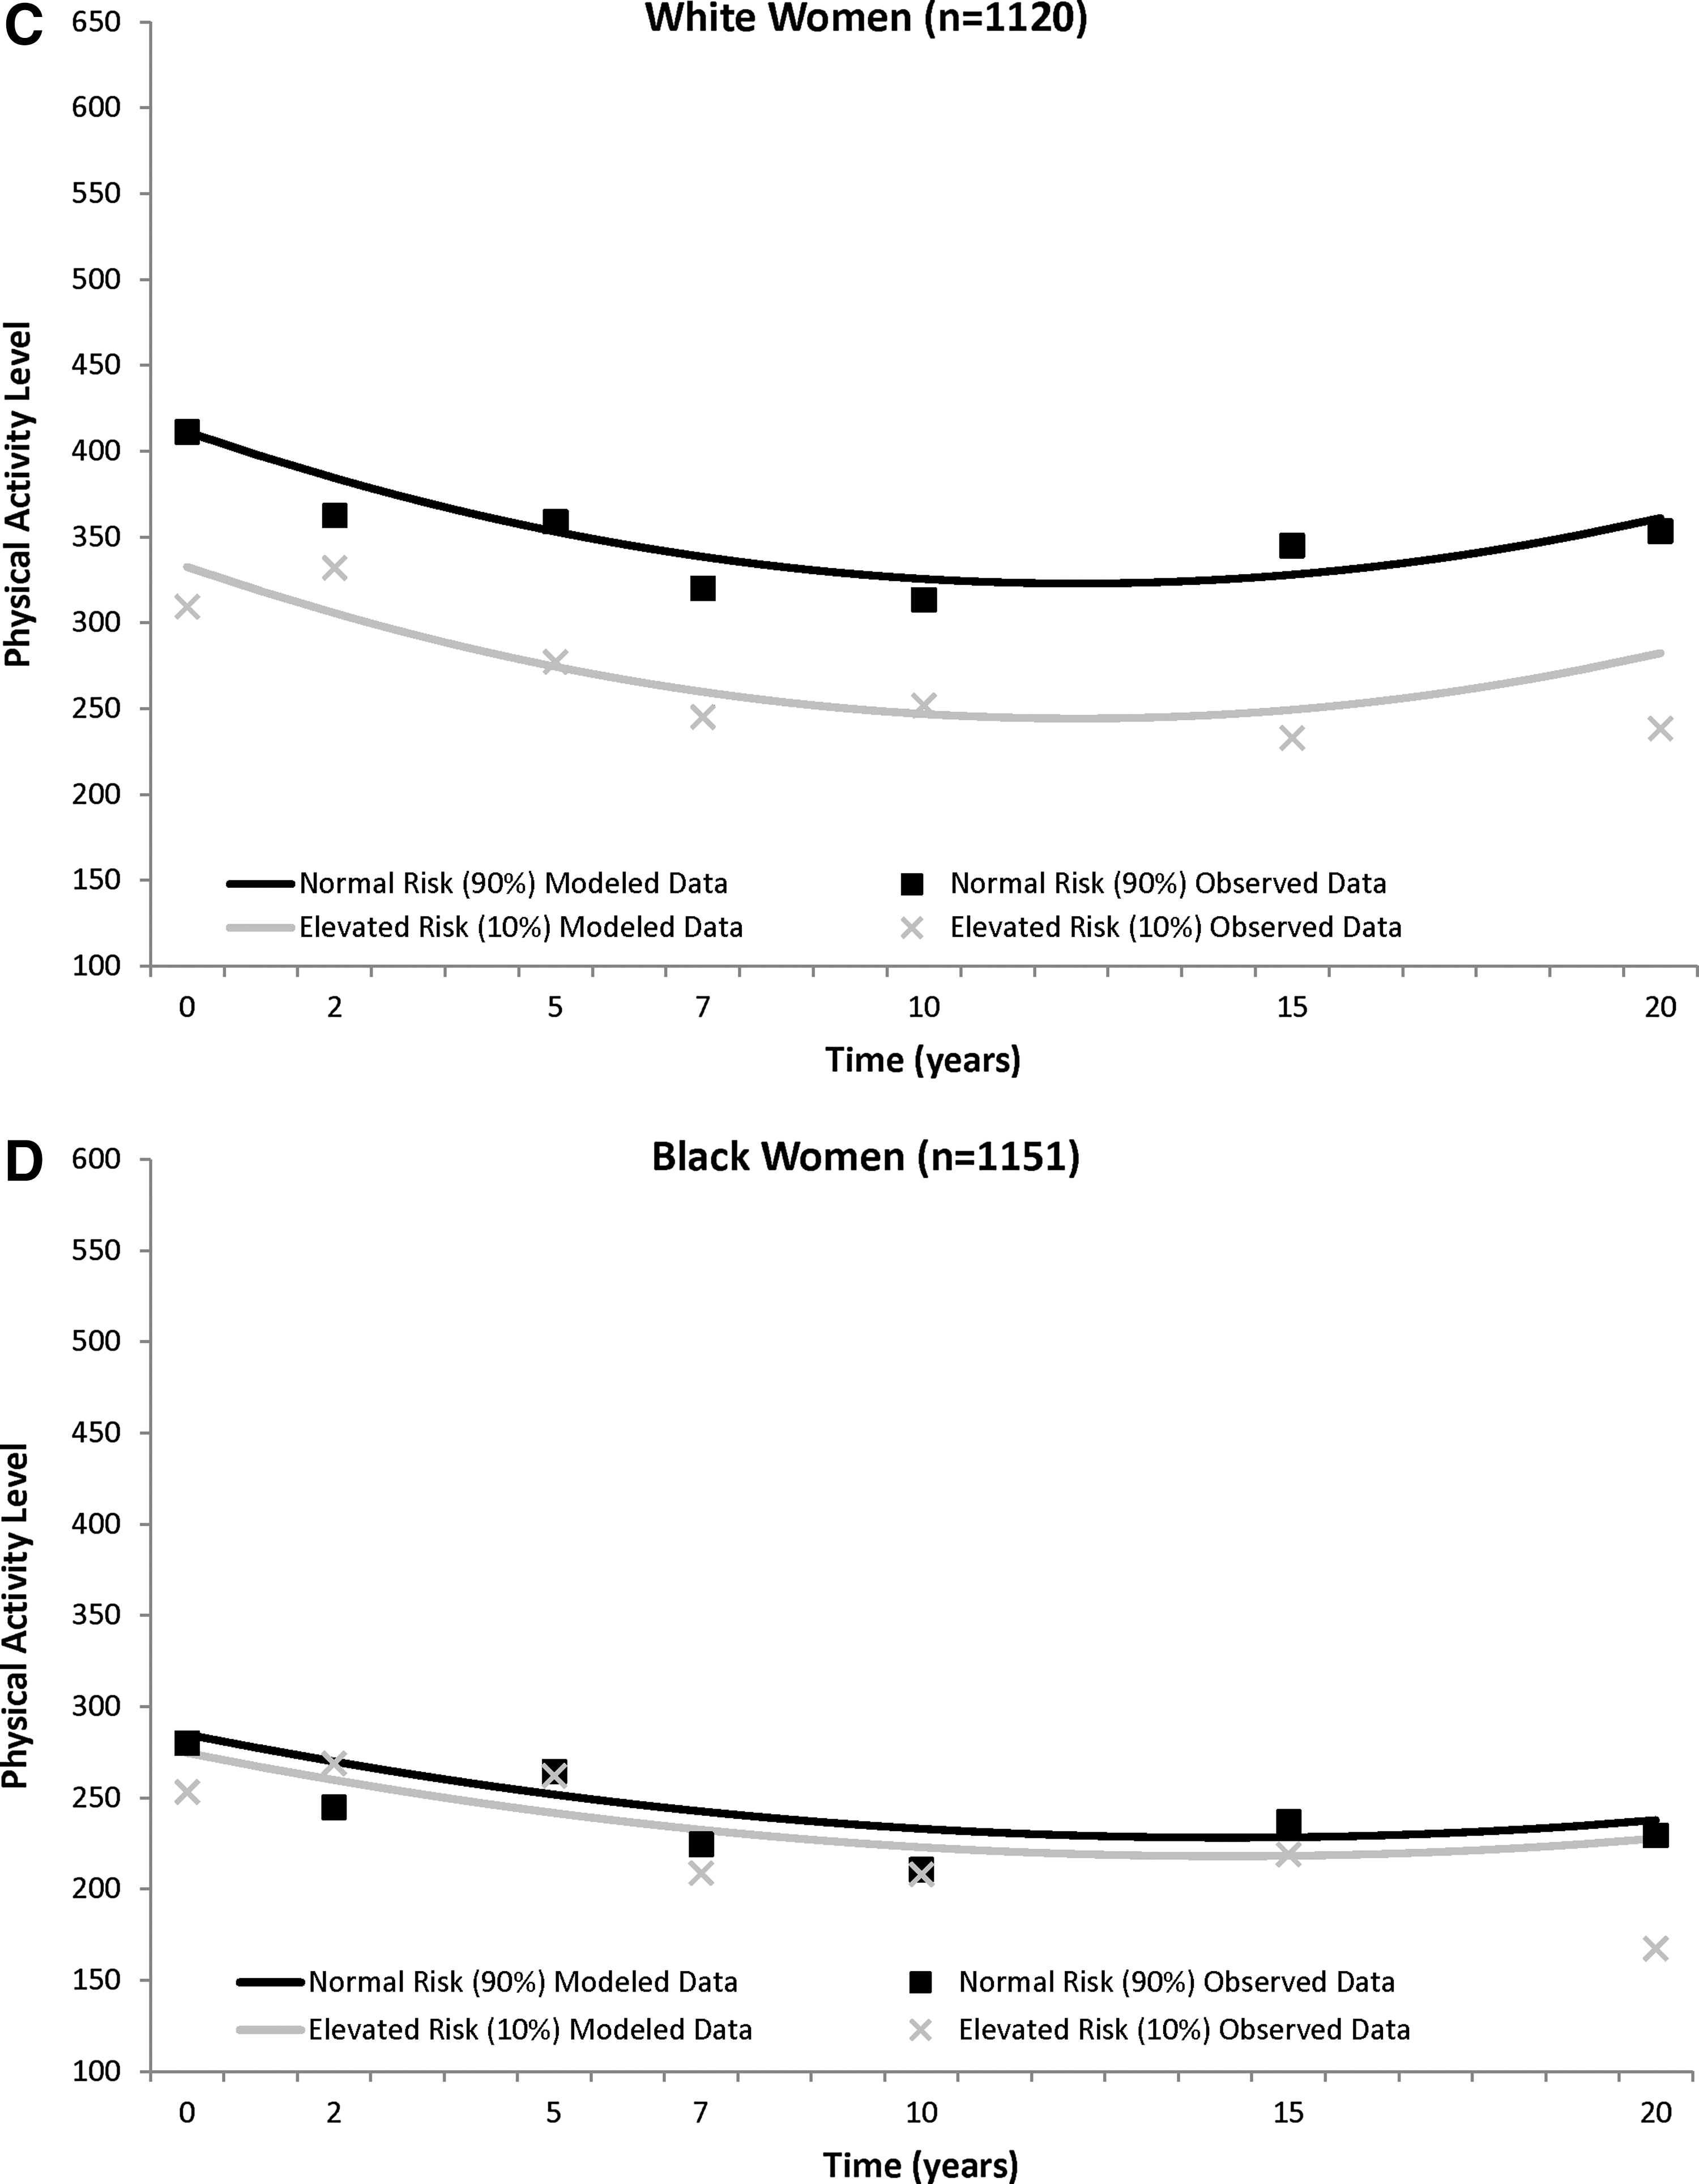
In general, the PA trajectories showed a general decline over time that plateaued in all four sex–race groups (Fig. 1), with most of the decline occurring in the first half of follow-up. In black men, white men, and white women, those with elevated metabolic risk at baseline had significantly lower baseline PA levels when compared to their normal risk counterparts [elevated risk vs. normal risk, mean±standard error (SE)]: black men, 440.7±18.1 vs. 539.6±10.7; white men, 444.9±14.0 vs. 515.7±8.1; white women, 332.5±11.3 vs. 411.2±6.6), and this PA difference between those with elevated versus normal metabolic risk remained significant through 20 year follow-up (black men, −98.9±16.4), white men, −70.8±12.5; white women, −78.7±10.2; all p<0.0001). There were no differences in black women with or without elevated metabolic risk for PA levels at baseline, or at any point of follow-up (elevated risk vs. normal risk, 274.7±10.5 vs. 284.8±6.4; difference, −10.1±9.3, P=0.27).
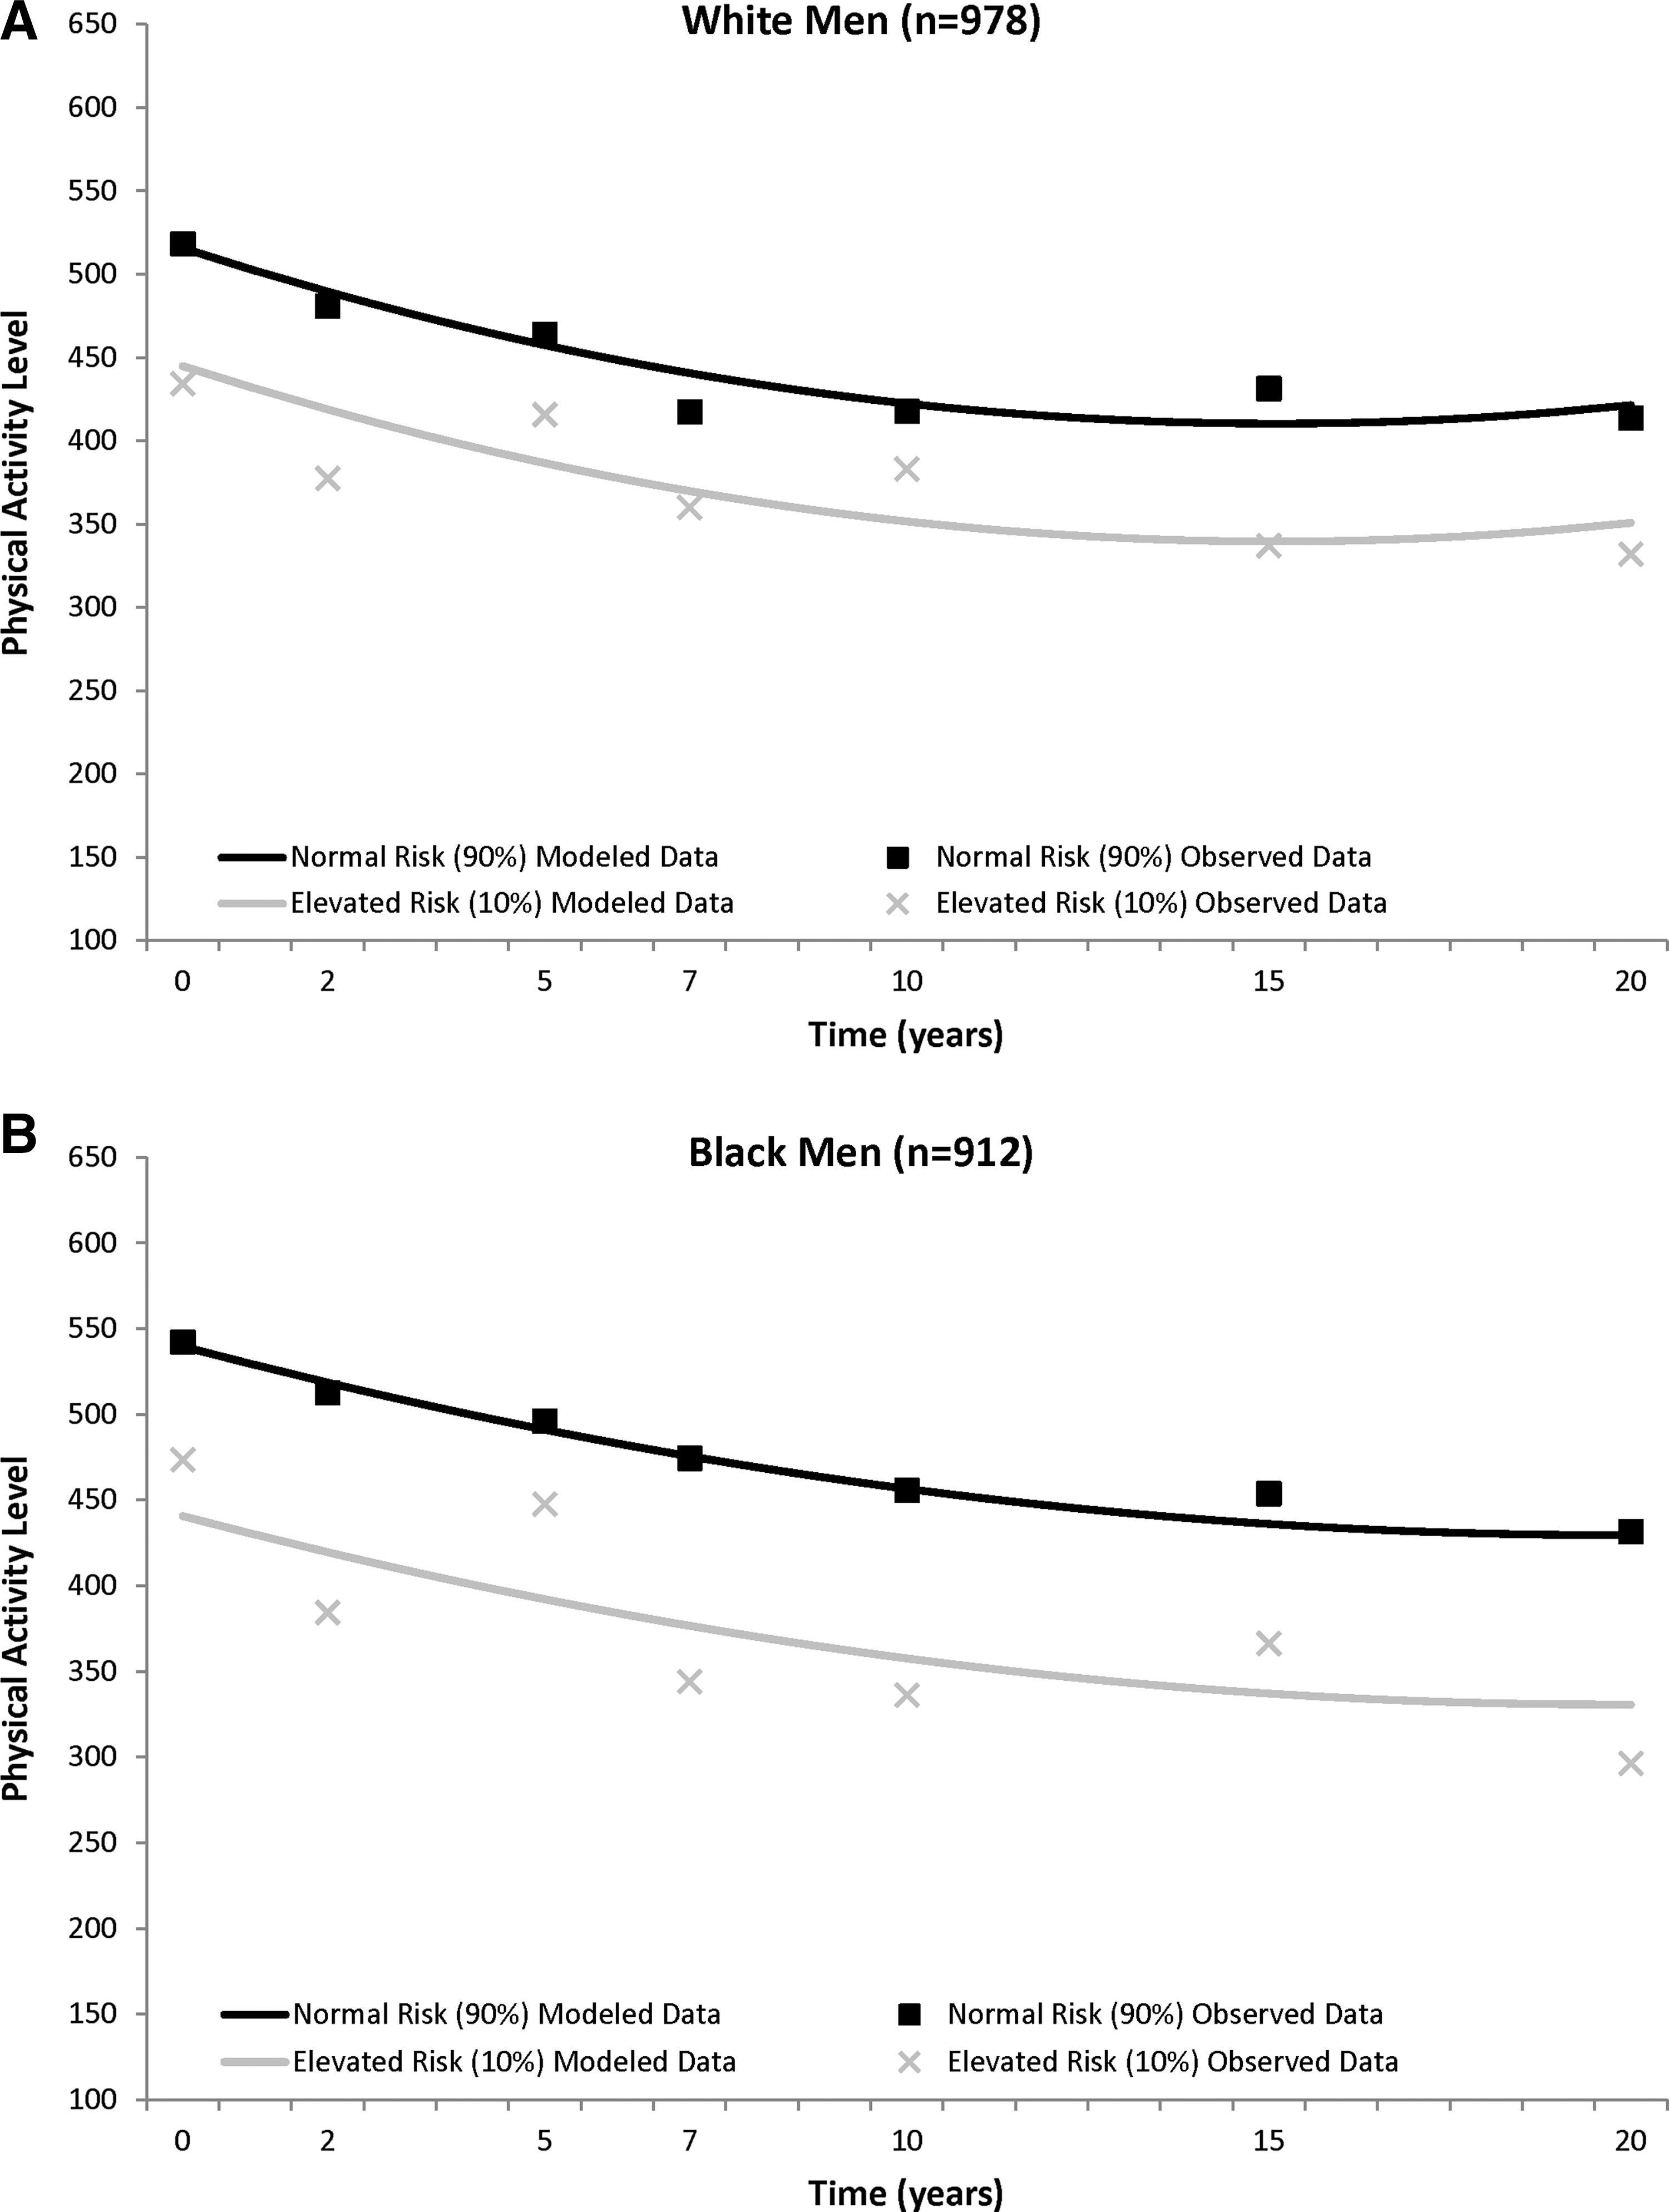
CARDIA (1985–2005) trajectory of physical activity (least squared means) over 20 years between those with normal and elevated metabolic risk in white men
The fitness trajectories show a steady decrease over time in the sex–race groups (Fig. 2). Those classified as having elevated metabolic risk had lower baseline fitness levels in all sex–race groups [elevated risk vs. normal risk (sec), black men, 549.4±11.0 vs. 680.5±5.1; white men, 612.9±10.0 vs. 741.2±4.4; black women, 353.4±8.1 vs. 440.9±4.0; white women, 420.4±9.5 vs. 566.9±4.0], and this significant fitness difference between those with elevated risk and normal risk was maintained over 20 years (black men, −131.1±11.0; white men, −128.3±9.9; black women, −87.6±8.0; white women, −146.5±9.6; all P<0.0001). (Information on both PA and fitness model fit statistics is provided in Table S1).

CARDIA (1985–2005) trajectory of physical fitness (least squared means) over 20 years between those with normal and elevated metabolic risk in white men

Discussion
In general, participants with elevated metabolic risk had lower baseline levels of PA and fitness and a similar magnitude of decline for both PA and fitness over 20 years when compared to their normal metabolic risk counterparts. Thus, the differences in PA and fitness that existed at baseline persist over 20 years. The relationship between PA or fitness and metabolic risk was consistent across sex–race groups, although the PA association was not significant in black women.
Previous studies have established that those with abnormal risk factors or metabolic syndrome at follow-up were more likely to have lower PA 13,15,22 or fitness 8,15,23,24 at baseline. Our study is unique in that we examined PA and fitness, prospectively, in adults with and without elevated metabolic risk at baseline. This allowed us to observe the natural course of PA behavior, as well as a measured outcome of PA (fitness), in those individuals already identified at varying risk for developing chronic disease at a young age. Ferreira et al. studied the longitudinal patterns of PA and fitness in young adults who developed metabolic syndrome at 36 years. 14 We were able to extend his findings from young adulthood (baseline mean, 24.8±3.6 years) to middle adulthood (45.1±3.6 years). This interval of time in aging represents a crucial period for chronic disease development and progression, and possibly an opportune time for modification of lifestyle habits such as PA.
Possible explanations for the lack of significant findings for the association between PA and metabolic risk in black women may be due to lower overall PA levels. Black women had the lowest levels of PA at any given time point compared with any of sex–race group. Lower PA levels may have led to less variability, which could have decreased statistical power to detect a significant association. However, despite the lack of significance for PA, the fitness levels were significantly different in black women at baseline and over the subsequent 20 years. Fitness is an objective measure of PA patterns and behaviors, and thus may be a more sensitive marker of PA levels. In CARDIA, fitness was measured through a laboratory treadmill test, where time in seconds was the outcome, and PA was estimated via self-reported questionnaire. Therefore, fitness may have been a more sensitive measure to detect overall outcomes of PA. These results imply that black women may be more at risk for having low PA and fitness measures, regardless of metabolic risk status, and thus, may be an important target group for lifestyle intervention in early adulthood, findings which are consistent with other studies. 25
As previously mentioned, the interaction of time and metabolic risk was not significant in any of the statistical models and was not included in the final models. These findings suggest that the rate of decline was similar for both PA and fitness, regardless of whether a person was classified as having elevated metabolic risk at baseline or not. Although those with high metabolic risk did start at lower PA and fitness levels initially, the rate and pattern of decline was no different over 20 years between those with elevated and normal metabolic risk. The majority of the decline in PA occurred in the first 10 years of follow-up in all groups, suggesting that early adulthood is a key target for intervention. These results could imply that if PA or fitness levels were modified, stabilized, or increased in young individuals with elevated metabolic risk at baseline or throughout the early transition from young adulthood into middle adulthood, it may be possible to alter their PA or fitness trajectory over time, thus ultimately minimizing or eliminating the absolute differences in PA and fitness found at baseline. Because metabolic risk is associated with PA and fitness patterns over time, we can consider that while an individual improves PA or fitness, they may also be improving metabolic health. 26 Future lifestyle intervention research is necessary to support these claims.
The use of CARDIA, a richly phenotyped and well-characterized dataset, is a marked strength of this study. Although the attrition rate may introduce a potential bias, CARDIA's standardized clinical measurements over 20 years allow us a distinctive perspective on the natural PA and fitness behavior in adults. We were able to control for known influence of PA, fitness, or metabolic risk such as age, sex, race, and smoking status. This research examines the association between metabolic risk and PA or fitness trajectory, but this relationship does not imply causation. Furthermore, our definition of elevated metabolic risk used a statistical method that identified the top 10% of those with multiple abnormal baseline risk factors. Because results revealed significant differences in cardiometabolic risk factors for both race and sex, we felt it was important to identify elevated risk within each sex–race group. Limitations also include the inability to determine the directionality for the associations observed. Those at high metabolic risk at baseline had lower levels of PA and fitness, which may have been either a result of or because of their metabolic status. Another limitation relates to our inability to control for possible changes in metabolic status over time. However, our main objective was to compare PA and fitness trajectories of individuals at elevated and normal risk as young adults.
PCA analysis is a useful epidemiological tool; however, it can be difficult to translate these results into a clinical setting. 27 We also ran an analysis that examined the harmonious metabolic syndrome defined by the Joint Interim Statement, 28 a clinical tool to identify elevated metabolic risk. Unfortunately, at baseline we only identified n=67 (1.6%) with metabolic syndrome, which is drastically reduced from current national estimates of 34%. 29 This may be due to either the young age at baseline (18–36 years), and/or data collection in 1985–1986, which may not have adequately captured the effects of the current obesity epidemic on cardiovascular health. We did not have adequate power to detect differences in PA and fitness between those with and without metabolic syndrome, so we modified our definition to reflect “elevated cardiometabolic risk” within the cohort using PCA analysis. PCA has been used previously to define and describe metabolic risk, 1,30 –34 has been recommended for use in epidemiologic research, 27 and is encouraged by the American Diabetes Association and the European Association for the Study of Diabetes. 35 Thus, we felt that this analysis of the CARDIA cohort followed over 20 years was an excellent and informative application of PCA to describe metabolic risk. However, efforts should be made to replicate the results in other cohorts to better generalize the results to other populations. Despite these limitations, we were able to identify a specific target group (elevated metabolic risk) in need of early adulthood lifestyle intervention.
In summary, we found that individuals with elevated metabolic risk in young adulthood are not only more likely to have low levels of PA and fitness, but these differences persisted in PA and fitness over 20 years. These findings were generally consistent across all sex–race groups. Ultimately, the identification of young adults at increased risk for chronic disease development and progression could warrant early and possibly long-term lifestyle and behavioral intervention to not only increase baseline PA and fitness, but also prevent or slow further declines in PA or fitness over time. With the increasing prevalence metabolic syndrome 36 and overall time spent in sedentary behavior 37 in American adults, identifying those at risk for both health risks is a public health priority and an important first step in improving overall health.
Footnotes
Acknowledgments
No funding was provided for this work.
Author Disclosure Statement
No competing financial conflicts of interest exist.
References
Supplementary Material
Please find the following supplemental material available below.
For Open Access articles published under a Creative Commons License, all supplemental material carries the same license as the article it is associated with.
For non-Open Access articles published, all supplemental material carries a non-exclusive license, and permission requests for re-use of supplemental material or any part of supplemental material shall be sent directly to the copyright owner as specified in the copyright notice associated with the article.