
Abstract
Background:
Waist-to-height ratio (WHtR) has been shown to be a better discriminator of cardiovascular risk than waist circumference (WC). The purpose of this study was to determine whether cardiometabolic risk is increased in men showing large WC but not showing high WHtR.
Methods:
Subjects (26,017 middle-aged men) were divided into four groups of normal WC (<85 cm) and normal WHtR (<0.5), large WC (≥85 cm) but normal WHtR, normal WC but high WHtR (≥0.5), and large WC and high WHtR. Odds ratios (ORs) of each group versus the group with normal WC and normal WHtR for each cardiometabolic risk factor were calculated after adjustment for age, alcohol drinking, smoking, and regular exercise.
Results:
Subjects showing large WC but normal WHtR and subjects showing normal WC but high WHtR were 6.1% and 4.5%, respectively, of all subjects. ORs of subjects with large WC but normal WHtR versus subjects with normal WC and normal WHtR for hyperglycemia [1.80 (95% confidence interval, CI, 1.55– 2.09)], dyslipidemia [2.28 (95% CI 2.05–2.54)], high blood pressure [1.86 (95% CI 1.67–2.07)], and a cluster of these three risk factors [3.10 (95% CI 2.46–3.92)] were significantly higher than a reference level of 1.00 (p<0.01) and were comparable with the ORs of subjects with normal WC but high WHtR.
Conclusion:
Cardiometabolic risk was significantly increased in subjects with large WC and normal WHtR, and thus it is recommended to use both WC and WHtR for a more correct diagnosis of central obesity.
Introduction
Methods
Subjects
Subjects were 26,017 Japanese men aged 35–55 years who had received periodic health checkup examinations at workplaces in Yamagata Prefecture in Japan. The subjects were recruited from a list of people receiving a set of annual health checkup examinations from April, 2008, to March, 2009. In Japan, workers in companies with 50 employees or more must undergo annual health checkups, and the companies are required by law to pay the costs for health checkups of the workers. The present study used a database of workers supplied from a large health checkup company. The number of overall subjects included in this database corresponds to about 15% of the total population in Yamagata Prefecture, which has a total population of about 1.2 million; and workers at various kinds of companies (e.g., construction, manufacturing, information and communications, transport, wholesale and retail trade, eating and drinking places, accommodations, and services) were included in the subjects. A cross-sectional study was performed using a local population-based database for the above subjects. This study was approved by the Ethics Committee of Yamagata University School of Medicine. Histories of alcohol consumption, cigarette smoking, regular exercise (almost every day with exercise for 30 min or longer per day), and illness were surveyed by questionnaires.
Measurements
Height and body weight were measured while subjects wore light clothes at the health checkup. BMI was calculated as weight in kilograms divided by the square of height in meters. WC was measured at the navel level according to the recommendation of the definition of the Japanese Committee for the Diagnostic Criteria of Metabolic Syndrome. 4 Cutoff values of WC, WHtR, and BMI used were 85 cm, 0.5, and 25 kg/m2, respectively. 4,6,10 Subjects were divided by WC and WHtR into four groups as follows: (1) subjects showing neither large WC nor high WHtR (normal WC/WHtR group), (2) subjects showing large WC but not showing high WHtR (large WC group), (3) subjects showing high WHtR but not showing large WC (high WHtR group), and (4) subjects showing large WC and high WHtR (large WC/high WHtR group).
Fasting blood was sampled from each subject, and serum high-density lipoprotein cholesterol (HDL-C) and triglycerides (TG) were measured by enzymatic methods using the commercial kits, Cholestest N-HDL and Pureauto S TG-N (Sekisui Medical Co., Ltd, Tokyo, Japan), respectively. Blood glycosylated hemoglobin (HbA1c), which reflects glucose tolerance status more correctly than does blood glucose, was used for evaluation of hyperglycemia. HbA1c was determined by the latex cohesion method using a commercial kit (Determiner HbA1c, Kyowa Medex, Tokyo, Japan). The method for determination of HbA1c in this study was certificated by the National Glycohemoglobin Standardization Program (NGSP). Coefficients of variation for reproducibility of each measurement were ≤5% for HDL-C, ≤3% for TG, and ≤5% for HbA1c. The criterion for each variable was defined as follows: High blood pressure, systolic blood pressure (SBP) ≥130 mmHg and/or diastolic blood pressure (DBP) ≥85 mmHg; low HDL-C, HDL-C <40 mg/dL; and high TG, TG ≥150 mg/dL. HbA1c was measured by the NGSP technique using latex cohesion. However, standards of HbA1c used for measurement are different in the NGSP method and the Japan Diabetes Society (JDS) method. HbA1c values were therefore calibrated by using a formula proposed by JDS: HbA1c (NGSP) (%)=1.02×HbA1c (JDS) (%)+0.25%. 11 Hyperglycemia including diabetes and prediabetes was defined as HbA1c ≥5.7%. Subjects receiving drug therapy for hypertension, dyslipidemia, and diabetes were included in the high blood pressure, dyslipidemia, and hyperglycemia groups, respectively. A cluster of cardiometabolic risk factors was defined as three risk factors of high blood pressure, dyslipidemia (low HDL-C and/or high TG), and hyperglycemia.
Statistical analysis
Statistical analyses were performed using a computer software program (SPSS version 16.0 J for Windows, Chicago, IL). Percentages of smokers, drinkers, subjects doing regular exercise, subjects receiving therapy for hypertension, dyslipidemia or diabetes, and subjects with high blood pressure, hyperglycemia, dyslipidemia, or a cluster of cardiometabolic risk factors were compared between each group pair using the chi-squared test for independence. Mean levels of each variable were compared using analysis of variance followed by Scheffé's F-test in univariate analysis and analysis of covariance followed by the Student t-test after Bonferroni correction in multivariate analysis. Because TG and the TG/HDL-C ratio did not show a normal distribution, they were used after logarithmic transformation or compared among groups nonparametrically by using the Kruskal–Wallis test followed by the Steel–Dwass test. In logistic regression analysis, adjusted odds ratios for high blood pressure, hyperglycemia, dyslipidemia, or a cluster of the three risk factors were calculated. Age, smoking, alcohol drinking, and regular exercise were used as explanatory variables for multivariate analyses. Probability (p) values less than 0.05 were defined as significant.
Results
Characteristics of the subject groups classified by WC and WHtR and of overall subjects
Table 1 shows profiles of each adiposity group and overall subjects. Subjects in the large WC group and the high WHtR group were 6.1% and 4.5%, respectively, of overall subjects. Percentages of smokers were significantly lower in the large WC group, high WHtR group, and large WC/high WHtR group than in the normal WC/WHtR group. In univariate analysis, BMI, SBP and DBP, HbA1c, and TG were significantly higher and HDL-C was significantly lower in the large WC group, high WHtR group, and large WC/high WHtR group than in the normal WC/WHtR group. Percentages of subjects receiving medication therapy for hypertension, diabetes, or dyslipidemia in the large WC group, high WHtR group, and large WC/high WHtR group were significantly higher than the percentages in the normal WC/WHtR group, except for the percentage of subjects receiving therapy for diabetes in the large WC group. Percentages of subjects showing high BMI, high blood pressure, hyperglycemia, dyslipidemia, or a cluster of high blood pressure, hyperglycemia, and dyslipidemia were significantly higher in the large WC group, high WHtR group, and large WC/high WHtR group than in the normal WC/WHtR group.
Number, percentage, mean with standard deviation, and median with range of each variable are shown.
Asterisks denote significant differences from the group with WC <85 cm and WHtR <0.5 (* p<0.05; ** p<0.01).
WC, waist circumference; WHtR, waist-to-height ratio; SBP, systolic blood pressure; DBP, diastolic blood pressure; HbA1c, glycosylated hemoglobin; HDL-C, high-density lipoprotein cholesterol; TP, therapy; Three risk factors, a cluster of risk factors such as high blood pressure, hyperglycemia, and dyslipidemia.
Comparison of means of SBP and DBP, HbA1c, HDL-C, log-transformed TG, and log-transformed TG/HDL-C ratio among the adiposity groups
Figure 1 shows the results of comparison of means of each variable in multivariate analysis with adjustment for age, histories of smoking, drinking, and regular exercise, and history of medication therapy for hypertension, diabetes, or dyslipidemia. SBP and DBP (Fig. 1A,B), HbA1c (Fig. 1C), log-transformed TG (Fig. 1E), and log-transformed TG/HDL-C ratio (Fig. 1F) were significantly higher in the large WC group, high WHtR group, and large WC/high WHtR group than in the normal WC/WHtR group. These variables were significantly lower in the normal WC/WHtR group, large WC group, and high WHtR group than in the large WC/high WHtR group. There were no significant differences in these variables between the large WC group and the high WHtR group. HDL-C levels (Fig. 1D) were significantly lower in the large WC group, high WHtR group, and large WC/high WHtR group than the level in the normal WC/WHtR group. HDL-C levels were significantly higher in the normal WC/WHtR group, large WC group, and high WHtR group than the level in the large WC/high WHtR group. There was no significant difference in HDL-C between the large WC group and the high WHtR group.
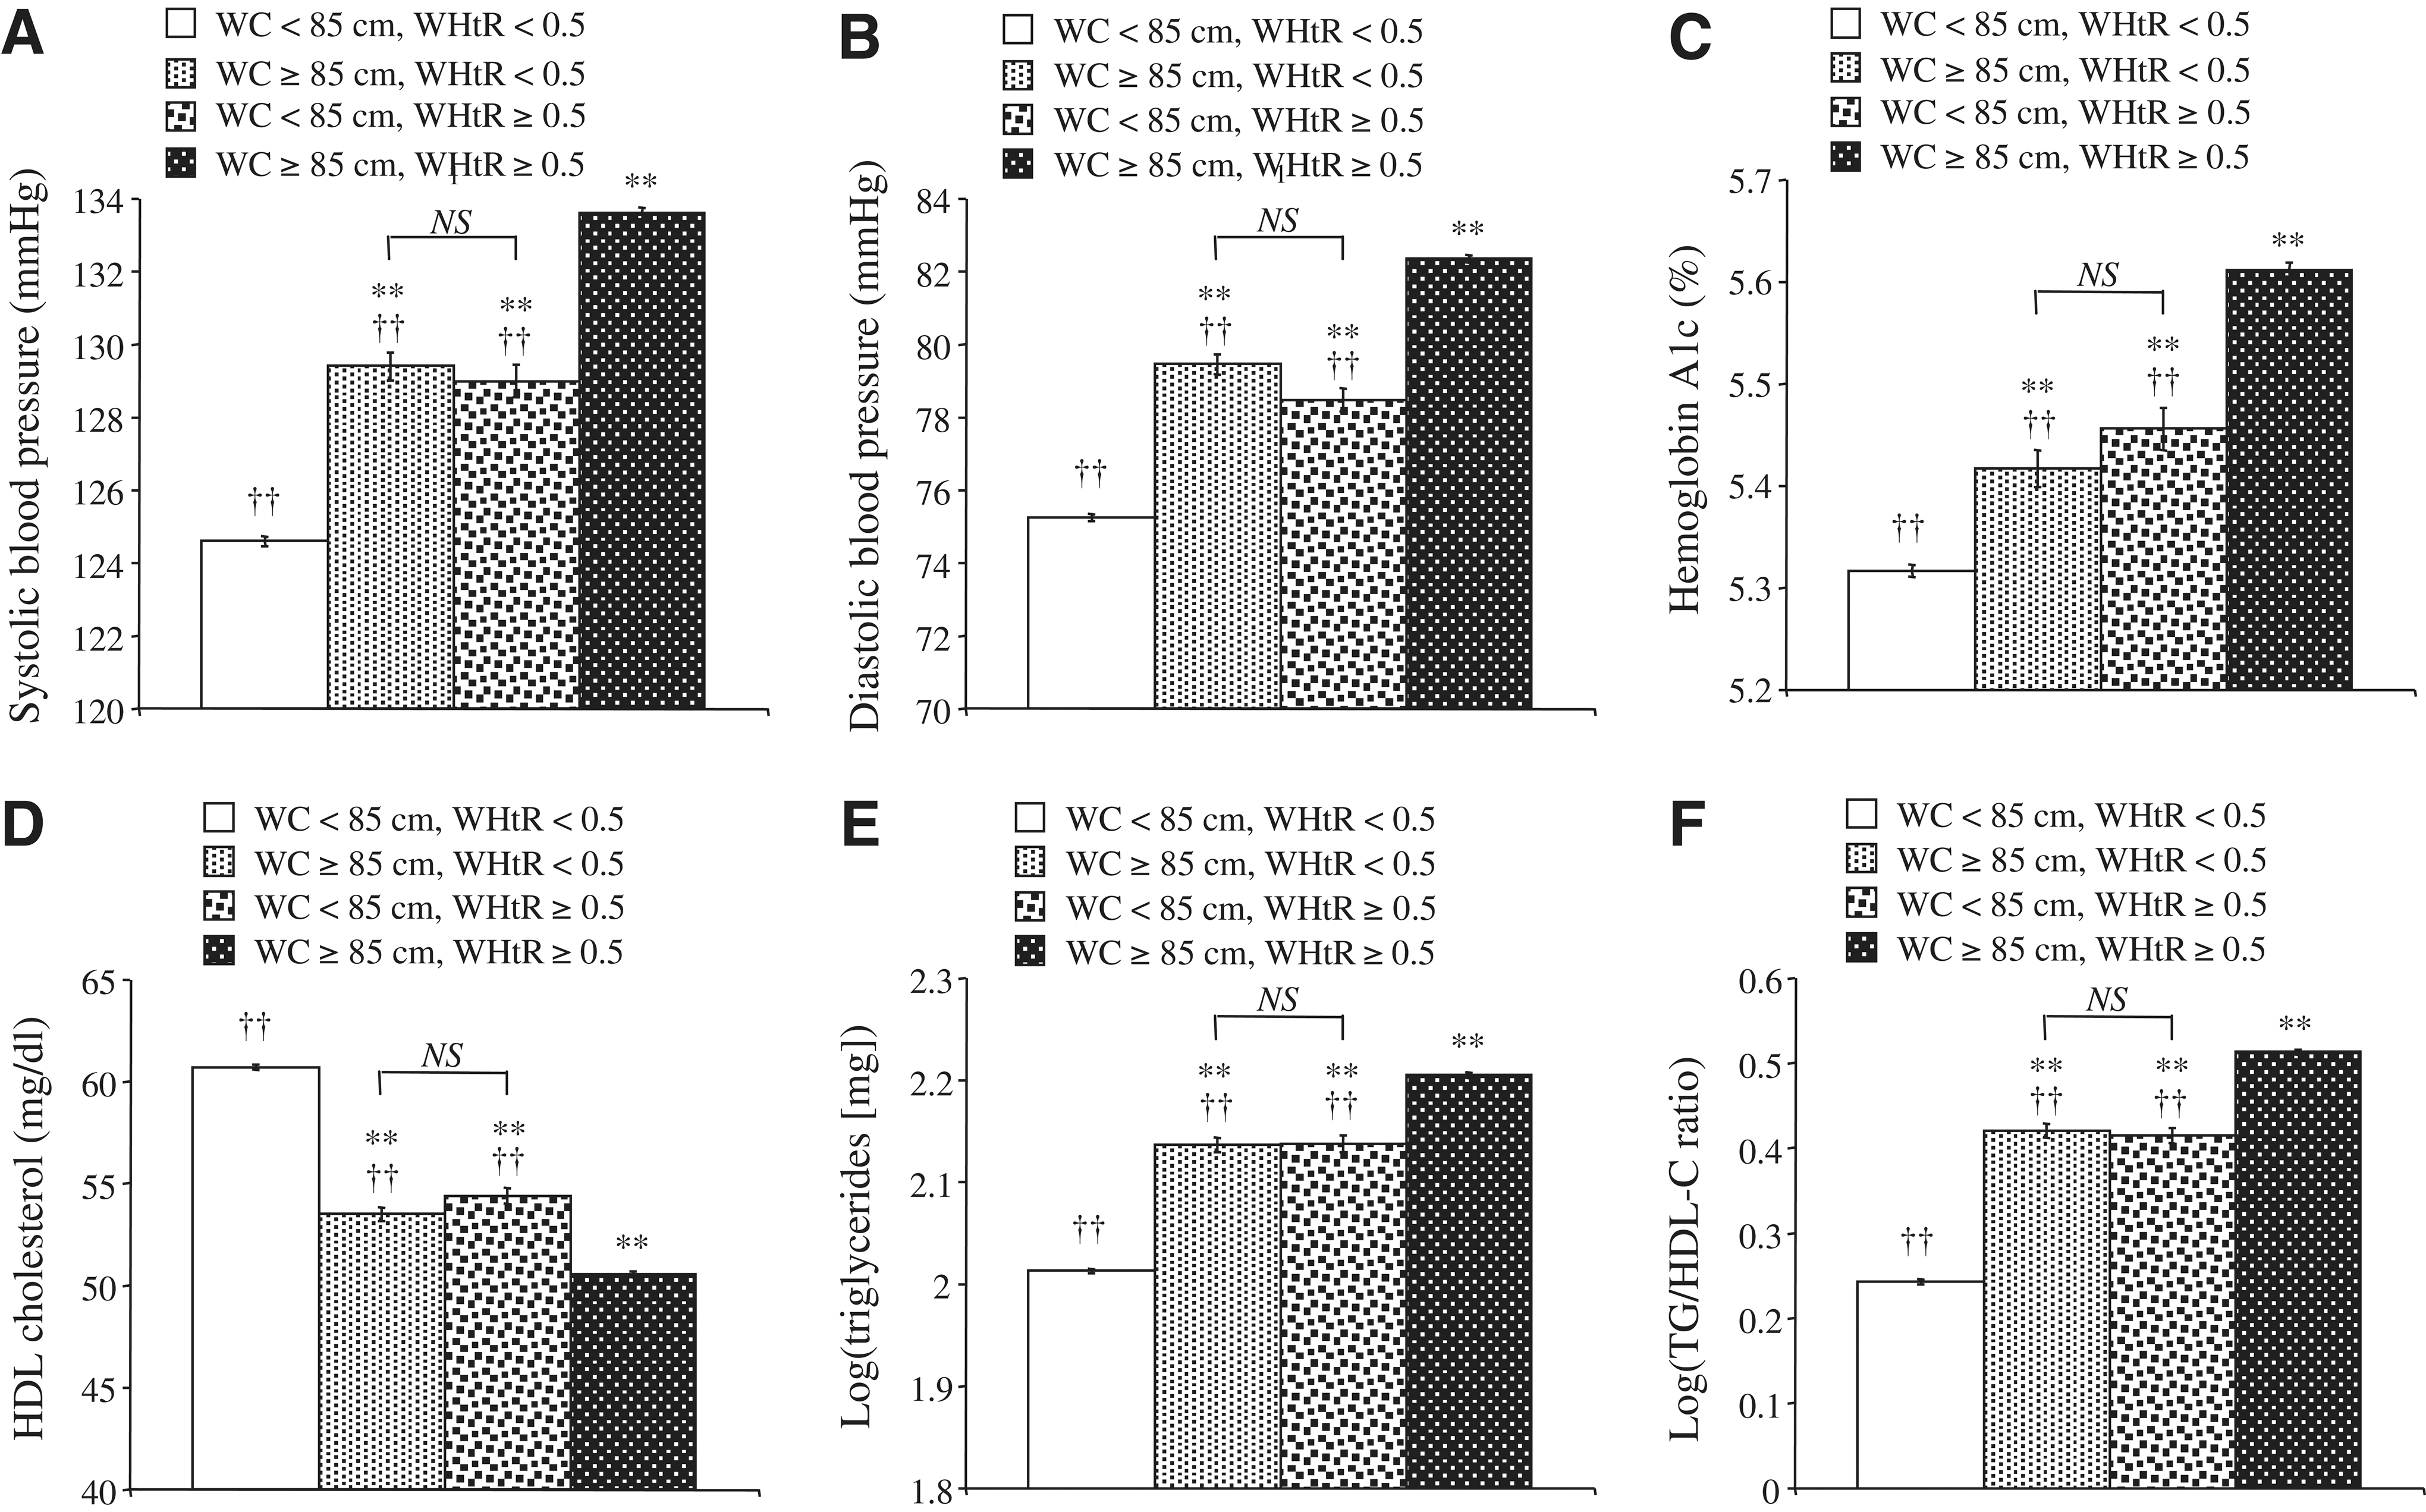
Comparison of systolic (SBP) and diastolic blood pressure (DBP), glycosylated hemoglobin (HbA1c), high-density lipoprotein cholesterol (HDL-C), triglycerides, and triglycerides-to-HDL-C (TG/HDL-C) ratio among the subject groups classified by waist circumference (WC) and waist-to-height ratio (WHtR). Shown are mean levels of systolic blood pressure (SBP)
Odds ratios for high blood pressure, dyslipidemia, hyperglycemia, or a cluster of these three risk factors in each adiposity group versus the normal WC/WHtR group
Table 2 shows adjusted odds ratios for high blood pressure, hyperglycemia, dyslipidemia, or a cluster of these risk factors in each adiposity group versus the control group (normal WC/WHtR group). Age and histories of smoking, drinking, and regular exercise were used as other explanatory variables to calculate adjusted odds ratios. Odds ratios for high blood pressure, hyperglycemia, dyslipidemia, or a cluster of the risk factors in each adiposity group (large WC, high WHtR, or large WC/high WHtR groups) versus the normal WC/WHtR group were significantly higher than the reference level of 1.00. The odds ratios for high blood pressure, hyperglycemia, dyslipidemia, and a cluster of the risk factors tended to be higher in the large WC/high WHtR group than in the large WC group and the high WHtR group and tended to be comparable in the large WC group and the high WHtR group. Results similar to the results described above were also obtained in the analysis using crude odds ratio (data not shown).
Odds ratios (ORs) with their 95% confidence intervals in parentheses are shown. Odds ratios for high blood pressure, hyperglycemia, dyslipidemia, or a cluster of these three risk factors of each adiposity group versus the group showing normal waist circumference and waist-to-height ratio were calculated with adjustment for age, smoking, alcohol drinking, and regular exercise.
Asterisks denote significantly higher odds ratios compared with a reference level of 1.00 (p<0.01).
WC, waist circumference; WHtR, waist-to-height ratio.
When 90 cm, a cutoff value of WC by the IDF criteria, was used, odds ratios for each variable in each adiposity group versus the normal WC/WHtR group were all significantly higher than the reference level of 1.00 and tended to be higher than the odds ratios in the analysis using the cut-off value for large WC of 85 cm in Table 2 (data not shown).
Sensitivity and specificity of relationships between adiposity indices and cluster of cardiometabolic risk
There seemed to be no differences in the sensitivity and specificity of WC and WHtR for predicting the trio of abnormal cardiometabolic risk factors [sensitivity, 79.7% (WC) vs. 79.5% (WHtR); specificity, 59.4% (WC) vs. 61.2% (WHtR)]. Thus, the power to predict cardiometabolic risk seems to be similar in WC and WHtR in this study.
Discussion
Both the large WC group and the high WHtR group showed significantly higher risks for high blood pressure, hyperglycemia, dyslipidemia, and a cluster of these risk factors than did the normal WC/WHtR group, and there were no significant differences in blood pressure, HbA1c, HDL-C, TG, and TG/HDL-C ratio between the large WC group and the high WHtR group. Although the numbers of subjects in the large WC group and the high WHtR group were much smaller than the numbers of subjects in the other groups, there were apparent differences in each variable of risk factors between the large WC group and the normal WC/WHtR group and between the high WHtR group and the normal WC/WHtR group. TG/HDL-C ratio has been shown to be a better predictor for cardiovascular disease than classical atherogenic indices, such as low-density lipoprotein cholesterol (LDL-C)-to-HDL-C ratio, 12,13 to indicate the presence of small dense LDL particles, 14 and to be associated with insulin resistance and metabolic syndrome. 15,16 A great difference (about two-fold) in log-transformed TG/HDL-C ratio was found between the large WC group or the high WHtR group and the normal WC/WHtR group (Fig. 1F). A great difference (about three-fold) was also found in the prevalence of a cluster of the three risk factors, such as hyperglycemia, dyslipidemia, and high blood pressure, between the large WC group or the high WHtR group and the normal WC/WHtR group (Table 2). If central obesity is diagnosed by WC or WHtR alone, about 5% of overall subjects who show large WC but not high WHtR or who show high WHtR but not large WC would be classified into a group without central obesity (Table 1). The above findings indicate that only WC or WHtR is not sufficient for diagnosis of central obesity and that both of them should be used to evaluate cardiometabolic risk more correctly. This is the first study clearly demonstrating an advantage for using both WC and WHtR in the criteria of metabolic syndrome. The subjects of this study were healthy enough to be regularly employed in companies large enough to participate in the screening program. Thus, the findings of this study could be used generally.
WHtR has been shown to be a better predictor than WC or BMI for cardiovascular risk. 7 –9 However, the present study demonstrated that the adjusted mean level of each risk factor variable and adjusted odds ratio for each risk factor were comparable in the large WC group and the high WHtR group. Moreover, sensitivity and specificity were also comparable for relationships of WC and WHtR with clustered cardiometabolic risk. Thus, WC and WHtR may be useful for diagnosis of obesity in persons showing false-negative results of WHtR and WC, respectively, for cardiometabolic risk. BMI and the percentage of subjects with high BMI were significantly higher in the large WC group and the high WHtR group than in the normal WC/WHtR group (Table 1). Thus, higher BMI may contribute to the above higher levels of atherosclerotic risk factors in the large WC group and the high WHtR group than in the normal WC/WHtR group.
This study has some limitations. First, the subjects were middle-aged Japanese men, and thus further studies using subjects with different gender, age, and race/ethnicity are needed to confirm the findings of this study. In fact, our recent studies have shown that associations of obesity with hypertension and hyperglycemia are influenced by age and gender. 17,18 Second, diagnosis of hyperglycemia was done by using high HbA1c levels in blood examination and history of drug therapy for diabetes in a questionnaire. Thus, there is a possibility of information bias for diagnosis of hyperglycemia, although the population having a history of therapy for diabetes and not showing high HbA1c levels was only 0.79% of total subjects. In addition, subjects with type 1 diabetes as well as those with type 2 diabetes were included in subjects with hyperglycemia in this study, although the prevalence of type 2 diabetes is speculated to be more than 100 times higher than the prevalence of type 1 diabetes in the middle-aged Japanese. 19 There is also a possibility of information bias regarding therapy for hypertension and dyslipidemia. Third, in multivariate analysis, age, smoking, alcohol drinking, and habitual exercise were used for adjustment. However, there are other possible confounding factors, e.g., diet, nutrition, and socioeconomic factors, for the relationship between adiposity and atherosclerotic risk factors. In addition, the nature of the work may affect metabolic risk. However, detailed information on occupation, such as the nature of individual work, was not included in the database used in this study. Fourth, in this cross-sectional study, only risk factors for cardiovascular disease in relation to adiposity indices such as WC and WHtR were evaluated. Further studies including prospective studies are needed to investigate prediction of cardiovascular events by adiposity indices. A new anthropomorphic parameter of body adiposity, defined as ([hip circumference]/[height] 1.5 −18), has recently been proposed and shown to be strongly correlated with % body adiposity measured using X-ray absorptiometry. 20 Unfortunately, measurement of hip circumference was not included in the health checkup examinations in this study. Further studies are needed to evaluate the usefulness of different adiposity indices in combination for improvement of accuracy for diagnosing metabolic syndrome.
In summary, when WC or WHtR alone is used for health checkup examination of middle-aged Japanese men, about 5% of examinees are underestimated for diagnosis of metabolic syndrome, and thus it is preferable to diagnose central obesity by using both WC and WHtR.
Footnotes
Acknowledgments
This work was supported by a Grant-in-Aid for Scientific Research from the Japan Society for the Promotion of Science (no. 24390171).
Author Disclosure Statement
No potential conflicts of interest relevant to this article are reported.