
Abstract
Background:
About one-third of the people with abdominal obesity do not exhibit the metabolic syndrome (MetS). Fatty acids in plasma triglycerides (TGs) may help to explain part of this heterogeneity. This study compared TG fatty acid profile of adults with and without abdominal obesity and examined the associations of these fatty acids with MetS components.
Methods:
Fifty-four abdominally obese subjects were matched by age and sex with 54 adults without abdominal obesity. People were classified with MetS according to the harmonizing criteria for MetS. Fatty acids in plasma TGs were analyzed by gas chromatography.
Results:
There were no differences in fatty acids of plasma TGs between people with and without abdominal obesity. However, there were differences between abdominally obese people with and without MetS. The abdominally obese group with MetS had higher palmitic (+2.9%; P = 0.012) and oleic (+4.0%; P = 0.001) acids and lower linoleic (−6.4%; P = 0.018) and arachidonic (−1.2%; P = 0.004) acids. After adjustment for abdominal obesity, age, and sex, a stepwise regression analysis showed that palmitic acid positively contributed to the variance in insulin (β = +1.08 ± 1.01; P = 0.000) and homeostasis model assessment of insulin resistance (HOMA-IR) index (β = +1.09 ± 1.01; P = 0.000) and myristic acid positively contributed to the variance in systolic blood pressure (β = +1.09 ± 1.03; P = 0.006). In contrast, linoleic acid negatively contributed to the variance in glucose (β = −0.321 ± 0.09; P = 0.001) and high-sensitivity C-reactive protein (hsCRP; β = −1.05 ± 1.01; P = 0.000).
Conclusions:
There were no differences in the plasma TG fatty acid profile between people with and without abdominal obesity. Likewise, fatty acids in plasma TGs associated with many of the MetS variables independently of abdominal obesity. These results suggest that the plasma TG fatty acid profile may help to explain part of the heterogeneity between abdominal obesity and the MetS.
Introduction
A
During obesity, the fatty acids transported in plasma TG lipoproteins may contribute to an excessive accumulation of fatty acids in body organs and trigger pathological processes. 8 In adipose tissue, a lipid overload stimulates the overexpansion of the fat cells, resulting in hypoxia, inflammation, and IR development. 1 Accumulation of FFAs also produces low-grade inflammation and IR in skeletal muscle and liver, 4 reducing glucose uptake in muscle, 9 and diminishing the ability of insulin to suppress glucose production and altering lipoprotein metabolism in the liver. 5 All these alterations contribute to MetS development, and the content of fatty acids in plasma TGs might associate differentially with the MetS components.
Some studies have explored associations between plasma TG fatty acids and MetS components. Kotronen et al. found that palmitic, palmitoleic, and oleic fatty acids correlated positively, and linoleic fatty acid negatively, with the homeostasis model assessment of insulin resistance (HOMA-IR) in 16 nondiabetic overweight adults. 7 Similarly, Tremblay et al. found that palmitic fatty acid correlated positively with blood pressure, insulin, and glucose and linoleic fatty acid correlated negatively with blood pressure in 97 apparently healthy Caucasian men. 6 However, studies analyzing plasma TG fatty acids in people diagnosed with MetS are scarce. Since abdominal obesity is a key component of MetS, we aimed to compare the fatty acid content of plasma TGs in adults with and without abdominal obesity and examine the associations of these fatty acids with the MetS components.
Methods
Study design and participants
This is a cross-sectional analytical study. One hundred and eight adult (20–57 years old) volunteers (students and employees) from the University of Antioquia (Medellín, Colombia) were included in the study. Fifty-four abdominally obese subjects (19 men, 35 women) were matched one by one, according to age and sex, with 54 adults without abdominal obesity. Subjects with abdominal obesity were then divided into two groups: with and without MetS. Group sample size was obtained assuming a power of 90% (at 95% level of confidence) that allows to detect a minimum difference between groups of 3.86% in linoleic fatty acid, which has been previously reported. 10 The study was approved by the Bioethics Committee of the Faculty of Medicine from the University of Antioquia (Medellín, Colombia) and performed according to the Helsinki Declaration. Written consent was obtained from all participants.
People were classified with abdominal obesity following the criteria for waist circumference for South American people (≥80 cm in women and ≥90 cm in men) by the Joint Interim Statement, Harmonizing criteria for the metabolic syndrome-2009. 11 Using the same definition, the rest of the MetS components were diagnosed. 11
Diet assessment
A semiquantitative Food Frequency Questionnaire (FFQ) was applied to estimate the daily dietary intake in the last year as described by others. 12,13 The 144 food items included in the FFQ were those usually consumed in the National Survey of the Nutritional Status in Colombia [Encuesta Nacional de la Situación Nutricional en Colombia (ENSIN)] 2005. 14 The portion size (grams or milliliters) of the food items was the medium serving also reported in the ENSIN-2005. 14 The FFQ included a nine-point scale to register the medium serving intake from never or almost never in the last year to more than six times per day. The energy and macronutrient intake per day were calculated from the frequency and amount of the medium serving using the NutriCloud® software. The software provided the total grams of saturated, monounsaturated, and polyunsaturated fat intake without specifying individual fatty acids.
Anthropometric and blood pressure measurements
Body weight was measured to the nearest 0.1 kg using a digital scale (Tanita HD314). Height was measured to the nearest 0.1 cm using a measuring tape (Seca 206). Waist circumference was measured to the nearest 0.1 cm, midway between the lowest rib margin and the iliac crest, using a flexible tape (MABIS). Systolic and diastolic blood pressures were measured using an automated blood pressure monitor (Omron Healthcare) following the recommended procedure of the European Society of Hypertension. 15
Biochemistry
Participants were instructed to fast overnight for 12 hr. Blood was drawn from the antecubital vein in EDTA tubes and was immediately centrifuged at 1500g for 15 min at 4°C. Plasma was aliquoted and kept frozen at −80°C for further analysis. Plasma glucose and lipids were measured by colorimetric and enzymatic methods using an automatic analyzer (Cobas c501; Roche). Insulin was measured by chemiluminescence using the same automatic analyzer (Cobas 6.00; Roche). High-sensitivity C-reactive protein (hsCRP) was measured by immunoturbidimetry using an automatic analyzer (Modular Evo; Roche). HOMA-IR was calculated as plasma glucose (mM) × plasma insulin (mU/l)/22.5. 16
Plasma lipids were extracted by the Folch method. 17 TG fraction was separated from plasma lipids using solid-phase extraction (SPE) by column chromatography (SPE NH2 300 mg; Sigma-Aldrich). TGs were saponified with sodium hydroxide methanol solution (NaoH/MeOH 0.5 M) and fatty acids methylated with boron trifluoride (20% BF3-MeOH). The fatty acid methyl esters (FAMEs) were analyzed using gas chromatography (7890B GC System; Agilent Technologies). The FAMEs were identified by comparison with authentic FAME standards, and peak areas were integrated as relative weight (wt%) by using OpenLab CDS ChemStation software (Agilent Technologies). Fatty acids that were detected in all samples were used in the present study (i.e., 7 fatty acids from 37 that can be measured in our laboratory). Like other studies measuring fatty acids in plasma TGs, 6,18 fatty acids with very low concentrations or even not detectable in most of the subjects (as in the case of omega-3) were not included in the analysis.
Statistical analysis
Normal distribution of data was tested with the Kolmogorov–Smirnov test. Results are presented as mean ± standard error or median and interquartile range according to the normality distribution of the data. Differences between groups were tested with the Mann–Whitney test (non-normally distributed data) or general linear models with Bonferroni post hoc test and adjusted by sex and age (normally distributed data). For Pearson's correlation coefficients and multiple regression analysis, the non-normally distributed data were log transformed. A stepwise multiple regression analysis was performed to quantify the independent contribution of abdominal obesity and TG fatty acids to the MetS features. Regression models were adjusted by sex and age; they met the assumptions of linearity, collinearity, independence, residual normality, and homoscedasticity. P ≤ 0.05 was considered statistically significant.
Results
One hundred and eight adults (54 abdominally obese and 54 without abdominal obesity) were included in the study. There were 19 men and 35 women in each group, with a similar average age (34 vs. 35 years; P = 0.880) (Table 1). There were no differences in energy or macronutrient intake between groups with and without abdominal obesity. As expected, the abdominally obese group had a larger waist circumference (+14.1 cm; P = 0.000), body weight (+14.8 kg; P = 0.000), and body mass index (+4.2 kg/m2; P = 0.000). In addition, this obese group had higher systolic blood pressure (+5.0 mmHg; P = 0.011), diastolic blood pressure (+6.0 mmHg; P = 0.007), fasting insulin (+19.0 pM; P = 0.000), hsCRP (+1.0 mg/L; P = 0.006), and HOMA-IR (+0.7; P = 0.000) (Table 1). Conversely, there were no differences in the proportions of fatty acids in plasma TGs between groups, with and without abdominal obesity (Table 2).
Data are presented as median and interquartile range in parenthesis.
P value from Mann–Whitney test.
Significant difference between groups.
HDL-C, high-density lipoprotein cholesterol; HOMA-IR, homeostasis model assessment of insulin resistance; hsCRP, high-sensitivity C-reactive protein; MetS, metabolic syndrome.
Data are presented as mean ± standard error.
Data are presented as median and interquartile range. Differences between groups were tested with the Mann–Whitney test. Similar results were obtained with log-transformed data analyzed with general linear models with post hoc Bonferroni tests and adjustment by age and sex.
P < 0.05; c P < 0.01 from general linear models with post hoc Bonferroni tests after adjustment by age and sex. Significant differences were found between abdominally obese subjects with and without MetS.
We analyzed next the abdominally obese group divided by the presence of MetS. Thirty-three percent (9 men, 9 women) of the abdominally obese group had MetS and the rest (67%: 10 men, 26 women) did not. Abdominally obese people with MetS compared with abdominally obese people without MetS had higher systolic blood pressure (+14 mmHg; P = 0.001), diastolic blood pressure (+7 mmHg; P = 0.005), fasting glucose (+0.4 mM; P = 0.000), fasting insulin (+20.4 pM; P = 0.002), HOMA-IR (+1.0; P = 0.001), and TGs (+1.2 mM; P = 0.000). Similar differences between groups were obtained with log-transformed data analyzed with general linear models with post hoc Bonferroni tests after adjustment by age and sex (data not shown). Comparing the percentages of fatty acids in plasma TGs, the abdominally obese group with MetS had higher proportions of oleic (+4.0; P = 0.001) and palmitic (+2.9; P = 0.012) fatty acids and lower proportion of linoleic (−6.4; P = 0.018) and arachidonic (−1.2; P = 0.004) fatty acids than the abdominally obese group without MetS (Table 2).
Analyzing the profile of fatty acids in plasma TGs in the whole group, this profile changed as the concentration of TGs increased (Fig. 1). From the seven fatty acids measured, palmitic and oleic acids increased, and linoleic and arachidonic acids decreased, as TG concentrations (in tertiles) increased.
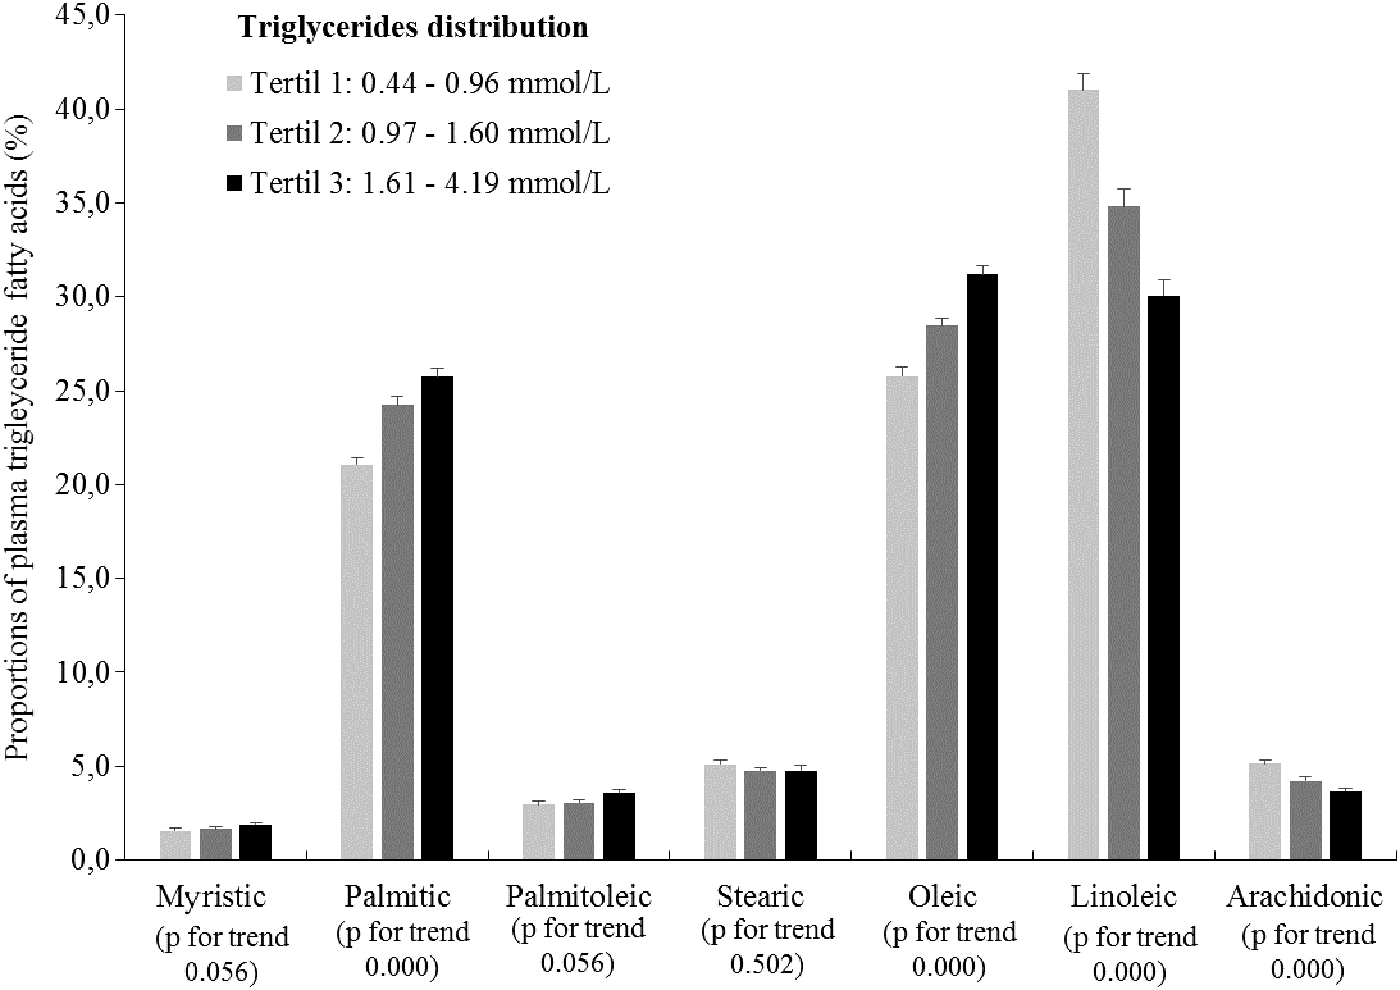
Proportions of fatty acids in plasma TGs according to TG tertile distribution (n = 108). Data are presented as mean ± standard error. P value for trend obtained from general linear models. TGs, triglycerides.
Fatty acids contained in plasma TGs correlated with the MetS components except with waist circumference (Table 3). TGs correlated positively with plasma saturated and monounsaturated fatty acids and negatively with linoleic (r = −0.71; P = 0.01) and arachidonic (r = −0.47; P = 0.01) fatty acids. HOMA-IR and hsCRP correlated positively with palmitic, palmitoleic, and oleic fatty acids and negatively with linoleic fatty acid (Table 3). Other significant correlations were found among blood pressure, fasting glucose, fasting insulin, and high-density lipoprotein cholesterol (HDL-C) with TG fatty acids (Table 3).
Analysis was done in the whole group (n = 108), non-normally distributed variables were log transformed.
P < 0.01; b P < 0.05.
The multiple regression analysis showed the independent contribution of abdominal obesity and TG fatty acids to the MetS variables after adjustments by age and sex in the whole group (Table 4). Abdominal obesity made a positive contribution (P < 0.05) to the variance in plasma glucose, insulin, HOMA-IR, hsCRP, and systolic and diastolic blood pressures. Palmitic fatty acid positively contributed to the variance in insulin (β = +1.08 ± 1.01; P = 0.000) and HOMA-IR (β = +1.09 ± 1.01; P = 0.000). Myristic fatty acid positively contributed to the variance in systolic blood pressure (β = +1.09 ± 1.03; P = 0.006). In contrast, linoleic fatty acid made a negative contribution to the variance in glucose (β = −0.321 ± 0.09; P = 0.001) and hsCRP (β = −1.05 ± 1.01; P = 0.000) (Table 4).
Multiple regression models adjusted by sex and age in the whole group (n = 108). Models were tested with log-transformed data and B-coefficients presented in the values of the independent variables.
SE, standard error.
Discussion
This study compared the fatty acid proportions in plasma TGs in adults with and without abdominal obesity and it examined the associations of these fatty acids with the MetS components. No differences were found in the fatty acid profile of plasma TGs between people with and without abdominal obesity. However, when analyzing the profiles of TG fatty acids between abdominally obese people with and without MetS, they were different. Furthermore, the regression analysis after adjustment by abdominal obesity, age, and sex, showed that fatty acids in plasma TGs significantly contributed to the variance of the MetS components. Consequently, the fatty acids contained in plasma TGs may help to explain part of the heterogeneity in the relationship between abdominal obesity and MetS.
Abdominal obesity is associated with alterations in glucose and lipoprotein metabolism. In this study, the differences observed in the concentrations of plasma glucose, TGs, and HDL-C between the groups with and without abdominal obesity did not reach statistical significance. A possible reason could be that the cutoff used in this study to classify abdominal obesity recommended for South American people (waist circumference: ≥80 cm in women; ≥90 cm in men) is more strict than what is commonly used from the Adult Treatment Panel III (waist circumference: ≥88 cm in women; ≥102 cm in men). 11 It could be that at these cutoff values of waist circumference in these middle-aged adults (34 ± 1.5 years), the abdominal adipose tissue is in the early process of promoting metabolic alterations, as it has been suggested by others. 19,20 This agrees with the values of hsCRP observed in the abdominally obese group [hsCRP: 2.0 mg/L (0.9–3.4)] that classify participants as with moderate risk for cardiovascular disease (low risk <1 mg/L, moderate risk 1–3 mg/L, high risk 3–10 mg/L). 21 Similarly, the HOMA-IR values in this group [HOMA-IR: 2.3 (1.5–3.3)] categorized participants at borderline risk for IR, as observed in other Latino populations. 22,23
Analyzing people with and without abdominal obesity, there were no differences in their profile of fatty acids in plasma TGs. This may be related to the similar concentrations of TGs between these groups. However, when analyzing people with and without abdominal obesity as a group, the proportions of fatty acids changed as the plasma TG concentration increased (Fig. 1). It was found that the proportions of palmitic and oleic fatty acids significantly increase, and linoleic and arachidonic fatty acids significantly decrease, according to TG concentration tertiles. This behavior in the fatty acid proportions in plasma TGs has been associated with diet intake. Aarsland and Wolfe found that high carbohydrate diets accelerate lipogenesis in the liver, increasing TG concentration and concomitantly augmenting the proportions of palmitic and palmitoleic fatty acids and decreasing the proportions of linoleic fatty acid in very low-density lipoprotein (VLDL) particles. 24
Comparing abdominally obese groups with and without MetS, there were significant differences in the fatty acid profile of plasma TGs, as it has been reported in other lipid fractions. 10,25,26 The differences in plasma TG fatty acids found in this study may be associated with notable differences in plasma TG concentrations between groups [2.2 (1.5–2.5) with MetS vs. 1.0 (0.8–1.5) mM without MetS; P = 0.000]. As it was mentioned before, diet can affect plasma TG concentration and its fatty acid profile by providing substrates for de novo synthesis of fatty acids in the liver and by providing preformed fatty acids. 24 However, we did not find energy or macronutrient differences between groups probably due to inaccuracy of the FFQ. 27 Another condition that may be related to the observed differences in the fatty acid profile is that the abdominally obese group with MetS showed a higher IR [HOMA-IR: 2.8 (2.4–4.3) vs. 1.8 (1.4–2.8); P = 0.001]. As it has been suggested (reviewed by Bays et al. 1 and Lee et al. 28 ), the increased IR may have promoted lipolysis in the adipose tissue and increased arrival of fatty acids to the liver, augmenting VLDL-TG secretion, and modifying the fatty acid profile in this group.
Fatty acids in plasma TGs showed significant—positive and negative—correlations with MetS components, suggesting that TG fatty acids may affect differently the MetS variables. In agreement with previous studies, palmitic fatty acid showed positive correlations with MetS features. 6,7 Palmitoleic and oleic fatty acids, which can be synthesized from palmitic acid, followed a similar pattern. High concentrations of palmitic—and saturated fatty acids in general—stimulate diacylglycerol and ceramide synthesis; compounds associated with inflammation and IR in adipose tissue, liver, and skeletal muscle. 5,29 In addition, saturated fatty acids and palmitic acid in particular are able to activate Toll-like receptor 4, promoting inflammation in several organs and IR development. 5,30 Similar to previous studies, linoleic fatty acid showed negative correlations with most of the MetS components. 6,7 Since linoleic fatty acid is essential, a decrease in its proportion in plasma TGs could result from a low dietary intake or from an increased synthesis of saturated or monounsaturated fatty acids in the liver, which would be secreted in higher proportions in VLDL. Thus, these negative correlations between linoleic fatty acid and MetS components could be related to the increased proportions of saturated and monounsaturated fatty acids observed in this study. Accordingly, it would not be precise to assign an apparent protective role to this fatty acid given the proinflammatory effects described for the high intake of linoleic acid and its derivative metabolites in humans (e.g., arachidonic acid). 31,32
After adjusting for abdominal obesity, age, and sex, there were positive contributions of palmitic fatty acid to the variance in insulin and HOMA-IR and myristic fatty acid to systolic blood pressure. In contrast, linoleic fatty acid negatively contributed to the variance in glucose and hsCRP levels. These results suggest that fatty acids contained in plasma TGs may help to explain part of the heterogeneity in the relationship between abdominal obesity and the MetS given that about one-third of the people with abdominal obesity do not exhibit MetS. 33,34 Since fatty acids in TGs can be modified by diet, 24,35 abdominally obese people could have some health benefits by modulating their plasma TG fatty acid profile.
To the best of our knowledge, this study is unique comparing the fatty acid profile in plasma TGs between two groups with and without abdominal obesity paired by age and sex. Another strength of this study is that the contribution of the plasma TG fatty acids to the variance in the MetS components was adjusted by abdominal obesity, age, and sex. However, the study has limitations such as its cross-sectional design that does not permit determining causality. In addition, the sensitivity of the technique used to measure the fatty acids did not allow quantifying fatty acids with important physiological functions like omega-3. This also could be related to low consumption of omega-3-rich foods in our population, as it has been reported. 14,36
In summary, there were no differences in the plasma TG fatty acid profiles between people with and without abdominal obesity. Independent of abdominal obesity, fatty acids in plasma TGs showed significant—positive and negative—correlations with the MetS components, suggesting that TG fatty acids may affect the MetS variables differently. Since the fatty acid profile changed as the TG concentration increased, the measurement of this fatty acid profile might provide more valuable information than the TG measurement itself. Nevertheless, additional studies are necessary to evaluate the effects of diet on the plasma TG fatty acid profile and its relationship with the development of MetS.
Footnotes
Acknowledgments
The authors specially thank the participants, the Comité para el Desarrollo de la Investigación (CODI)-Universidad de Antioquia, Medellín-Colombia, and the Fondo de Sostenibilidad para los Grupos de Investigación de la Universidad de Antioquia, 2014–2015.
Author Disclosure Statement
No competing financial interests exist.