
Abstract
Background:
Prediabetes, defined as impaired fasting glucose (IFG) and impaired glucose tolerance (IGT), likely develops to type 2 diabetes mellitus (DM) and independently increases cardiovascular risk. We employed disposition index (DI), a new metabolic parameter indicating the pancreatic beta cell function adjusted for insulin resistance, and investigated whether it could be altered in Japanese population with prediabetes and associated with early glucose intolerance.
Methods:
A total of 102 adults who underwent an oral glucose tolerance test at the medical screening were designated to normal glucose tolerance (NGT), IFG, IGT, and DM. We calculated insulinogenic index (IGI) and homeostasis model assessment (HOMA) of β cell function (HOMA-β) as insulin secretory function, HOMA-insulin resistance (HOMA-IR), and quantitative insulin sensitivity check index (QUICKI) as insulin resistance and DI, and assessed correlations between these indices and glycemic parameters.
Results:
We observed graded increase of glycemic parameters in the order of NGT, IFG, IGT, and DM. HOMA-IR was significantly higher only in DM compared with NGT, although HOMA-β, IGI, and QUICKI showed no significant differences among the groups. In contrast, DI was significantly lower in IFG, IGT, and DM compared with NGT. In correlation analysis, glycemic parameters related positively to HOMA-IR, but inversely to DI. Only two parameters, IGI and particularly DI, were significantly decreased in the subjects with 1-hr postload glucose >8.6 mmol/L previously proposed as a predictor of type 2 diabetes.
Conclusions:
Our results suggest that reduction of DI promptly reflects the alteration of early glucose intolerance in Japanese population presenting with prediabetes.
Introduction
P
Impaired insulin sensitivity and insulin secretion are key components of pathogenesis in T2DM. Besides, previous reports showed that insulin resistance and impaired insulin secretion coexist in both IFG and IGT as common pathophysiological features. 7 –11 Therefore, it is important to assess accurately the impact of impaired insulin secretion and insulin resistance when we consider therapeutic strategies to individuals with diabetes. Homeostasis model assessment of β cell function (HOMA-β) and insulinogenic index (IGI) during oral glucose tolerance test (OGTT) are more frequently employed as the index of insulin secretion, than daily urinary c-peptide secretion or glucagon challenge test. In contrast, homeostasis model assessment-insulin resistance (HOMA-IR) and quantitative insulin sensitivity check index (QUICKI) are used as the index of insulin resistance.
Bergman and colleague proposed a new indicator, disposition index (DI) that is indicating the pancreatic beta cell function adjusted for insulin resistance in peripheral tissues. 12 This index can be used to estimate the appropriate insulin secretion at different plasma glucose levels. Bacha et al. previously showed that assessment of DI is helpful for understanding the pathophysiological conditions in the apparent obese subjects with prediabetes and diabetes. 13 However, it has not been well elucidated whether the assessment of DI is also beneficial to assess the relatively lean population, including Japanese subjects.
Thus, in this study, we hypothesized that DI is a more useful index for understanding the pathophysiology of prediabetes than the conventional indices in Japanese subjects. To validate this hypothesis, we evaluated IGI, HOMA-β, HOMA-IR, QUICKI, and DI in Japanese subjects who underwent an OGTT for the screening of glucose intolerance, and investigated the correlations between those indices and glycemic parameters such as postload glucose levels during OGTT and glycated hemoglobin (HbA1c).
Materials and Methods
Participants
A total of 102 (56 men and 46 women) Japanese adults who underwent 75-g OGTT for the secondary medical screening in Nayoro City General Hospital from 2011 to 2015 was included in this cross-sectional study. There was no participant who had previous definite diagnosis of diabetes, symptomatic cerebrovascular disorders, severe cardiac disease, hepatitis and liver cirrhosis, renal failure, malignant neoplasm, or medication known to affect glycemic condition. The protocol of the current study was approved by the Ethics Committee of the Nayoro City General Hospital.
Study protocols and calculations
All participants were requested to visit the Nayoro City General Hospital before 9:00 a.m. after 10–12 hr overnight fast, and then were performed a standard 75-g OGTT. During OGTT, blood samples were collected at 0, 30, 60, and 120 min for plasma glucose measurements and at 0 and 30 min for plasma insulin determinations, respectively. Blood samples for HbA1c measurement were collected on the same or other proximate day of OGTT. Height and body weight (BW) were measured, and body mass index (BMI) was calculated by dividing BW (kg) by height squared (m2). We designated participants to the four groups according to American Diabetes Association criteria 14 : normal glucose tolerance (NGT) as fasting plasma glucose (FPG) <5.6 mmol/L and 2-hr postload glucose <7.8 mmol/L; IFG as FPG 5.6–6.9 mmol/L and 2-hr postload glucose <7.8 mmol/L; IGT as 2-hr postload glucose 7.8–11.0 mmol/L, including subjects combined IGT and IFG; diabetes (DM) as FPG ≥7.0 mmol/L or 2-hr postload glucose ≥11.1 mmol/L. Area under the curve (AUC) for glucose during OGTT was calculated using the trapezoidal method.
Plasma glucose levels were measured by automatic analyzer (DM-JACK Ex; Kyowa Medex, Tokyo, Japan) using the hexokinase method, and plasma insulin concentrations as immunoreactive insulin (IRI) were measured using an electrochemiluminescence method (COBAS E601; Roche Diagnostics Japan, Tokyo, Japan). HbA1c levels were enzymatically measured by the automatic analyzer (DM-JACK Ex; Kyowa Medex).
To assess the insulin secretory function, we calculated the following indices: IGI = (Ins 30 -Ins 0 )/(Glu 30 -Glu 0 ), 15 where Ins t and Glu t indicate the values at time (t min) after glucose load during OGTT; HOMA-β (%) = 360 × fasting IRI (μU/mL)/(FPG-63) (mg/dL). 16 Insulin resistance was estimated as follows: HOMA-IR = FPG × fasting IRI/40516; QUICKI = 1/log (fasting IRI × FPG). 17 Furthermore, we calculated DI, index suggesting pancreatic beta cell function adjusted for insulin resistance or sensitivity, as the ratio of HOMA-β to HOMA-IR. 18
We compared these indices among NGT, IFG, IGT, and DM groups, and examined correlations between these indices and glycemic parameters as follows: postload glucose during OGTT, AUC for glucose, and HbA1c. We also compared HbA1c levels among the quartiles of IGI, HOMA-β, HOMA-IR, QUICKI, and DI, respectively, to assess whether each index gradually reflects to the glycemic profile. In addition, we divided NGT, IFG, and IGT participants into two groups in a cutoff point of 1-hr postload glucose level 8.6 mmol/L (155 mg/dL) during OGTT, which has been proposed as a predictor of the future risk for T2DM 19 and evaluated the difference in each index between the two groups.
Statistical analysis
Data are expressed as mean ± SEM. Statistical analysis was performed using one-way ANOVA followed by Bonferroni or Dunnett's multiple comparison post-test in examination of the above three groups, and unpaired t-test between two groups. Data were analyzed using a commercial software (Prism 5; GraphPad, San Diego, CA). A P-value <0.05 was considered statistically significant.
Results
Clinical characteristics and glycemic parameters
Table 1 shows the clinical characteristics and glycemic status, including glycated hemoglobin, postload glucose levels, and AUC for glucose during OGTT. The mean age was significantly higher in IGT (62 ± 2 years, P < 0.001) and DM (59 ± 3 years, P < 0.01) groups compared with NGT (43 ± 5 years). There was no significant difference in BMI among the groups, and subjects showed no apparent obesity (Table 1). We observed the gradual increase of glycemic parameters in the order of NGT, IFG, IGT, and DM, and observed significant difference especially between IGT and NGT groups (Table 1). Fasting IRI levels were significantly higher in DM (68.5 ± 9.0 pmol/L, P < 0.05) group compared with NGT, whereas there were no significant differences in postglucose load IRI levels at 30 min among the groups.
Data are presented as mean ± SEM. AUC, area under the curve; BMI, body mass index; DM, diabetes mellitus; IFG, impaired fasting glucose; IGT, impaired glucose tolerance; IRI, immunoreactive insulin; NGT, normal glucose tolerance; SEM, standard error of the mean. * P < 0.05 vs. NGT, ** P < 0.01 vs. NGT, *** P < 0.001 vs. NGT. # P < 0.05 vs. IFG, ## P < 0.01 vs. IFG, ### P < 0.001 vs. IFG. † P < 0.05 vs. IGT, †† P < 0.01 vs. IGT, ††† P < 0.001 vs. IGT.
DI reflects early glucose intolerance
First, we investigated conventional indices, such as IGI, HOMA-β, HOMA-IR, and QUICKI among the subjects. We observed no significant differences in IGI and HOMA-β as insulin secretory indices among all groups (Fig. 1a, b). As the index of insulin resistance, HOMA-IR was significantly higher in DM (3.0 ± 0.4, P < 0.01) group compared with NGT (1.2 ± 0.1) group (Fig. 1c), whereas QUICKI was not significantly different among all groups (Fig. 1d). In contrast, DI showed a significant decrease even in IFG (31.1 ± 1.5, P < 0.001) and IGT (32.7 ± 2.4, P < 0.001), as well as DM (25.8 ± 2.5, P < 0.001) group compared with NGT (50.4 ± 2.4) group (Fig. 1e). These results demonstrate that DI may reflect the alteration of early glucose intolerance in population presenting mild dysglycemia.
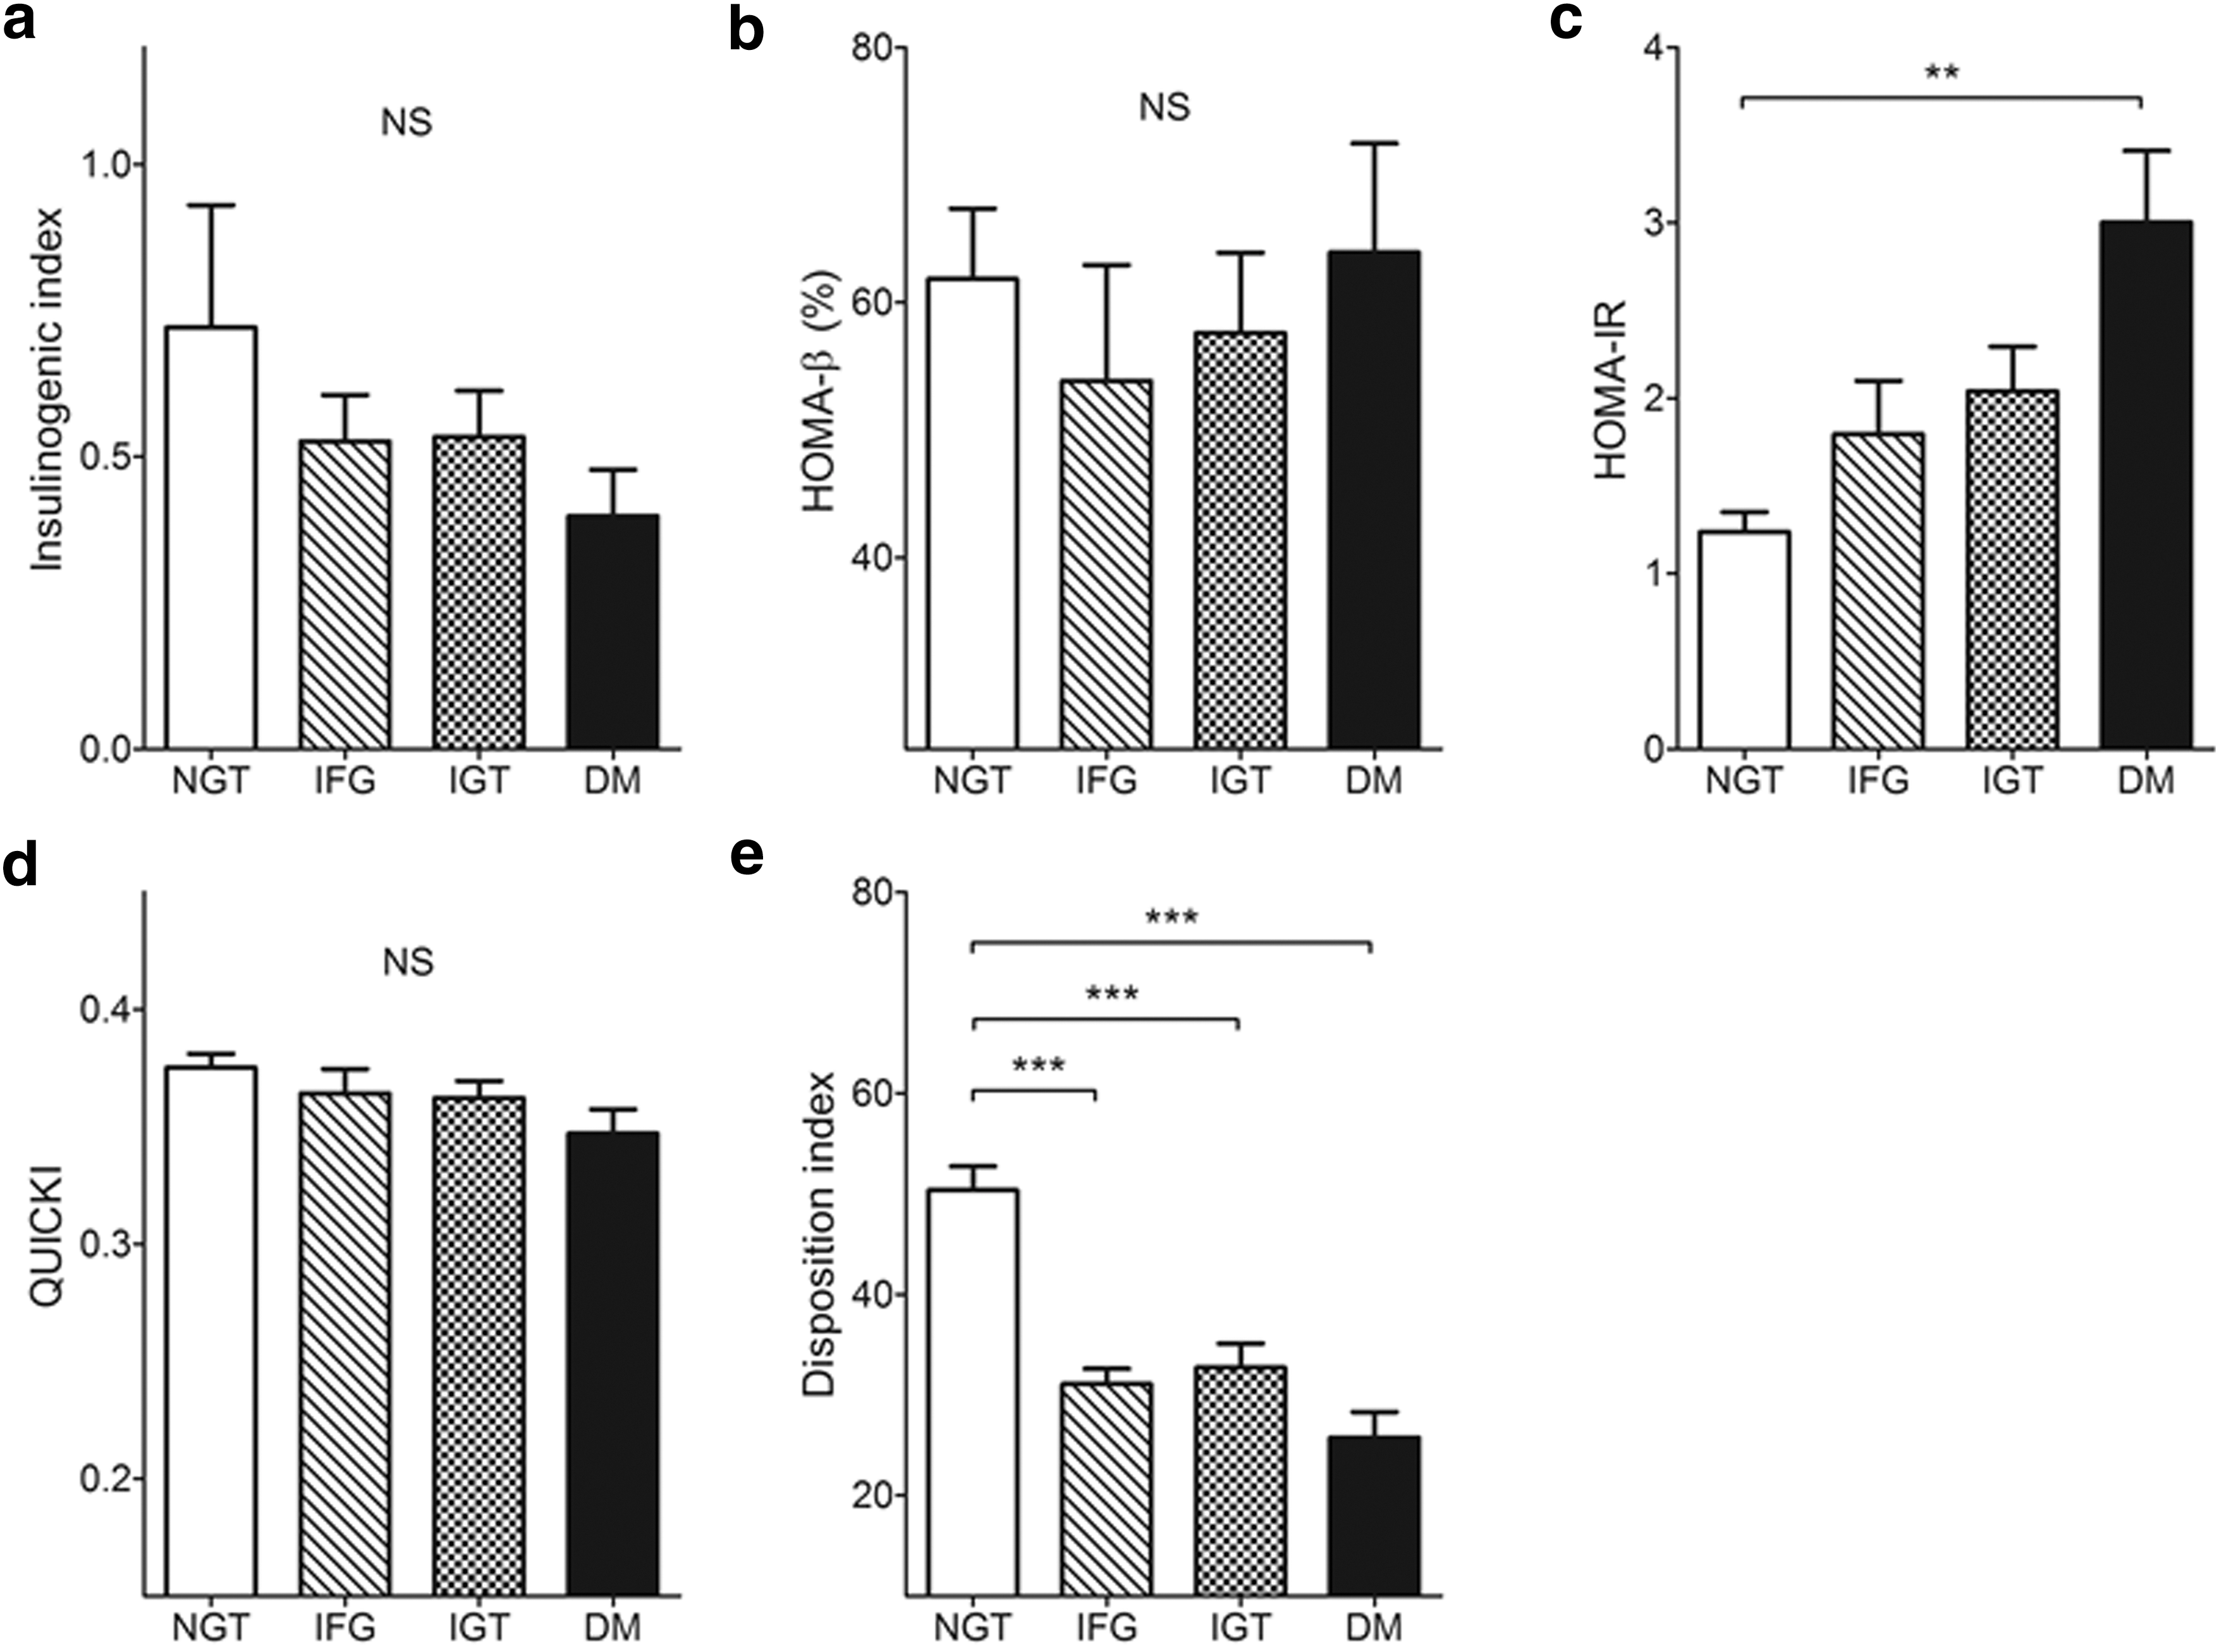
Comparison of indices among NGT, IFG, IGT, and DM.
DI is correlated with glycemic parameters
Then, we examined the correlations between these indices, IGI, HOMA-β, HOMA-IR, QUICKI, and DI and glycemic parameters as follows: postload glucose levels during OGTT, AUC for glucose, and glycated hemoglobin (Table 2). HOMA-IR had significant positive correlation with all glycemic parameters. Moreover, DI showed significant inverse correlation with all glycemic parameters and had a stronger relationship to each glycemic parameters than HOMA-IR (Table 2).
The correlation analysis using Pearson's correlation coefficients between indices and glycemic parameters as follows: postload glucose during OGTT, AUC for glucose, and glycated hemoglobin. DI, disposition index; IGI, insulinogenic index; HOMA-β, homeostasis model assessment of β cell function; HOMA-IR, homeostasis model assessment-insulin resistance; OGTT, oral glucose tolerance test; QUICKI, quantitative insulin sensitivity check index. ** P < 0.01, *** P < 0.001, **** P < 0.0001 between glucose at 30 min and indices. ## P < 0.01, ### P < 0.001, #### P < 0.0001 between glucose at 60 min and indices. †† P < 0.01, †††† P < 0.0001 between glucose at 120 min and indices. ‡‡ P < 0.01, ‡‡‡‡ P < 0.0001 between AUC for glucose and indices. ¶¶¶¶ P < 0.0001 between glycated hemoglobin and indices.
Quartiles of DI exhibit graded glycemic profiles
To confirm a relationship to glycemic parameters, we compared glycated hemoglobin levels among quartiles of the indices. We observed no significant difference in HbA1c levels among quartiles of IGI and HOMA-β (Fig. 2a, b). In contrast, HbA1c levels were given to increasing from the first to the fourth quartile in HOMA-IR (Fig. 2c), and decreasing from the first to the fourth quartile in QUIKI and DI (Fig. 2d, e). We noted the distinctly graded decrease of HbA1c levels especially in proportion to DI quartiles with statistical significance (Fig. 2e).
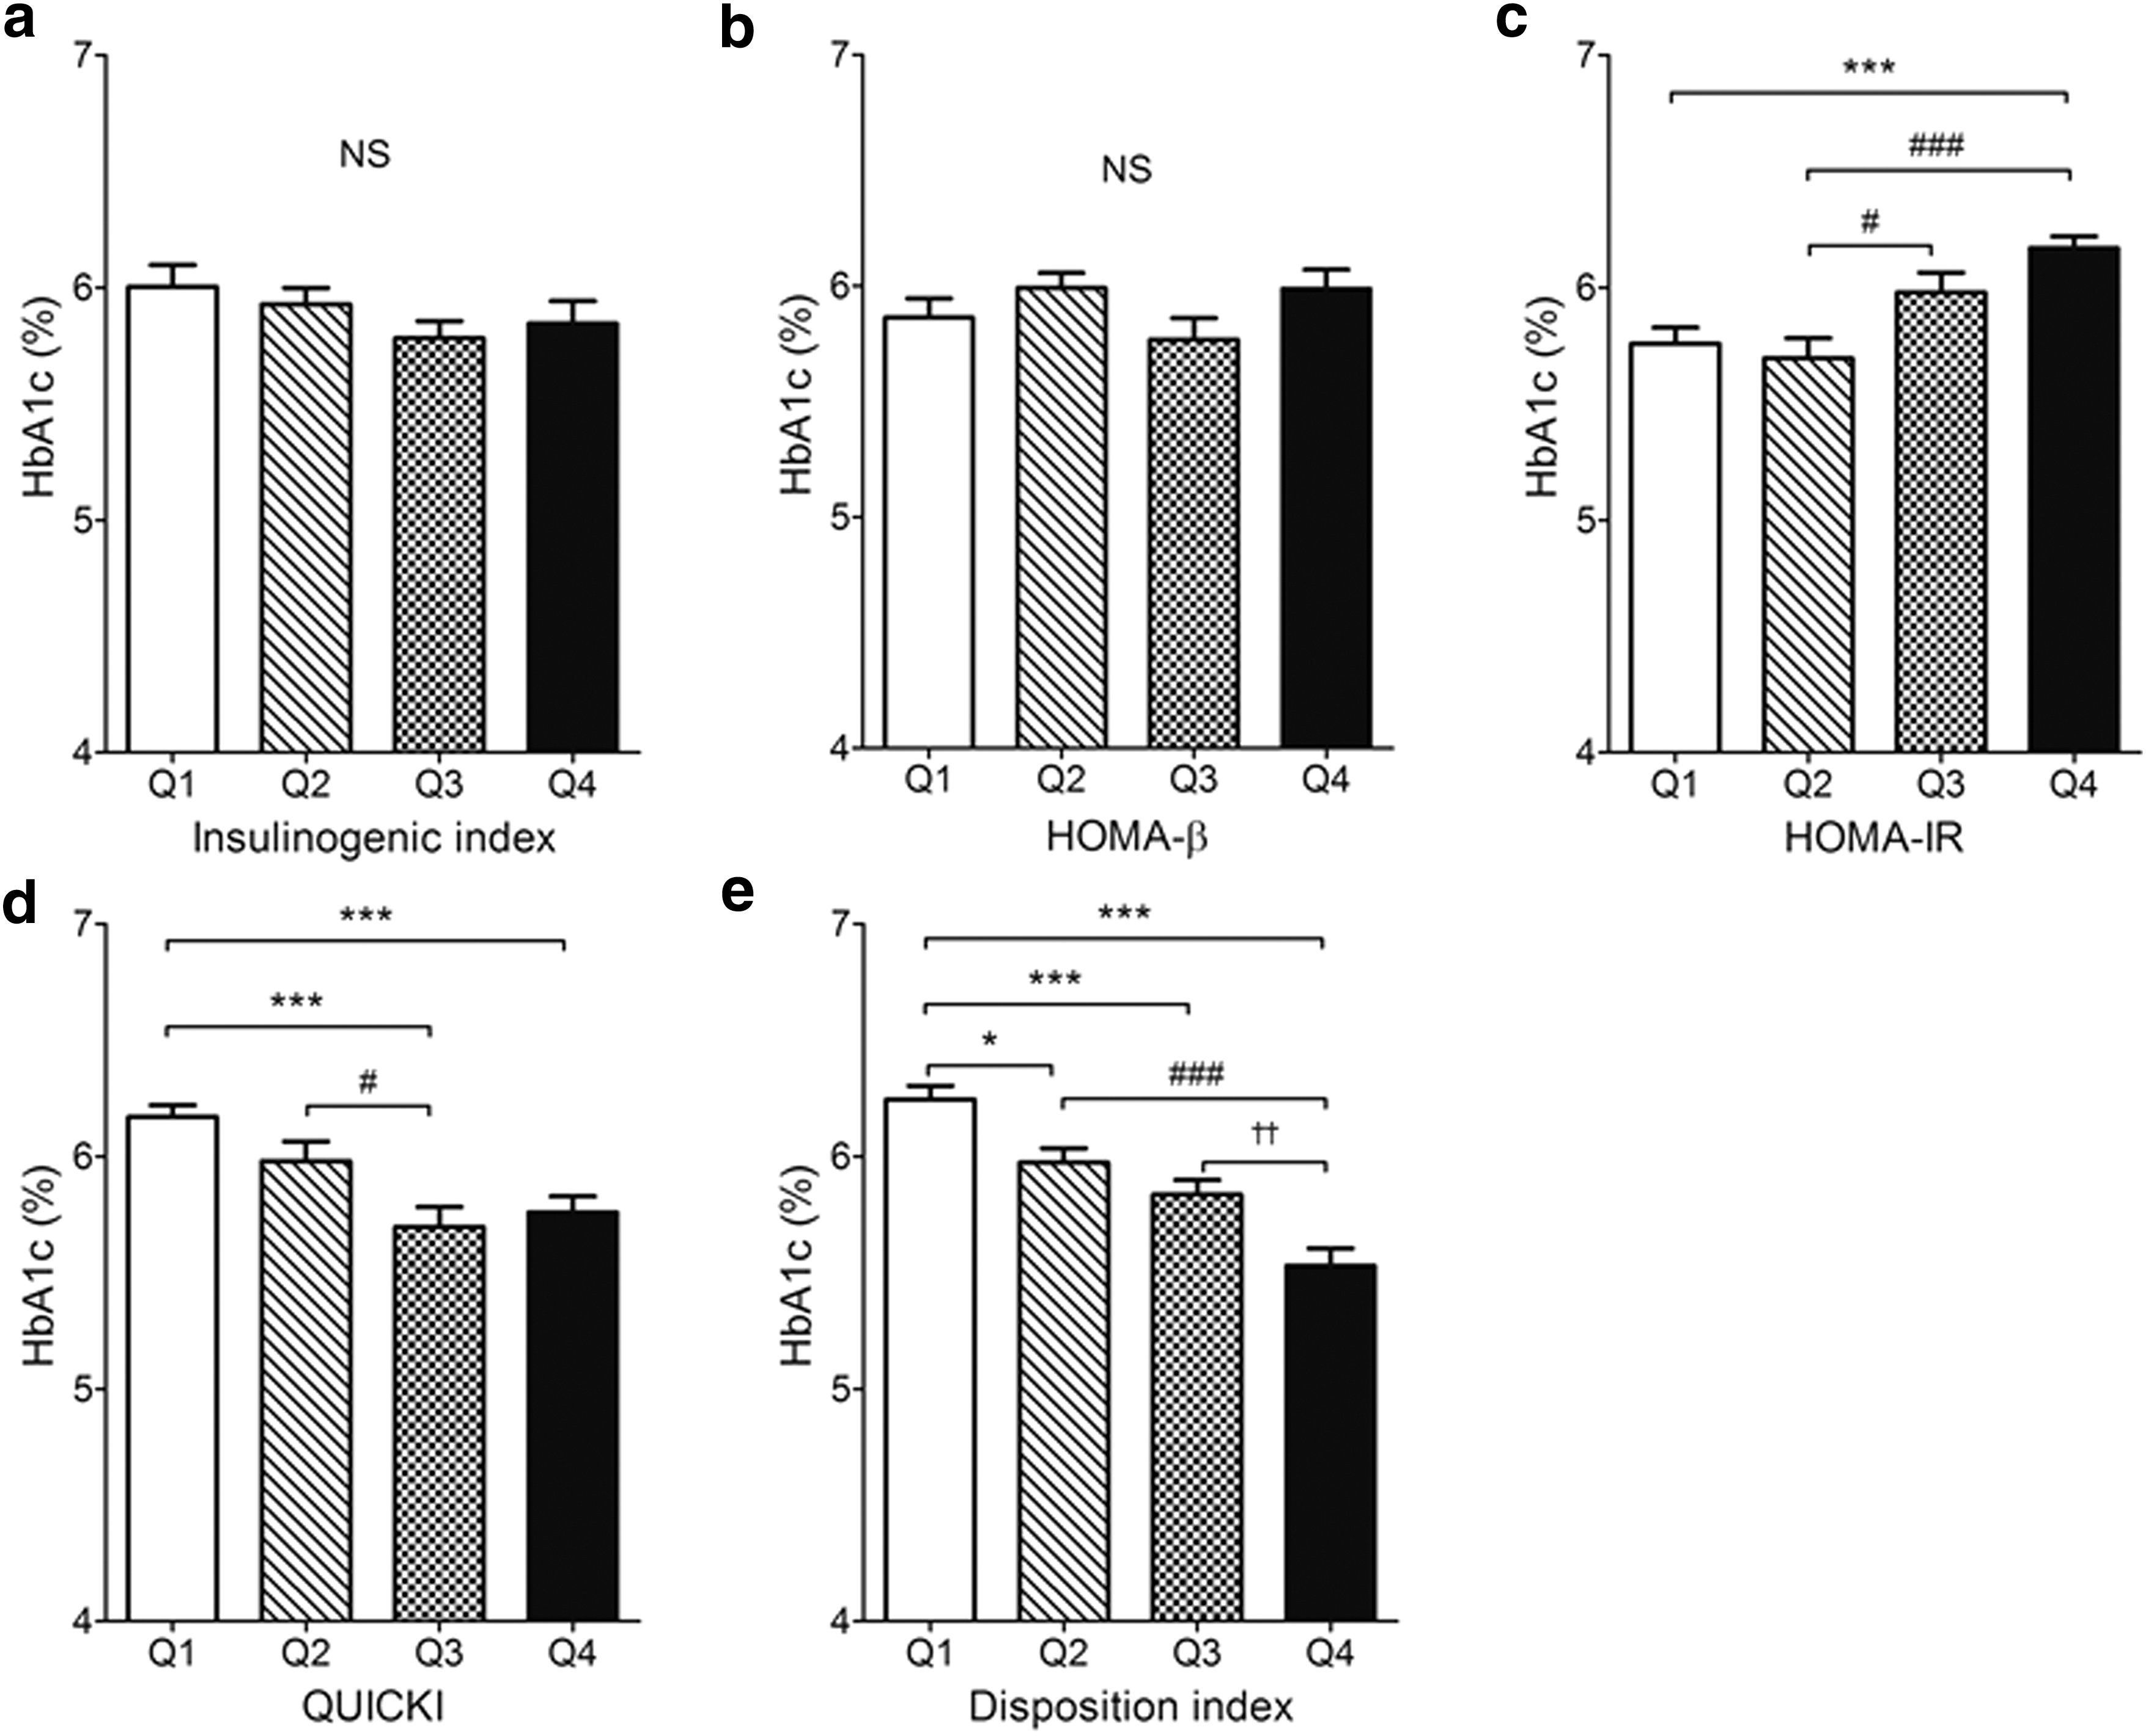
Glycated hemoglobin levels among quartiles of indices.
DI is associated with the predictor of the future risk for T2DM
Furthermore, we divided NGT, IFG, and IGT subjects into the two groups according to a cutoff point of 1-hr postload glucose level 8.6 mmol/L during OGTT, which has been previously proposed as a predictor of the future risk for T2DM 19 and evaluated the difference in each index between the two groups. DI as well as IGI was significantly decreased in a cohort presenting postload glucose greater than 8.6 mmol/L, compared with another cohort showing postload glucose less than 8.6 mmol/L (Fig. 3a, e). On the other hand, there were no significant differences between the two groups in the indices of HOMA-β, HOMA-IR, and QUICKI (Fig. 3b–d). These results suggest that decline of DI may be helpful in predicting the deterioration of glucose intolerance in prediabetic populations.

Alteration of indices in a cutoff point of 1-hr postload glucose levels >8.6 mmol/L during OGTT known as a predictor of future risk for type 2 diabetes.
Discussion
Prediabetes, characterized by IFG and IGT, is not only a risk of developing to overt diabetes, but also an independent risk of atherosclerotic diseases. 1 –6 Therefore, it is important to diagnose it and intervene in the early period of prediabetes to prevent ischemic heart disease and cerebrovascular disease, as well as diabetes and its complications.
In the present study, we explored whether DI is the more effective and promising parameter than the other indices to predict the pathophysiological condition in prediabetes. First, we showed in our cohort that DI was decreased in subjects not only with diabetes, but also with prediabetes and we also presented that DI had significant inverse correlations with glycemic parameters such as glycated hemoglobin, postload glucose, and AUC during OGTT. It is noted that the graded DI change has strong relationship to the chronic glycemic profile represented by glycated hemoglobin. Thus, our results suggest that DI is a sensitive parameter, indicating the development of early glucose intolerance at the screening.
In addition, we demonstrated that DI as well as IGI was significantly decreased in the subjects who showed 1-hr postload plasma glucose levels greater than 8.6 mmol/L during OGTT, which is proposed as a predictor of the future risk for T2DM. 19 Several reports showed that IGI is another specific predictor of the future risk for T2DM. 20 –23 IGI is an indicator of early phase insulin secretion and is calculated from glycemia/insulin ratio during OGTT. Consequently, it is reasonable that IGI was decreased in the cohort of 1-hr postload glucose levels >8.6 mmol/L during OGTT. In addition to IGI, DI was decreased in the cohort of 1-hr postload glucose levels >8.6 mmol/L in the current study. Similarly to our results, DI was decreased in the cohort of 1-hr postload glucose levels >8.6 mmol/L among obese Hispanic youth. 24 Therefore, it is suggested that DI may be helpful in predicting the deterioration of glucose intolerance in prediabetic populations. The formula of DI is designed and reflected to both impaired insulin secretion and insulin resistance, which likely coexist in people with prediabetes as previously reported. 8 –12 Thus, it was demonstrated that DI could be effective in the foregoing results.
In contrast, there was no significant difference in HOMA-IR between prediabetes and NGT in the current study. Although HOMA-IR showed significant positive correlation with all glycemic parameters, the correlation coefficient was weaker than the correlation of DI with glycemic parameters (Table 2). Thus, we could not conclude that HOMA-IR declines before DI at the early stage of glucose intolerance. Then, we can speculate several possibilities, which might contribute to our results. First, in the subjects of our study, insulin resistance might not largely contribute to pathogenesis of prediabetes, since the subjects did not present overt obesity and were probably without severe insulin resistance. Our study may be different from the previous study in which prediabetes clearly showed both increase of HOMA-IR and decrease of DI more than NGT with significance, 25 since the subjects were apparently obese than ones in our study. Second, impaired insulin secretion can dominantly contribute to the pathophysiology of glucose intolerance in relatively lean Japanese subjects as compared with Caucasian who are more generally characterized by obesity and insulin resistance as previously reported. 26,27 Furthermore, Matsumoto et al. showed that the progression from NGT to prediabetes is associated with impaired insulin secretion in both obese and nonobese Japanese subjects. 28 We suppose these pathophysiological aspects may reflect to our results, indicating DI is more useful than HOMA-IR to estimate metabolic changes in Japanese subjects.
In our current study, HOMA-β in DM was comparable to that in NGT, although UK Prospective Diabetes Study (UKPDS) suggested that HOMA-β is decreased by 50% in patients with T2DM at the time of diagnosis. 29 We assume that the different subject characteristics could cause this discrepancy. Diabetic subjects in UKPDS showed higher FPG levels (median FPG 11.5 mmol/L), HbA1c levels (median HbA1c 9.1%), and BMI (mean BMI 28.9 kg/m2) compared with the DM cohort in the present study (median FPG 6.7 mmol/L, median HbA1c 6.1%, and mean BMI 25.5 kg/m2). Furthermore, Festa et al. suggested that HOMA-β was not decreased among subjects with IGT and DM diagnosed just by 2-hr postload glucose levels, although HOMA-β was indeed compromised in the subjects with DM diagnosed by fasting glucose levels or DM diagnosed by both fasting and 2-hr postload glucose levels. 30 DM cohort in this study consisted of the subjects diagnosed dominantly just by 2-hr postload glucose levels (fasting glucose levels, 12.9%; both fasting and 2-hr postload glucose levels, 29.0%; and 2-hr postload glucose levels, 58.1%), hence these characteristics of participants might contribute to the discordance of HOMA-β between UKPDS and the present study.
DI is calculated by the product or the quotient of the indices of insulin secretion and insulin resistance. Staimez et al. reported that the deterioration of pancreatic beta cell function surrogated by DI is more largely reflected to the progression of glucose intolerance, compared with the insulin resistance index, among the population of Asian Indians with relatively low BMI. 31 In our current study, we similarly observed that the decreased DI, but not the increased HOMA-IR reflected the early glucose intolerance; therefore, we suggested the possibility that the deterioration of beta cell function may contribute more to the progression of glucose intolerance in Japanese with relatively low BMI. Butler and colleague unveiled that the beta cell dysfunction progresses as a consequence of the reduced beta cell mass due to beta cell death in patients with diabetes. 32 Sakuraba et al. showed that pancreatic beta cell mass and volume density are decreased in the lean Japanese subjects with type 2 diabetes. 33 Furthermore, Saisho et al. reported that pancreatic beta cell mass is less in the lean subjects compared with the obese subjects in the population without diabetes. 34 These findings provide the impact of relationship between pancreatic beta cell mass and beta cell dysfunction on the progression of glucose intolerance in Japanese subjects presenting relatively low BMI. Therefore, we proposed that DI can be the efficient and convincing index for subjects with prediabetes, especially in Asian population without apparent obesity, when we make strategy for therapeutic interventions to preserve beta cell function. In addition, DI would be more convenient and practical as a routine diagnostic or screening test among clinicians, since DI (HOMA-β to HOMA-IR ratio in this study) is able to be calculated using plasma glucose and plasma insulin concentration just in the fasting state compared with IGI that requires an OGTT.
There are several limitations in this study. First, the current study was conducted with retrospective cross-sectional design. Second, our results were based on the relatively small population without common selection criteria at a single hospital. Third, we did not perform OGTT in general population, but in subjects with mild glucose intolerance for secondary screening. We could still unveil that DI related well with glycemic parameters and associated with the predictor of T2DM in Japanese population. In the next step, prospective multicenter cohort study and an additional follow-up study with a sufficient number of participants are necessary to clarify the further association between the progression of glucose intolerance and the decline of DI.
In conclusion, our present study indicates that the decline of DI can reflect early glucose intolerance in the population with subtle and mild dysglycemia. Sequential or follow-up assessment of DI may be useful and beneficial for the early diagnosis of prediabetes and the incidence prediction of overt diabetes mellitus.
Footnotes
Author Contributions
Y.T., Y.F., T.Y., J.H., A.A., M.A., and M.H. contributed to the study concept and design; Y.T., M.A. acquired the data; Y.T., Y.F., T.Y., J.H., A.A., M.A., and M.H. analyzed and interpreted the data and performed statistical analysis; Y.T., Y.F. drafted the article; Y.T., Y.F., T.Y., J.H., A.A., M.A., and M.H. reviewed the article for important intellectual content; MH supervised the study.
Author Disclosure Statement
M.H. received scholarships from Astellas Pharma, Sanofi, Ono Pharmaceutical, Kissei Pharmaceutical, Kyowa Hakko Kirin Co. Ltd., Kowa Pharmaceuticals, Shionogi Inc., Johnson & Johnson, Daiichi Sankyo, Mitsubishi Tanabe Pharma, Takeda Pharmaceuticals, Taisho Toyama Pharmaceutical Co., Elli Lilly Japan, MSD, and Beyer. The other authors declare no conflicts of interest.