
Abstract
Background:
Abdominal obesity is a well-established risk factor for the development of type 2 diabetes. However, sex differences may exist. We aimed to investigate the associations of abdominal subcutaneous adipose tissue (SAT) and visceral adipose tissue (VAT) with insulin resistance and insulin secretion in men and women.
Methods:
In this cross-sectional analysis of the Netherlands Epidemiology of Obesity study, fasting and postprandial concentrations of glucose and insulin were measured and abdominal fat depots were assessed using magnetic resonance imaging in 2253 participants (53% women). With linear regression analysis, we examined associations of abdominal SAT and VAT with measures of insulin resistance and insulin secretion in men and women, while adjusting for age, ethnicity, education, smoking habits, alcohol consumption, menopausal state and hormone use in women, and models with VAT additionally for total body fat.
Results:
Participants had a mean [standard deviation (SD)] age of 56 (6) years, body mass index: 25.9 (3.9) kg/m2, VAT: 89 (55) cm2, and SAT: 235 (95) cm2. In the multivariate models in men, per SD of VAT the homeostatic model assessment of insulin resistance (HOMA-IR) was 20% (95% CI: 14–26) higher, and per SD SAT 21% (15–27) higher. In women, per SD of VAT the HOMA-IR was 40% (29–52) higher, and per SD SAT 12% (6–19) higher. Associations with measures of insulin secretion were weaker than with insulin resistance.
Conclusions:
In men, abdominal SAT and VAT were associated with insulin resistance to a similar extent, whereas in women particularly VAT was associated with insulin resistance and insulin secretion. Future studies need to unravel the mechanisms underlying the metabolic effects of visceral fat in women. Simple and less expensive measures that can distinct abdominal subcutaneous and visceral fat are needed for an improved metabolic risk stratification.
Introduction
O
Several studies have shown that waist circumference and waist-to-hip ratio are more important risk factors for type 2 diabetes than measures of overall adiposity. 5 –7 Waist circumference, although a marker of central body fat, cannot distinguish visceral fat from abdominal subcutaneous adipose tissue (SAT). Studies with direct assessment of adipose tissue depots by magnetic resonance imaging (MRI) or computed tomography have consistently reported that visceral adipose tissue (VAT) was associated with insulin resistance 8 –13 and type 2 diabetes. 14 –16 Most studies that investigated associations of VAT and SAT with insulin secretion were small. 8,17 The Insulin Resistance Atherosclerosis Study (IRAS) used an intravenous glucose tolerance test in 1500 Hispanics and African Americans and showed that SAT and not VAT was associated with acute insulin response. 13
Although clear differences in body fat distribution between men and women exist, 18 it is unclear whether associations between SAT, VAT, and measures of glucose metabolism differ between men and women. Associations between waist circumference and type 2 diabetes tend to differ between men and women, 6,7 but it is unclear whether these differences can be contributed to abdominal SAT or VAT. Most of the studies with direct assessment of SAT and VAT were too small to detect interaction with sex, 8,9 or did not investigate sex interactions. 10,11 Two large studies that did, surprisingly observed no interaction of sex with SAT or VAT in relation to insulin resistance. 12,13 Hence, it remains unclear whether differences between men and women in risk of insulin resistance and type 2 diabetes can be attributed to the absolute amount of VAT, or whether the associations between VAT and insulin resistance actually differ between men and women. Our objectives were therefore to investigate the associations of directly assessed abdominal SAT and VAT by MRI with measures of insulin resistance and insulin secretion, and to investigate to what extent these associations differ between men and women.
Methods
Study design and study population
The present study is a cross-sectional analysis of baseline measurements of the Netherlands Epidemiology of Obesity (NEO) study, a population-based prospective cohort study in 6671 men and women between 45 and 65 years of age. Detailed information about the study design and data collection has been described elsewhere. 19 Men and women between 45 and 65 years of age with a self-reported body mass index (BMI) of 27 kg/m2 or higher living in the greater area of Leiden, the Netherlands, were eligible to participate in the NEO study. In addition, all inhabitants between 45 and 65 years of age from one adjacent municipality (Leiderdorp) were invited irrespective of their BMI, allowing for a reference distribution of BMI. Participants visited the NEO study center of the Leiden University Medical Center (LUMC) after an overnight fast. Before this study visit, participants completed a questionnaire at home with demographic, lifestyle, and clinical information. At the study center, the participants completed a screening form, asking about anything that might create a health risk or interfere with MRI (most notably metallic devices, claustrophobia, or a body circumference of more than 1.70 m). Of the participants who were eligible for MRI, ∼35% were randomly selected to undergo direct assessment of abdominal SAT and VAT. All participants underwent an extensive physical examination, including anthropometry and blood sampling. For the present analysis, we included participants with a successful measurement of visceral fat, and excluded participants who used oral hypoglycemic agents or insulin in the month before the study visit, who were not in a fasting state, in addition to participants with missing data. The study was approved by the medical ethics committee of the LUMC and all participants gave written informed consent.
Data collection
On the questionnaire, participants reported ethnicity by self-identification in eight categories, which we grouped into white (reference) and other. Tobacco smoking was reported in the three categories currently, formerly, and never smoking (reference). Highest level of education was reported in 10 categories according to the Dutch education system and grouped into high (including higher vocational school, university, and postgraduate education) versus low education (reference). Participants reported their medical history of diabetes and cardiovascular diseases. Pre-existing cardiovascular disease was defined as myocardial infarction, angina, congestive heart failure, stroke, or peripheral vascular disease. In addition, all use of medication in the month preceding the study visit was recorded. Participants reported the frequency and duration of their physical activity in leisure time, which was expressed in hours per week of metabolic equivalents (MET-h/week). At the study site, height (cm) was measured without shoes with a vertically fixed, calibrated tape measure.
In women, we grouped use of contraceptives and hormone replacement therapy into current, past, and never (reference) use of estrogens. Menopausal state was categorized in pre- and postmenopausal state (reference) according to information on oophorectomy, hysterectomy, and self-reported state of menopause in the questionnaire.
Fasting blood samples were drawn from the antecubital vein after five minutes of rest of the participant in seating position. Within five minutes after the first blood sample, participants drank a liquid mixed meal. This meal (total 400 mL) contained 600 kCal, with 16% of energy (En%) derived from protein, 50 En% carbohydrates, and 34 En% fat. Two postprandial blood samples were drawn 30 and 150 min after the mixed meal. Fasting and postprandial plasma glucose concentrations were determined by enzymatic colorimetric methods (CV <5%, Roche Modular Analytics P800; Roche Diagnostics, Mannheim, Germany). Fasting and postprandial serum insulin concentrations were determined by an immunometric method (CV <5%, Siemens Immulite 2500; Siemens Healthcare Diagnostics, Breda, the Netherlands). HbA1c concentrations were measured by HPLC boronate affinity chromatography (CV <3%, Primus Ultra; Siemens Healthcare Diagnostics, Breda, the Netherlands). All analyses were performed at the central clinical chemistry laboratory of the LUMC. 19
Measures of body fat
Body weight and percent body fat were assessed by the Tanita bioimpedance balance (TBF-310; Tanita International Division, United Kingdom) without shoes and 1 kg was subtracted from the body weight. BMI was calculated by dividing the weight in kilograms by the height in meters squared. Waist circumference was measured midway between the border of the lower costal margin and the iliac crest. Abdominal subcutaneous and visceral fat depots were quantified by a turbo spin echo imaging protocol using MRI. Imaging was performed on a 1.5 Tesla MR system (Philips Medical Systems, Best, the Netherlands). At the level of the fifth lumbar vertebra, three transverse images each with a slice thickness of 10 mm were obtained during a breath-hold. Abdominal subcutaneous and visceral fat areas were quantified by converting the number of pixels to square cm for all three slides, and the mean of SAT and VAT areas of the three slides was used in the analyses. Earlier studies have shown that such cross-sectional images are highly correlated to total volumes (correlation coefficients around 0.8) and can therefore validly represent abdominal SAT and VAT. 20
Measures of insulin resistance and insulin secretion
First, with the fasting concentrations of glucose and insulin we used the homeostatic model assessment of insulin resistance (HOMA-IR) as fasting glucose (in mmol/L) × fasting insulin (in mU/L)/22.5 and insulin secretion [homeostasis model assessment of β-cell function (HOMA-B)] as 20 × fasting insulin (in mU/L)/(fasting glucose (in mmol/L) −3.5). 21 Additionally, we calculated the total area under the blood concentration curve for glucose (glucoseAUC) and insulin (insulinAUC) concentrations and we calculated the Insulinogenic Index as measure of overall glucose-stimulated insulin secretion as total insulinAUC/total glucoseAUC. 22 Matsuda Insulin Sensitivity Index (Matsuda ISI) was calculated as 10,000/square root [fasting glucose (mg/dL) × fasting insulin (μU/mL)] × [meanglucose0–150 × meaninsulin0–150]. 23 Finally, we calculated the Insulin Disposition Index as a marker of insulin secretion that accounts for variations in whole-body insulin sensitivity by Matsuda ISI × Insulinogenic Index. 22
Statistical analyses
In the NEO study, individuals with a BMI of 27 kg/m2 or higher were oversampled. To correctly represent baseline associations in the general population, 24 adjustments for the oversampling of individuals with a BMI ≥27 kg/m2 were made. This was done by weighting all participants toward the BMI distribution of participants from the Leiderdorp municipality, 25 whose BMI distribution was similar to the BMI distribution of the general Dutch population. 26 All results were based on weighted analyses. Consequently, the results apply to a population-based study without oversampling of individuals with a BMI ≥27 kg/m2.
Data were summarized as mean [standard deviation (SD)], median (25th, 75th percentiles) or as percentage, and stratified by sex. We calculated population-based Z-scores and standardized the values of waist circumference, SAT, and VAT to a mean of zero with a SD of one. With linear regression analyses we examined associations of waist circumference, SAT, and VAT with measures of insulin resistance and insulin secretion. Because of skewed distributions, we used the natural logarithm of all measures of insulin resistance and insulin secretion in the regression analyses. For interpretation of the results, we back transformed the regression coefficients toward percentages increase: (exp(beta) −1) × 100 if beta >0 and percentages decrease: −(1/exp(−beta) −1) × 100 if beta <0 with 95% confidence intervals per SD of waist circumference, SAT, and VAT. To investigate whether associations were different between men and women, we tested for interaction with sex by including product terms of sex and waist circumference, SAT, and VAT in all models, and subsequently performed all analyses separately for men and women. We adjusted the crude associations for age, sex, ethnicity, education, tobacco smoking, alcohol consumption, physical activity, and in women additionally for current use of estrogens and menopausal state. Because abdominal fat is strongly related to total body fat, for the study of specific effects of abdominal fat it is important to adjust the associations for total body fat. 27 Therefore, the models of VAT and waist circumference were additionally adjusted for total body fat. Likewise, we adjusted the models of abdominal SAT for VAT. Finally, in women, we tested for interaction with menopausal state and we repeated all analyses in women stratified by menopausal state. Analyses were performed with STATA Statistical Software ( StataCorp, College Station, TX), version 12.0.
Results
Baseline characteristics
Of the 6671 included participants in the NEO study, 2580 had undergone MRI of the abdomen. In 11 participants, the images were of insufficient quality for the quantification of abdominal SAT and VAT. Participants with MRI measurements of the abdomen were similar to participants without an MRI with regard to BMI, total body fat, and waist circumference. Participants without MRI were somewhat more often current smokers (17% vs. 14%), and more often had a medical history of cardiovascular disease (7% vs. 5%), possibly as a result of the contraindications to undergo MRI. Of the remaining 2569 participants, we excluded 125 participants who used oral hypoglycemic agents or insulin and one participant who was not in a fasting state. In addition, we excluded 110 participants of whom one of the three blood withdrawals had failed. We then consecutively excluded participants who had missing data for total body fat (n = 4), physical activity (n = 46), education (n = 25), ethnicity (n = 3), and tobacco smoking (n = 1). After these exclusions, 2253 participants, 1190 men and 1063 women, were included in the present analysis, with a mean (SD) age of 56 (6) years, and a mean BMI of 25.9 (3.9) kg/m2. The baseline characteristics of these participants are shown in Table 1. On average, women had more total body fat than men. Whereas men had a higher waist circumference and more VAT, women had more abdominal SAT. While HOMA-IR and HOMA-B were higher in men, the Matsuda ISI and Insulin Disposition Index were higher in women. Figure 1 shows that for a given waist circumference, there was a large variation in visceral fat in both men and women.

Scatterplots of crude data of waist circumference against visceral fat (VAT) in men
Results were based on analyses weighted toward the BMI distribution of the general population (n = 2253; 1190 men and 1063 women).
Results are shown as mean (SD), median (25th, 75th percentiles), or percentage.
High education includes higher vocational school, university, and postgraduate education.
Current use of estrogens by women, including contraceptives and hormone replacement therapy.
HOMA-IR = fasting glucose (in mmol/L) × fasting insulin (in mU/L)/22.5.
HOMA-B = 20 × fasting insulin (in mU/L)/[fasting glucose (in mmol/L) −3.5].
Matsuda ISI = 10,000/square root [fasting glucose (mg/dL) × fasting insulin (μU/mL)] × [meanglucose0–150 × meaninsulin0–150].
Insulinogenic Index = insulinAUC/glucoseAUC.
Disposition Index = Matsuda ISI × Insulinogenic Index.
AUC, area under the blood concentration curve; BMI, body mass index; CVD, cardiovascular disease defined as myocardial infarction, angina, congestive heart failure, stroke, or peripheral vascular disease by self-report; HOMA-B, homeostasis model assessment of β cell function; HOMA-IR, homeostasis model assessment of insulin resistance; Matsuda ISI, Matsuda Insulin Sensitivity Index; MET, metabolic equivalents; SAT, subcutaneous adipose tissue; SD, standard deviation; VAT, visceral adipose tissue.
Abdominal subcutaneous and visceral fat with insulin resistance
In the associations with HOMA-IR and the Matsuda ISI, both waist circumference and VAT, but not abdominal SAT, interacted with sex (Table 2), and we therefore performed all analyses both for the total population and separately for men and women. Table 2 shows the regression coefficients and 95% confidence intervals expressed in percentages of increase or decrease in HOMA-IR and Matsuda ISI per SD of the body fat measurements. After adjustment for age, ethnicity, education, tobacco smoking, alcohol consumption, physical activity, current use of estrogens, and menopausal state, per SD of VAT HOMA-IR was 39% higher in men and 64% higher in women. After further adjustment for total body fat, the associations attenuated to 20% (95% CI: 14–26) in men and 40% (95% CI: 29–52) in women. The associations with HOMA-IR and the Matsuda ISI showed a similar, although inverse, pattern (Fig. 2). In men, waist circumference, SAT, and VAT were associated with insulin resistance to a similar extent, whereas in women visceral fat was strongly associated with insulin resistance than waist circumference or SAT.
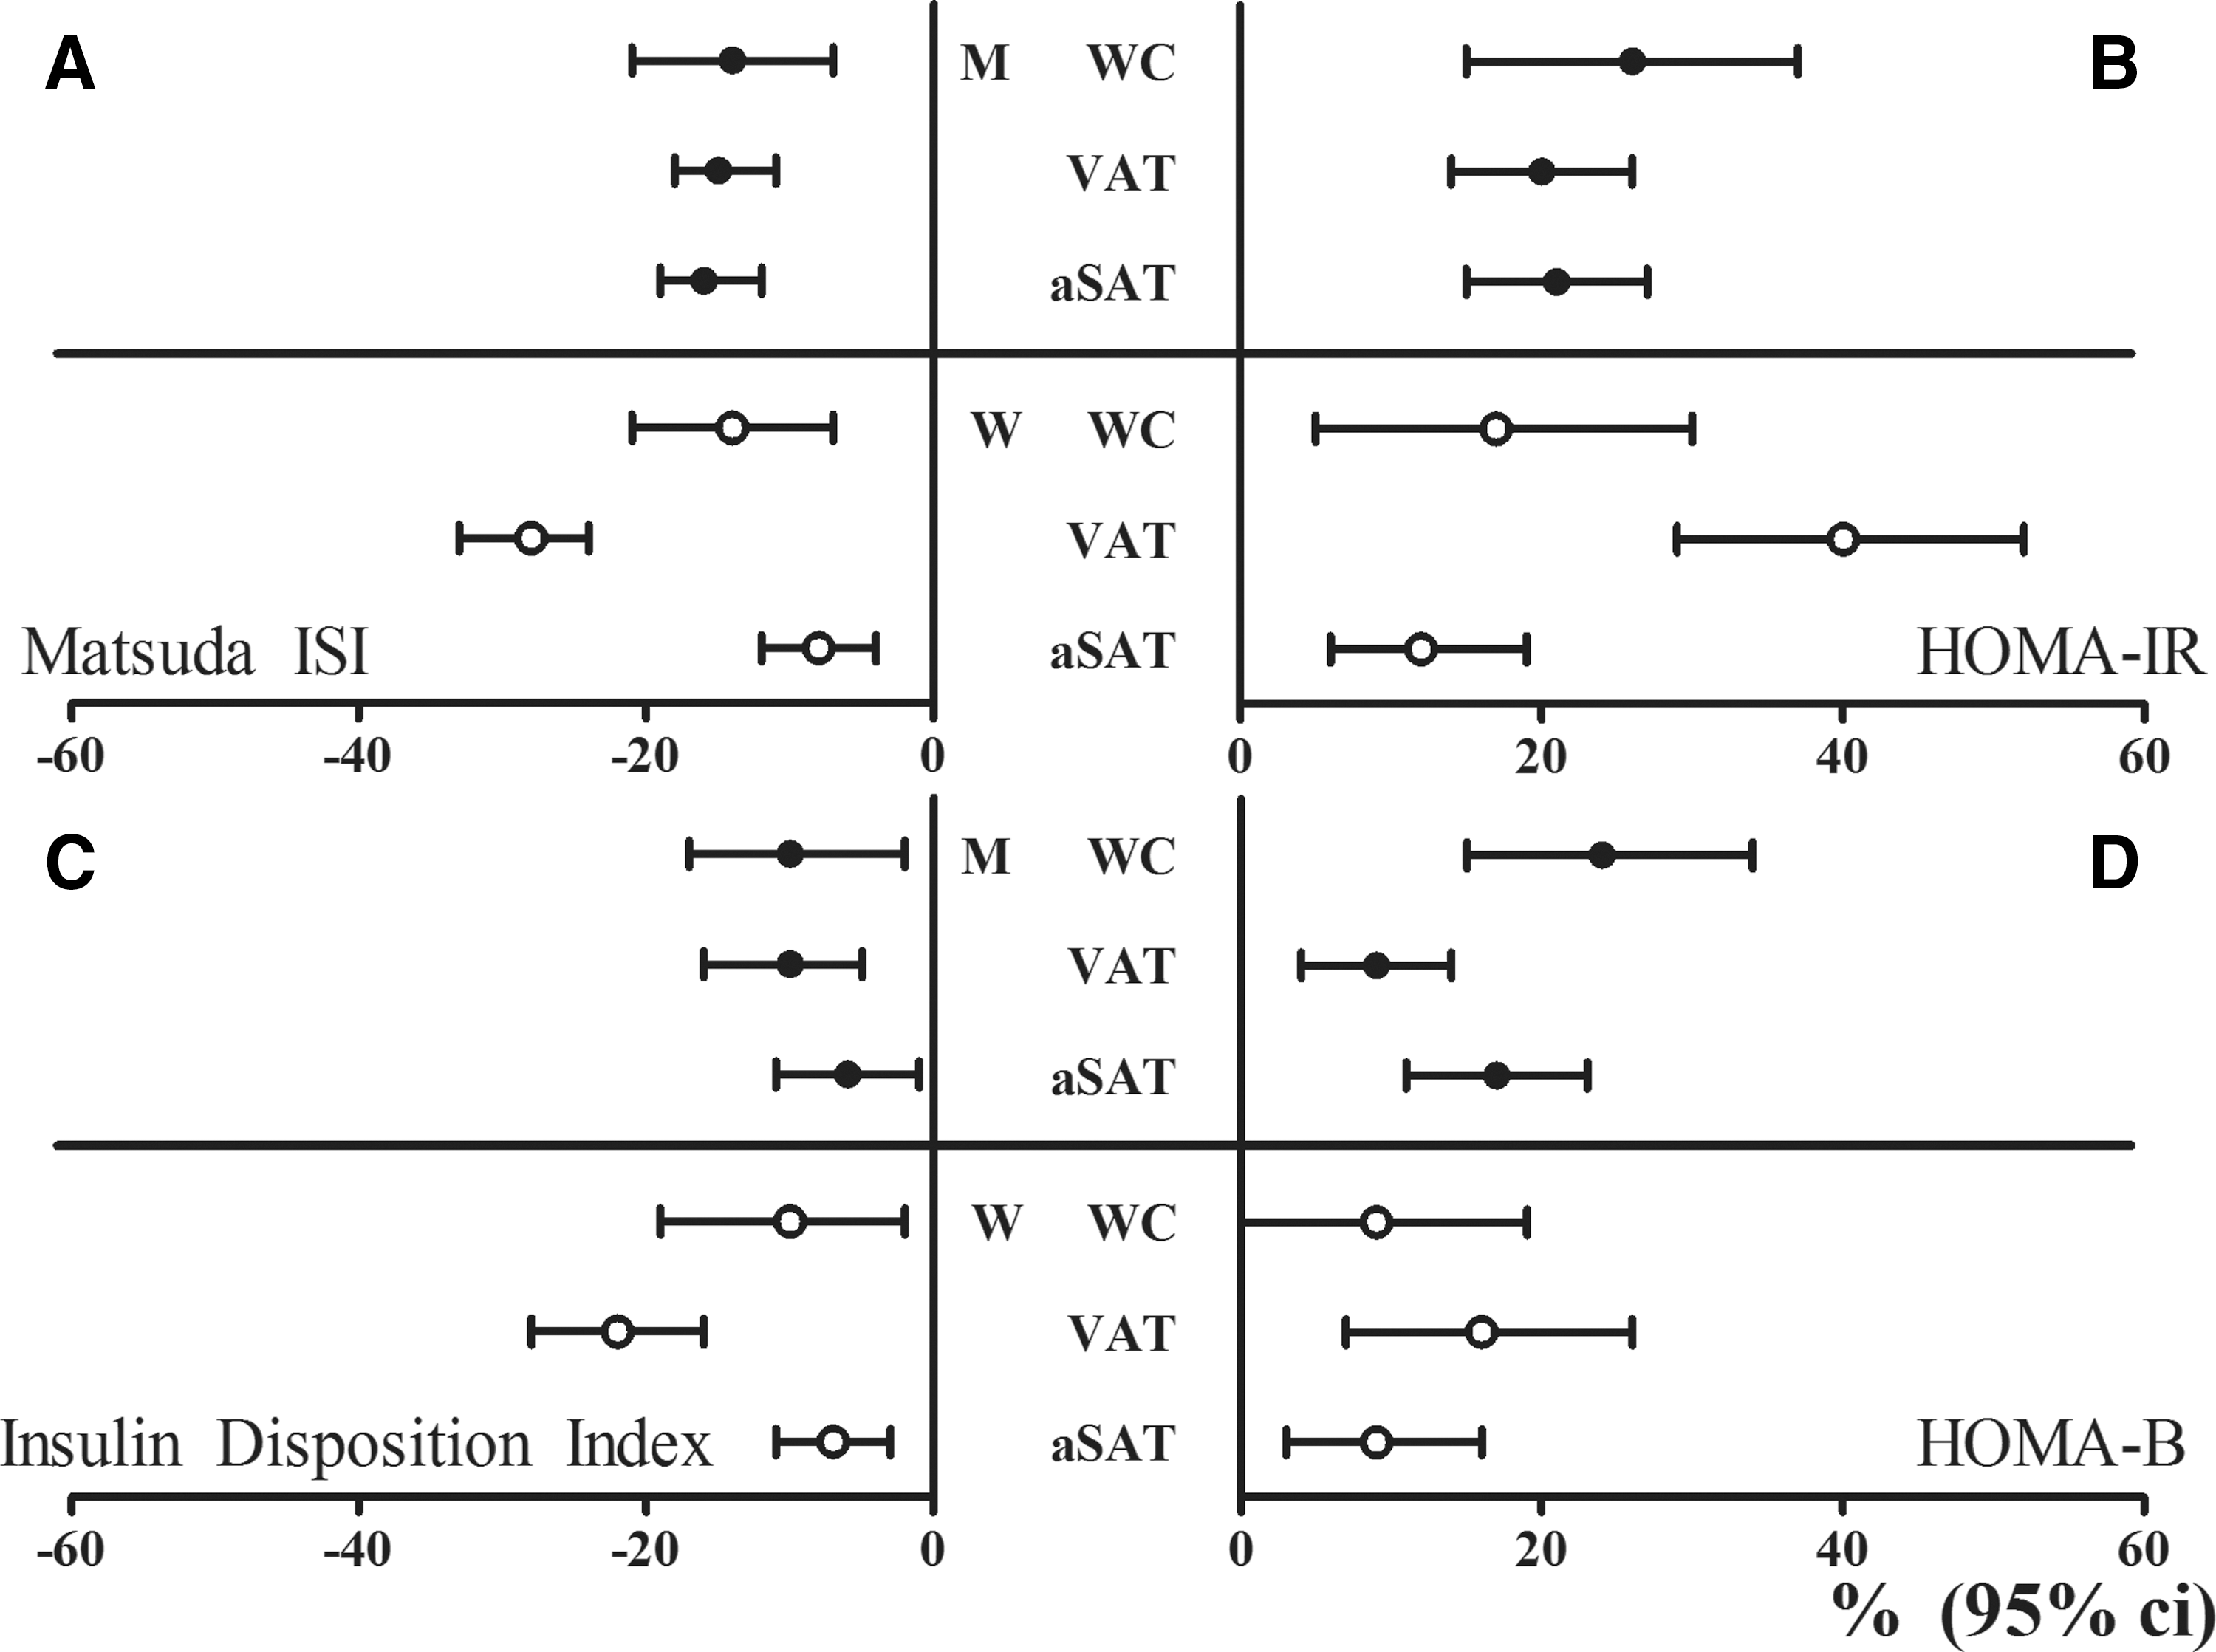
Percentages of increase and decrease with 95% confidence interval in Matsuda ISI
Results were based on analyses weighted toward the BMI distribution of the general population (n = 2253; 1190 men and 1063 women), and were derived from beta coefficients with 95% confidence intervals from linear regression analyses and expressed as percentages of increase or decrease in outcome measure per SD in waist circumference, VAT and abdominal subcutaneous adipose tissue.
HOMA-IR = fasting glucose (in mmol/L) × fasting insulin (in mU/L)/22.5.
Matsuda ISI = 10,000/square root [fasting glucose (mg/dL) × fasting insulin (μU/mL)] × [meanglucose0–150 × meaninsulin0–150].
Adjusted for age, sex, ethnicity, education, tobacco smoking, alcohol consumption, physical activity, and in women additionally for menopausal state and use of estrogens.
Test for interaction term waist circumference with sex (P = 0.043).
Test for interaction term waist circumference with sex (P = 0.026).
Test for interaction term VAT with sex (P = 0.017).
Test for interaction term VAT with sex (P = 0.002).
Test for interaction term abdominal subcutaneous adipose tissue with sex (P = 0.929).
Test for interaction term abdominal subcutaneous adipose tissue with sex (P = 0.588).
aSAT, abdominal subcutaneous adipose tissue; TBF, total body fat; WC, waist circumference.
Abdominal subcutaneous and visceral fat with insulin secretion
Table 3 shows the associations of waist circumference, VAT, and SAT with HOMA-B, the Insulinogenic Index, and the Insulin Disposition Index. After adjustment for age, ethnicity, education, tobacco smoking, alcohol consumption, physical activity, current use of estrogens, menopausal state, and total body fat, each SD in visceral fat was associated with a 9% (95% CI: 4–14) higher HOMA-B in men and 16% 7,26 higher HOMA-B in women (Table 3). In women, visceral fat was more strongly associated with HOMA-B (16% higher per SD of VAT), the Insulinogenic Index (14% higher per SD of VAT), and the Insulin Disposition Index (22% lower per SD of VAT), than waist circumference and SAT (Table 3 and Fig. 2).
Results were based on analyses weighted toward the BMI distribution of the general population (n = 2253; 1190 men and 1063 women), and were derived from beta coefficients (95% CI) from linear regression and expressed as percentages of increase or decrease in outcome measure per weighted SD in waist circumference, VAT and abdominal subcutaneous adipose tissue.
HOMA-B = 20 × fasting insulin (in mU/L)/[fasting glucose (in mmol/L) −3.5].
Insulinogenic Index = total insulinAUC/total glucoseAUC.
Insulin Disposition Index = Matsuda ISI × Insulinogenic Index.
Adjusted for age, ethnicity, education, tobacco smoking, alcohol consumption, physical activity, and in women additionally for menopausal state and use of estrogens.
Test for interaction term waist circumference with sex (P = 0.031).
Test for interaction term waist circumference with sex (P < 0.001).
Test for interaction term waist circumference with sex (P = 0.386).
Test for interaction term VAT with sex (P = 0.011).
Test for interaction term VAT with sex (P = 0.541).
Test for interaction term VAT with sex (P < 0.001).
Test for interaction term abdominal subcutaneous adipose tissue with sex (P = 0.034).
Test for interaction term abdominal subcutaneous adipose tissue with sex (P = 0.001).
Test for interaction term abdominal subcutaneous adipose tissue with sex (P = 0.011).
Finally, there was no interaction between the body fat measures and menopausal status in the associations with insulin resistance and insulin secretion. Premenopausal women had less visceral fat (mean, SD: 51, 32 cm2) than postmenopausal women (69, 43 cm2). Also in premenopausal women visceral fat was associated with HOMA-IR (per SD: 60% higher, 95% CI: 25–105) and HOMA-B (per SD 47% higher, 95% CI: 16–85). Abdominal subcutaneous fat was weakly associated with HOMA-IR (per SD of SAT: 8%, 95% CI: −3 to 19) and not with HOMA-B (1%, 95% CI: −10 to 11) in premenopausal women.
Discussion
In this population-based study with direct assessment of adipose tissue depots, both abdominal subcutaneous and visceral fat were associated with insulin resistance and insulin secretion. In men, abdominal subcutaneous and visceral fat were associated with insulin resistance to a similar extent, whereas in women particularly visceral fat was associated with insulin resistance and insulin secretion. Associations of adipose tissue with insulin secretion were weaker than those with insulin resistance.
Where the majority of epidemiological studies merely rely on waist circumference as a measure of abdominal fat, we performed MR imaging of abdominal fat depots in a large population. Our results showed that for a given waist circumference, the amount of visceral fat varied considerably among both men and women, indicating that waist circumference is imperfect in assessing VAT. Notably, in women, visceral fat was more strongly associated with insulin resistance than waist circumference. Altogether, this emphasizes the importance of both assessing VAT and studying men and women separately.
The findings of our study are consistent with previous studies that showed associations between VAT and insulin resistance 8 –13 and increased risk of type 2 diabetes. 14,15 Our study showed that the total body fat accounts for a large part of the associations between visceral fat with insulin resistance. Nevertheless, after extensive adjustment for potential confounding factors, both abdominal SAT and VAT remained associated with insulin resistance. Because several previous studies have shown null associations 8,10 or even protective effects 9,28 of SAT, it was hypothesized that SAT may act as a metabolic sink, by buffering the influx of dietary lipids and protecting other tissues from lipotoxicity. 29 A possible explanation for these opposite findings may be differences in study design and statistical analyses. For example, protective effects of SAT were shown in case–control-like studies in which patients with type 2 diabetes had more VAT and less SAT than controls. 9,28 In addition, unlike models of VAT, models of SAT should not be adjusted for BMI, body weight, or total body fat, because these are proxies of SAT and will therefore inappropriately attenuate associations of SAT. Another explanation is that abdominal SAT and peripheral SAT may have distinct effects. 30 Whereas peripheral SAT, located at the hips and thighs, has been shown to be inversely related to diabetes risk, 11,31 several studies have shown that abdominal SAT was strongly related to insulin resistance. 30,32 Likewise, we showed that in a population-based study, besides VAT, abdominal SAT was also associated with insulin resistance, indicating that both increased abdominal subcutaneous and visceral adiposity are important in the development of insulin resistance.
In men, abdominal SAT and VAT were associated with insulin resistance to a similar extent, whereas in women particularly visceral fat accumulation was associated with insulin resistance. Although two large studies with direct assessment of adipose tissue depots did not detect sex interactions with insulin resistance, 12,13 in the IRAS study, VAT was more strongly associated with the risk of type 2 diabetes among women than men. 16 The results of this and our study together suggest that women with excess visceral fat accumulation are highly susceptible to the development of type 2 diabetes.
Besides insulin resistance, insulin secretion is a fundamental part of the pathogenesis of type 2 diabetes. 33 Only few studies have investigated associations of abdominal fat depots with insulin secretion. 8,13 In the IRAS study SAT, and not VAT, was associated with acute insulin response as assessed with an intravenous glucose tolerance test. 13 In contrast, a longitudinal study in 196 Japanese with obesity showed that both reductions in BMI and VAT were associated with a reduction in HOMA-B. 34 In our study, in particular in women, the amount of visceral fat was associated with the measures of insulin secretion, suggesting that in women, visceral fat may affect glucose metabolism through both insulin sensitivity and insulin secretion.
One of the potential mechanisms underlying the contribution of visceral fat to the development of insulin resistance and type 2 diabetes is subclinical chronic inflammation. Visceral fat secretes proinflammatory cytokines, predominantly IL-6 and TNF-α, and has a high rate of lipolysis, resulting in an excess of free fatty acids, which may lead to a chronic, low-grade inflammatory state, and reduced insulin sensitivity. 35,36 Besides VAT, we showed that abdominal SAT is important as well in the pathogenesis of insulin resistance. This can be explained since SAT is not an inert depot, but may contribute to the circulating pool of cytokines and free fatty acids. 37 It must be noted that in our study, we assessed abdominal SAT, which may have different properties and exert different effects than peripheral SAT. 30 Therefore, our results pertain to abdominal SAT and not peripheral SAT.
It is yet unknown why certain women are susceptible to visceral fat accumulation. Sex hormones play a major role in the regulation of adipose tissue distribution, function, and stores. 18,38 Estrogens are considered responsible for the gluteal–femoral fat distribution that seems to protect women from type 2 diabetes. 29 After menopause, there is a shift toward an android fat distribution, presumably due to decreasing estrogen levels. 18 In our study, only 19% of the women were premenopausal and they had less visceral fat than postmenopausal women. However, importantly, also in premenopausal women visceral fat was associated with insulin resistance and insulin secretion.
Strengths of this study are the direct assessment of abdominal adipose tissue depots with MRI in a large population, the availability of both fasting and postprandial glucose and insulin concentrations, and of extensive information on potential confounding factors. Potential limitations of our study are that we did not measure insulin resistance and β cell function by hyperinsulinemic, euglycemic, and hyperglycemic clamps, respectively. However, clamp studies are not feasible in large epidemiological studies, and the measures derived from glucose and insulin concentrations correspond well to estimates derived from clamps. 21 Second, due to the cross-sectional nature of our analyses, we cannot exclude the possibility that insulin resistance may have resulted in visceral fat accumulation (reverse causation). One prospective study in Japanese Americans even showed that baseline insulin was associated with future visceral fat accumulation, 39 supporting this direction of the association. Furthermore, removal of visceral 40 or subcutaneous 41 fat depots in humans did not improve insulin sensitivity. Nevertheless, both in prospective analyses of the same study in Japanese Americans 15 and in the IRAS study, 16 visceral fat accumulation was associated with a subsequent increased risk of type 2 diabetes, supporting the hypothesis that visceral fat is causally linked to diabetes risk. Third, these analyses have been performed in a random subgroup of the NEO participants without contraindications to undergo MRI and who were not using glucose-lowering medication. Therefore, our results apply to middle-aged men and women without contraindications to undergo MRI, and who are not using glucose-lowering drugs. Finally, our study population primarily consists of white individuals and our findings cannot be extrapolated to other ethnic groups.
In conclusion, in this population-based study both abdominal subcutaneous and visceral fat were associated with insulin resistance and insulin secretion. Our results suggest that visceral fat accumulation is particularly detrimental for women. Future studies should aim at unraveling the underlying mechanisms of the detrimental metabolic effects of VAT in women. Our study furthermore emphasizes the importance of assessing VAT above waist circumference in assessing cardiometabolic risk. In clinical practice, simple and less expensive measures that can distinct abdominal subcutaneous and visceral fat are needed to improve risk stratification, to be able to offer timely prevention and treatment strategies.
Footnotes
Acknowledgments
The authors express their gratitude to all participants of the Netherlands Epidemiology in Obesity study, in addition to all participating general practitioners. They furthermore thank P.R. van Beelen and all research nurses for collecting data, P.J. Noordijk and her team for sample handling and storage, and I. de Jonge for data management.
The NEO study is supported by the participating Departments, the Division and the Board of Directors of the Leiden University Medical Center, and by the Leiden University, Research Profile Area “Vascular and Regenerative Medicine”. Nutricia Research, Utrecht, the Netherlands, provided the mixed meal. The authors acknowledge the support from the Netherlands Cardiovascular Research Initiative, an initiative with support of the Dutch Heart Foundation (CVON2014-02 ENERGISE).
Author Disclosure Statement
No competing financial interests exist.