




Abstract
Chitosan nanoparticles were prepared using ultrasonication methodology at specific amplitudes and times of sonication. Subsequently, small interfering RNA (siRNA) was added to the solution at predetermined values of nitrogen to phosphorous ratio (N/P), and stirring time. Employing response surfaces generated from a statistical model, the effect of sonication time and amplitude, stirring time, and N/P ratio was studied on the particle size, polydispersity, and loading efficiency of prepared siRNA/chitosan nanoparticles. It was found that to obtain the smallest size, amplitude and time of sonication as well as stirring time should be kept at ∼45%, 165 seconds, and 50 minutes, respectively. Minimum polydispersity values were also obtained at similar values of sonication time/amplitude and stirring time in addition to N/P values of ∼28. Also, the maximum proportion of siRNA loading was observed at approximate values of 300 seconds, 80% and 280 for sonication time, amplitude, and N/P ratio, respectively. The optimum conditions (i.e., to prepare a sample with minimum values of particle size and polydispersity index and maximum values of loading efficiency) were determined as 60.6, 30.0 (seconds), 28.0, and 12.5 (minutes) for amplitude, time of sonication, N/P, and stirring time, respectively. In this scrutiny, the predicted values of optimum formulation were 456 nm size, 89.6% loading efficiency, and 0.4 polydispersity index.
Introduction
I
To make siRNA preparations both robust and cost effective, a satisfactory loading efficiency is required. Therefore, a considerable amount of work has been documented on the loading efficiency of siRNA on polymers but very few have loaded siRNA on chitosan nanoparticles as a bioadhesive, biocompatible, and biodegradable polymer with unique gene delivery properties [2]. The efficacy of siRNA loaded carriers (i.e., gene silencing) has been reported to significantly increase with increasing the siRNA loading [3].
The salt form of chitosan [4], concentration of chitosan in chitosan-poly(lactic-co-glycolic acid) nanoparticles [3] and insertion of 1,2-dioleoyl-3-trimethylammonium-propane [5] and tripolyphosphate [6] as ionic agents, have been reported to affect the loading efficiency of chitosan nanoparticles as carriers of siRNA. However, the above-mentioned studies have only reported a very limited number of experiments without providing a comprehensive understanding about factors influencing the loading efficacy in an siRNA/polymer system. Additionally, in the practical situation of a pharmaceutical preparation, it is not often easy to manipulate the above-mentioned parameters. Thus, more systematic studies are required to investigate the “easier-to-manipulate” factors and their effects on the loading capability of chitosan nanoparticles for siRNA. More importantly, some dependent variables such as particle size and polydispersity of nanoparticles, which substantially influence the efficacy and pharmacokinetics of such preparations [7,8], may also contribute to the loading efficiency of the chitosan nanoparticles, while no study so far has investigated such relations.
The objective of this study was to use statistical analyses to evaluate and optimize a method for preparation of chitosan/siRNA nanoparticles with ultrasonication as a straightforward and green approach, avoiding the use of organic and chlorinated solvents [9]. siRNAs targeted to the enhanced green florescence protein (EGFP) was chosen as a model and were entrapped in or on chitosan nanoparticles. The optimized preparation was then evaluated in terms of its knockdown efficiency on gene expression in the HEK 293T EGFP stable cell line.
Materials and Methods
Materials
Low molecular weight chitosan (deacetylation degree of ca.80%) was purchased from Sigma- Aldrich. Glacial acetic acid and sodium acetate were of analytical grade and bought from Merck chemicals. A previously functionally validated synthetic siRNA targeting against EGFP gene (sense: 5′-GACGUAAACGGCCACAAGUUC- 3′, antisense: 5′- ACUUGUGGCCGUUUACGUCGC- 3′) was synthesized by Bioneer. All the studies related to siRNA were performed using diethylpyrocarbonate- treated water from Sigma Aldrich. pRRLsin.PPTs.hCMV.GFPpro (PAD5) vector (containing the EGFP gene) and HEK-293 cell line were gifted from the molecular research center of Erasmus University. RPMI Medium 1640, Dulbecco's modified Eagle's medium (DMEM), phosphate buffered saline, penicillin streptomycin, and fetal bovine serum (FBS) were purchased from (Biosera Co.).
Preparation of chitosan–siRNA nanoparticles
The chitosan nanoparticles were prepared using ultrasoincation at different values of time and amplitude (see Tables 1 and 2), as detailed previously [10]. Chitosan solutions were prepared with sodium acetate buffer (0.02M) at pH value of 4.5 and immediately sonicated using an ultrasonic probe operating at 20 kHz. Subsequently, the siRNA was added to the solution and stirred at predetermined values of the nitrogen to phosphorous (N/P) ratio and stirring time as given in Tables 1 and 2.
Codes −1, 0, and 1 indicate low, basal, and high levels, respectively.
Indicates the outliers.
Codes −1, 0, and +1 indicate low, basal, and high levels, respectively, for input variables.
Size, particle size; PDI, polydispersity index; loading, loading efficiency.
Measurement of size and polydispersity
The polydispersity index (PDI) and the size of nanoparticles were measured by photon correlation spectroscopy using a Zetasizer Nano ZS® (Malvern). Measurements were performed in triplicate without any further dilution of particles at 25°C.
Calculation of loading efficiency
The loading efficiency of absorbed siRNA (%) on the chitosan nanoparticles was calculated by estimating the concentration of unbound siRNA in the removed supernatant after centrifuging each formulation (15,000 g, 10 minutes) by ultracentrifuge Millipore tubes (cut-off 30 kD) by absorbance measurement (Evolution 260 Bio UV-Vis Spectrophotometer, Thermo Fischer Scientific) at 260 nm. The removed supernatant from unloaded chitosan nanoparticles (without siRNA) was considered as blank. The loading efficiency of siRNA (%) was estimated as the ratio of bound siRNA to the total amount of added siRNA.
Cell culture and siRNA transfection procedure
Investigating the transfection of siRNA by chitosan nanoparticles in optimum formulation was performed by assessing EGFP knockdown in HEK 293 cells stably expressing EGFP. Five hundred thousand cells in DMEM composed of 10% FBS were seeded in each well of a 24-well plate 24 hours before transfection. On the day of transfection, the media was replaced after having optimized siRNA/chitosan preparation containing 50 nM siRNA. After 4 hours of incubation at 37°C in 5% CO2, cells were washed and 500 μL fresh medium containing 10% FBS was added to each well. After 48 hours, the expression of EGFP gene was quantified by flow cytometer assay using Particle Analyzing System PAS-III (Partec).
Statistical analyzes
In this work, the influence of four experimental parameters on the formation of siRNA-loaded chitosan nanoparticles was assessed. The independent variables studied included time and amplitude of sonication, stirring time, and N/P ratio (the ratio of chitosan amine to siRNA phosphate groups). The first two variables are potentially two crucial factors determining the characteristics of chitosan nanoparticles during formation by ultrasound waves [10,11], and the last two are possibly important parameters affecting the loading procedure of siRNA onto chitosan. Particle size, polydispersity index (PDI), and loading efficiency were considered as the dependent variables in this investigation.
To model the four variables and evaluate the relations between the inputs and the outputs, Box–Behnken experimental design was employed as a response surface methodology [12]. This design takes the advantages of appropriate detection of curvature in the response to a three-level design compared with five-level designs such as central composite design, and thus requires fewer experiments to be performed.
Independent variables (input variables)—namely, time and amplitude of sonication, stirring time, and N/P ratio—were defined in low, basal, and high levels, coded as −1, 0, and +1, respectively (see Table 1). From the Box–Behnken design provided by Design-Expert (Version 7.0.0, Stat-Ease, Inc.), 17 experiments were employed including 12 factorial points and five replicates at the center point (for estimation of pure error sum of squares). Table 2 details the levels of the input variables suggested by the software. The relations of the outputs with the inputs were modeled by the equation
where Y is the predicted response (output); β0, intercept; β1 to β3, linear coefficients; β11, β22, and β33, squared coefficients; β12 to β23, the interaction coefficients; and X1, X2, and X3 are the independent variables (inputs).
This equation enables us to evaluate the linear, quadratic, and interactive effects of the inputs on the output(s). The analysis of the data using the regression model and generating the response surfaces were performed using Design-Expert. The relations and interactions between the inputs and the outputs were visualized using three-dimensional graphs and contour plots. To find the optimized preparation, constraints for size and PDI were considered as minimum levels and for loading efficiency was taken as maximum level. Consequently, the optimized checkpoint preparation was prepared and the results of the experiments were compared with the predicted values.
Results and Discussion
Chitosan, as a linear polysaccharide, has shown several interesting properties for biomedical applications. Bioadhesivity, biocompatibility, biodegradability, and the possibility of physical/chemical modifications [2,13,14] has made this polymer a valuable nanocarrier [15]. Due to the nature of the amine groups, chitosan shows positive charges depending on the solvent pH, thus allowing electrostatic interactions with negatively charged molecules such as nucleic acids to form stable complexes.
Our work was comprised of two stages: the first step included formation of the chitosan nanoparticles upon the influence of the ultrasonication method, and the second phase was related to the loading of the siRNA onto the nanoparticles formed during the stirring procedure. While the effective input parameters in the first stage are mainly sonication time and amplitude, the characteristics of the nanoparticles from the second stage directly depend on factors such as stirring and N/P ratio. Having mentioned that, time and amplitude of sonication show their effects on the properties of particles from the second stage, through size and polydispersity of the prepared nanoparticles from the first stage.
In this work, chitosan nanoparticles with the size range from 311 to 3127 nm, PDI of 0.4 to 1.0, and loading efficiency of 10% to 99% were obtained (see Table 2). The response surfaces from the model were employed to look into the effects of input variables on the outputs and figure out the optimum values for each input to attain the nanoparticles with minimum possible values of PDI, size, and maximum possible value of loading efficiency. To find the model that matched most with the data, F-value was calculated to use the analysis of variance. A quadratic (second-order polynomial) equation was fitted to the data and the lack-of-fit F-value of 0.6238, 0.1658, and 0.2493 was achieved for size, loading, and PDI, respectively, indicating that the shortage fit was not significant in all cases. Tables 3–5 give the pure error and adequacy of the models.
Significant at the level of 0.05.
A, B, C, and D represent sonication amplitude (amp), sonication time (time), ratio of nitrogen to phosphorous (N/P), and stirring time (stir), respectively.
Cor Total, totals of information as corrected for mean; Prob>F, probability of getting the observed F value when the null hypothesis is true.
Significant at the level of 0.05.
A, B, C, and D sonication amplitude (amp), sonication time (time), ratio of nitrogen to phosphorous (N/P), and stirring time (stir), respectively.
Significant at the level of 0.05.
A, B, C, and D sonication amplitude (amp), sonication time (time), ratio of nitrogen to phosphorous (N/P), and stirring time (stir), respectively.
The equations fitted to the data are as follows:
Where Y1, Y2, and Y3 are size, loading efficiency and PDI and X1, X2, X3, and X4 represent sonication amplitude (amp), sonication time (time), ratio of N/P (N/P), and stirring time (stir), respectively. The coefficients of determination (R2) of the model for size, loading efficiency, and PDI were 0.84, 0.88, and 0.89, respectively, with adjusted R2 of 0.76, 0.79, and 0.82, respectively.
This indicates sufficient ability of the model to deal with the variables. Furthermore, from the plots of studentized residual against predicted values predicted by the model, few outliers were identified in the experimental data and highlighted using * in Table 2 (plots not shown).
The response surfaces generated by the software representing the effect of the input variables on the outputs (Y1, Y2, and Y3) are illustrated in Figs. 1–3. Each plot visualizes the interaction of two inputs while the third variable is fixed in its middle level value.

Three-dimensional response surfaces obtained for analysis of particle size. amp, sonication amplitude; time, sonication time, N/P, ratio of nitrogen to phosphorous; stir, stirring time.

Three-dimensional response surfaces of time and amplitude

Three-dimensional response surfaces obtained for analysis of polydispersity index. PDI, polydispersity index.
Fig. 1 shows the effects of input variables on the size of siRNA-loaded chitosan nanoparticles. From equation 2, interactions between input variables are only observed between stir, time, and amp to determine the particle size. Figures 1A and 1B demonstrate the interactions of these three factors and their effects on the size. From the plots in Fig. 1, the smallest particle size is observed at nearly mid values of all three variables. This effect is clearer in counter plots.
The results of this work show that either high or low values of stirring time and sonication time or amplitude cause the formation of the larger particles. It is already well documented that the increase in time or amplitude of sonication makes the particles smaller [16,17]. However, our results show that further increases in either of the variables may lead to an increase in the particle size. It is arguable that in the first stage, smaller chitosan nanoparticles are formed from sonication of chitosan when applying high sonication time/amplitude. Nevertheless, possible stronger interactions between siRNA and smaller chitosan particles with more effective surface area [18], make loading more siRNA, thus making the particles larger. Similarly, while at low stirring time, enough shearing forces is not provided to make the particles smaller, high stirring times make the loading efficiency higher which leads to enlarging the particles.
Figure 2 details the interactions of the four variables and their effects on the loading efficiency of the nanoparticles. Reviewing the plots, the most important effect, is in Fig. 2B. In this figure, where the value of both N/P and amp is low, the least loading efficiency is observed, while the maximum loading is observed in Fig. 2A at high values of time and amp. Additionally, from the Fig. 2, increase in amp and time generally make the loading higher. The effect of N/P is only clear when the value of amp is low or medium: in this situation, the N/P shows a direct relation with the loading efficiency.
The plots of loading efficiency versus either of time or N/P and amplitude show that the loading efficiency is maximum when amplitude and time are high (i.e., production of small sized nanoparticles at first stage, as reported previously [10]). This is probably due to stronger interactions between negatively charged siRNA molecules and positively charged chitosan nanoparticles [18]. The minimum loading is observed when amplitude is minimum (i.e., larger particles) and the N/P ratio is low. This is probably due to the fact that when large particles are formed, the effective surface area becomes lower. Therefore, increasing the ratio of siRNA to chitosan (i.e., decreasing N/P) causes deposition of only small amounts of siRNA molecules on the surface of the nanoparticles which leads to lower loading efficiency. However, at smaller particle sizes, majority of siRNA molecules can find a place to be loaded on the chitosan nanoparticles. Thus, the loading efficiency will not change significantly.
Fig. 3 represents the interactions of the four input variables and their effects on the PDI. The decrease in the N/P makes the PDI smaller when either of time or amp is low. This effect becomes less important when the value of time/amp becomes more, and in case of time, a slight increase in PDI is observed when the time value is high. The other three variables show more or less similar patterns—extremely high or low values of each variable makes a small increase in the PDI, while the mid-level values end up in relatively smaller PDIs.
The effect of N/P on polydispersity has been detailed previously and attributed to the viscosity increment followed by increase in concentration of polymer, which leads to less effective energy transmitted on the chitosan [19]. It is also shown that the effect of time/amplitude of sonication is dominant compared with the effect of chitosan concentration (i.e., N/P) [11]. Therefore, at high values of time/amp, sufficient total energy is applied to the nanoparticles, making them monodispersed, which could be an explanation for less effectiveness of N/P when time/amp is high. Similar to the effect of other three variables on the particle size, it could be argued that beyond an optimum value for each variable, a heterogeneous loading happens which makes obtaining particles with larger sizes, while the polydispersity is higher too.
Optimization
Analyzing the response surfaces generated by the software as well as the numerical solution for equations 2 to 4 and constraints, the optimum values obtained for input variables in actual (uncoded) units to minimize the particle size and PDI and maximize the loading efficiency simultaneously, were 60.6, 30.0 (seconds), 28.0, and 12.5 (minutes) for amp, time, N/P, and stir, respectively. The predicted size (nm), loading efficiency, and PDI were 456, 89.6, and 0.4, respectively. The model was then validated using three replicates of the experiment, performed using the suggested conditions with mean (standard deviation) obtained results as 479 (48), 90.7 (2.9), and 0.4 (0.0), respectively, indicating satisfactory agreement between the observed and predicted values. This validates the significance of developed models and their capability to predict the optimum conditions.
Gene silencing study
To study the transfection efficiency of the siRNA-loaded chitosan nanoparticles, flow cytometry was deployed by assessing EGFP knockdown in a HEK 293T cell line stably expressing the gene. A preliminary study showed no significant change in silencing efficiency of chitosan only, siRNA only, and blank samples (data not shown). Subsequently, four siRNA-loaded chitosan samples were experimentally prepared to represent minimum PDI and size and maximum loading efficiency with mean (standard deviation) size, PDI, and loading efficiency of 490 (119), 0.6 (0.1), and 83 (14). Figure 4 illustrates the relative mean fluorescence obtained from chitosan (Cs)/siRNA and control (i.e., siRNA only) samples. Employing t-test, a significant decrease (p<0.05) in gene expression is acquired with mean percentage of decrease calculated as 54.4% compared with control. The finding is comparable with previous reports in the range of 45%–65%, depending on factors such as molecular weight and deacetylation degree [20]. However, it is worth noticing that to confirm the specificity of knockdown, using a formulation containing mismatch siRNA is recommended which was not performed in this work (Supplementary Fig S1; Supplementary Data are available online at www.liebertpub.com/nat).
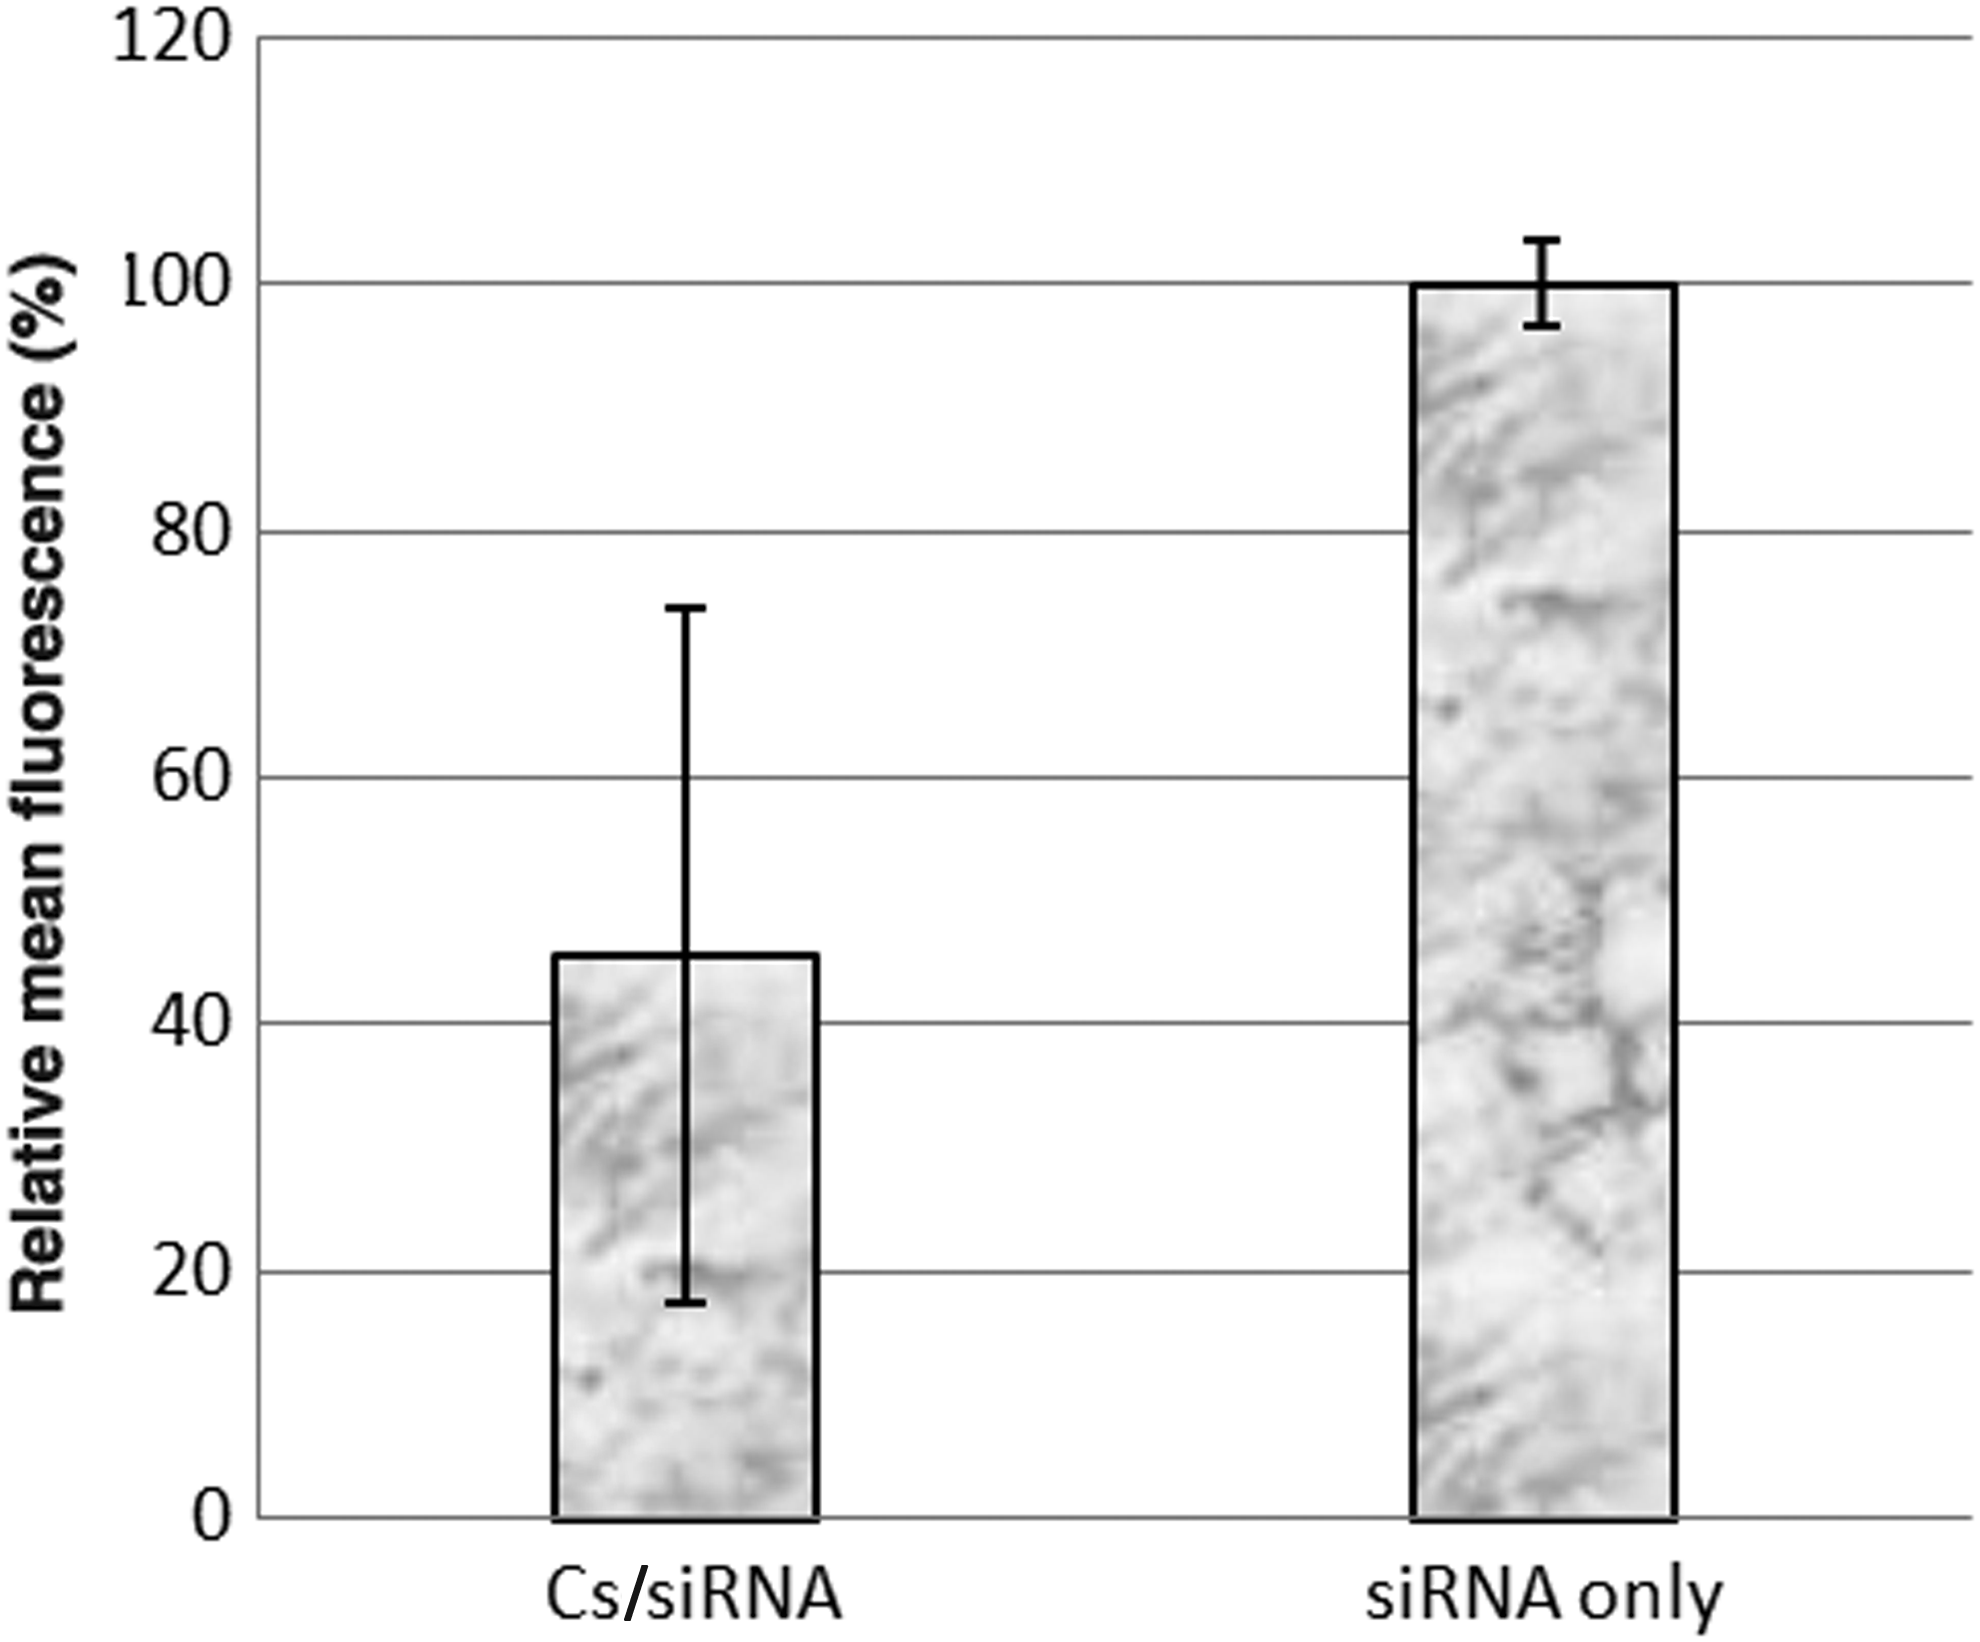
Flow analysis of green florescence protein expression in small interfering RNA (siRNA) and chitosan (Cs)/siRNA samples showing the gene silencing efficiency (n=4).
Conclusion
This study aimed to prepare and optimize siRNA-loaded chitosan nanoparticles. The effects of parameters such as sonication time and amplitude, stirring time, and N/P ratio on the size, polydispersity, and loading efficiency of the nanoparticles were investigated with the optimum preparation showing predicted size (nm), loading efficiency, and PDI of 479, 90.7, and 0.5, respectively. This shows promising for gene delivery applications in future studies.
Footnotes
Acknowledgment
This research has been supported by Tehran University of Medical Science and Health Services grant no. 90-03-90-15263.
Author Disclosure Statement
Authors declare that no competing financial interests exist.
References
Supplementary Material
Please find the following supplemental material available below.
For Open Access articles published under a Creative Commons License, all supplemental material carries the same license as the article it is associated with.
For non-Open Access articles published, all supplemental material carries a non-exclusive license, and permission requests for re-use of supplemental material or any part of supplemental material shall be sent directly to the copyright owner as specified in the copyright notice associated with the article.
