
Abstract
Antisense oligonucleotides (AONs) are promising candidates for treatment of Duchenne muscular dystrophy (DMD), a severe and progressive disease resulting in premature death. However, more knowledge on the pharmacokinetics of new AON drug candidates is desired for effective application in the clinic. We assessed the feasibility of using noninvasive single-photon emission computed tomography-computed tomography (SPECT-CT) imaging to determine AON pharmacokinetics in vivo. To this end, a 2′-O-methyl phosphorothioate AON was radiolabeled with 123I or 111In, and administered to mdx mice, a rodent model of DMD. SPECT-CT imaging was performed to determine AON tissue levels, and the results were compared to data obtained with invasive analysis methods (scintillation counting and a ligation-hybridization assay). We found that SPECT-CT data obtained with 123I-AON and 111In-AON were qualitatively comparable to data derived from invasive analytical methods, confirming the feasibility of using SPECT-CT analysis to study AON pharmacokinetics. Notably, also AON uptake in skeletal muscle, the target tissue in DMD, could be readily quantified using SPECT-CT imaging, which was considered a particular challenge in mice, due to their small size. In conclusion, our results demonstrate that SPECT-CT imaging allows for noninvasive characterization of biodistribution and pharmacokinetics of AONs, thereby enabling quantitative comparisons between different radiolabeled AON drug candidates and qualitative conclusions about the corresponding unmodified parent AONs. This technology may contribute to improved (pre)clinical drug development, leading to drug candidates with optimized characteristics in vivo.
Introduction
A
Several AONs are currently being developed for the treatment of DMD [7,8]. They are designed to bind to complementary sequences in the dystrophin pre-mRNA to induce skipping of a targeted exon to restore the open reading frame. This results in synthesis of an internally deleted, but partially functional dystrophin protein in skeletal muscles of DMD patients [8,9]. AONs that induce exon skipping are therefore promising therapeutic agents for the treatment of DMD, especially since over the past years clinical trials using AONs have demonstrated a marked progress, revealing the restoration of partially functional dystrophin protein and showing acceptable safety profiles in DMD patients [10,11]. One of the main goals of this type of therapy is to deliver AONs at sufficient levels to the appropriate intracellular compartment in specific tissue(s), which is the nucleus of the muscle cells (including heart) for DMD.
Currently, the possibilities to determine AON biodistribution in treated patients are limited, as this requires the painful collection of muscle and tissue biopsies. To guide the optimization process of these molecules, and to optimize the dose-setting and to predict (personalized) response to therapy, direct evaluation of pharmacokinetics is desired. In addition, new methods are needed to assess the relation between drug levels in the target tissues and the therapeutic effects in patients. Ultimately, this would contribute to a more effective and personalized treatment, especially for rare diseases with low patient numbers that prevent large-scale clinical trials, such as DMD.
An attractive technique to quantitatively study pharmacokinetics in vivo is single-photon emission computed tomography-computed tomography (SPECT-CT) imaging. This technique is noninvasive and can be used for preclinical studies and human trials, making it a useful tool for translational approaches [12,13]. Combining quantitative measurements of radioactive tracer levels in tissue using SPECT with 3D anatomical information obtained by CT facilitates quantitative, high-resolution longitudinal assessment of drug levels in vivo. Furthermore, the use of imaging can reduce the number of animals needed for preclinical pharmacokinetics and efficacy studies, as multiple measurements and experiments can be performed within the same animal.
In this study we aimed to develop noninvasive imaging methods to track a radiolabeled 20-mer 2′-O-methyl phosphorothioate AON designed to induce skipping of mouse dystrophin exon 23 in mdx mice, a rodent model of DMD [14]. To this end, we have developed customized radiolabeling procedures for the production of 123I- and 111In-radiolabeled AONs with sufficient radiochemical yield for use in in vivo studies, and their application in SPECT-CT imaging for noninvasive pharmacokinetics evaluation. Tissue levels determined by SPECT-CT imaging were subsequently compared with those determined by invasive and conventional biodistribution analysis methods (AON tissue levels analyzed by gamma counting and a ligation-hybridization assay developed for the tested AON). Our results demonstrate good agreement between the different methods, underlining the validity and feasibility of using SPECT-CT imaging approaches to noninvasively study drug delivery and pharmacokinetics of AONs in vivo.
Materials and Methods
Animals
Mice were housed and handled according to institutional guidelines complying with Dutch and European legislation. Approval of the local IACUC was obtained before the start of the studies. Male mdx (C57BL/10ScSn-Dmdmdx/J) mice were obtained from Jackson Laboratories (Bar Harbor, ME). Mice were of 100% C57BL/10ScSn background and 5–8 weeks of age at the time of the experiment. Animals were kept in a temperature-controlled environment with a 12-h light/12-h dark cycle. They received a standard diet (Sniff R/M-H; Sniff Spezialdiäten GmbH, Soest, Germany) and water ad libitum.
Chemicals
The Bolton-Hunter reagent SHPP (3-(4-hydroxyphenyl)propionic acid N-hydroxysuccinimide ester) was from Sigma-Aldrich (St. Louis, MO). DOTA 1,4,7,10-tetraazacyclododecane-1,4,7,10-tetraacetic acid) was purchased from Chematech (Dijon, France). Unless stated otherwise, all other chemicals used for tracer synthesis were obtained either from Acros (Geel, Belgium) or Sigma-Aldrich. Na123I in 0.05 M NaOH was purchased from GE Healthcare (Eindhoven, the Netherlands). 111InCl3 in 0.05 M HCl was obtained from Perkin Elmer (Groningen, the Netherlands). The unmodified 20-mer 2′-O-methyl phosphorothioate AON with sequence 5′-GGCCAAACCUCGGCUUACCU-3′ (Fig. 1A) was synthesized by BioMarin Nederland. An amine-modified AON (3′-NH2-AON) (Fig. 1B), was obtained from Biospring GmbH (Frankfurt am Main, Germany).
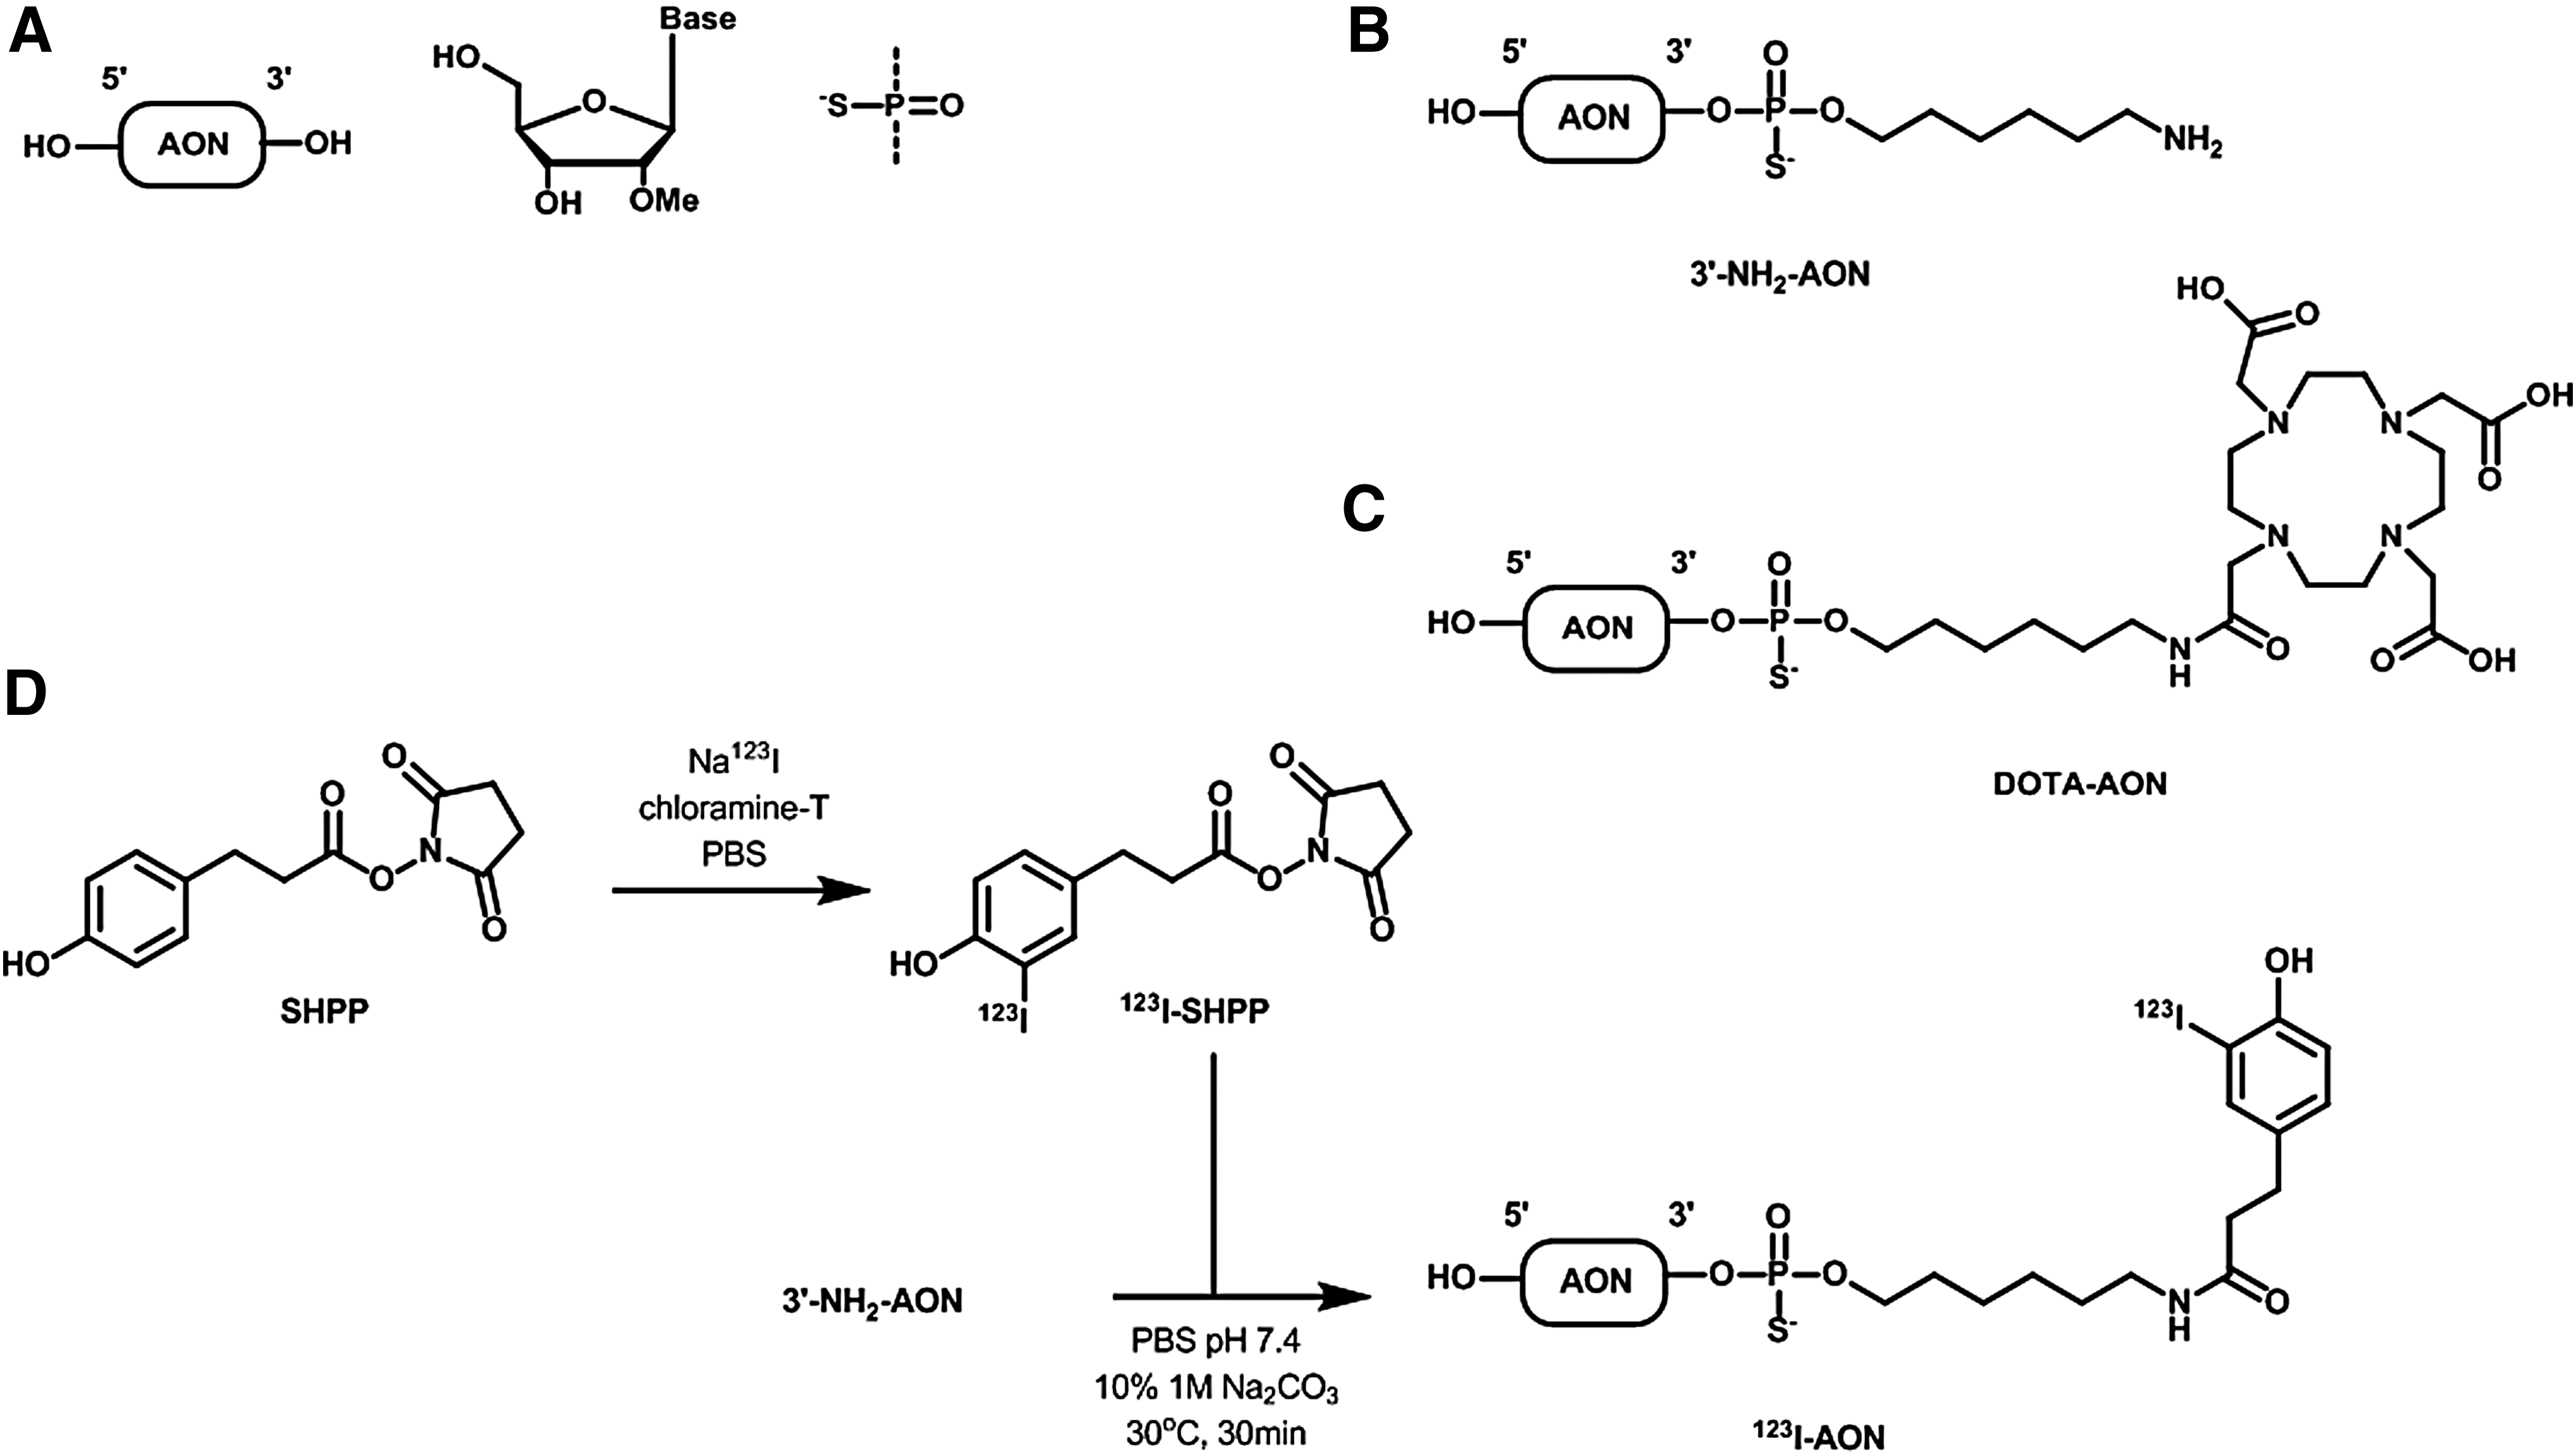
Structures of molecules used in this study.
Synthesis of DOTA-functionalized AON
3′-NH2-AON (Fig. 1B) was used for DOTA functionalization by amide coupling to freshly prepared DOTA 3-sulfo-N-hydroxysuccinimide ester (DOTA-sulfo-NHS) under basic conditions followed by high performance liquid chromatography (HPLC) purification [15]. In brief, a mixture of DOTA (32 mg, 66 μmol) and sulfo-NHS (14 mg, 65 μmol) in water (250 μL) was added drop wise to a solution of EDC (13 mg, 68 mmol) in water (250 μL) at 0°C. The mixture was stirred at 0°C for 30 min, allowed to warm to RT and then added to an ice-cold solution of 3′-NH2-AON (0.5 μmol) in 1 M carbonate buffer (pH 9, 250 μL), and stirring was continued for 16 h at RT. The excess of DOTA reagent was removed by size exclusion chromatography (PD-10 column, GE Healthcare). The collected fraction was then purified by RP-HPLC (Alltima C18 5 μM; Buffer A: 0.1 M TEAA in 5% (v/v) ACN/H2O; Buffer B: 0.1 M TEAA in 80% (v/v) ACN/H2O; 10% B 3 min, 10%–60% B 20 min, 100% B 5 min). The fractions containing the products were pooled and concentrated to give 3′-DOTA-conjugated AON (ESI-MS calculated [M] = 7468.4; found [M-H]− 7467.9, [M-2H+Na]− = 7490, [M-2H+K]− = 7506, Purity: 89% as determined by ultra-performance liquid chromatography) (Fig. 1C).
Synthesis of 123I-labeled AON
123I-labeling of the 3′-NH2-AON (“123I-AON”) was performed using a custom-designed protocol based on the Bolton-Hunter method (Fig. 1D). Details of the procedure are provided in the Supplementary Data (Supplementary Data are available online at www.liebertpub.com/nat). Quality control was performed by analytical HPLC on an Agilent 1100 Series system with a binary pump and a variable wavelength UV-detector (preset to 260 nm) in series with a Gabi-Star radioactivity detector (Raytest GmbH). The samples were injected onto a Symmetry C18 column (100 Å, 5 mm, 3.9 × 150 mm, Waters), which was eluted at 1 mL/min with a linear gradient of eluent B (0.1 M -TEAA in 80% (v/v) ACN/H2O) in eluent A (0.1 M TEAA in 5% (v/v) ACN/H2O) as follows: 3 min at 10% B followed by a linear gradient to 60% B in 20 min. The identity of the tracer was confirmed by co-injection with cold reference material, which had been obtained by labeling of 3′-NH2-AON with I-127 (0.5 equiv.) and was thoroughly characterized by HPLC-MS (results not shown). Radioactivity was measured in a calibrated digital ionization chamber (model VIK-202; Veenstra Instruments).
Synthesis of 111In-labeled AON
For synthesis of the 111In-labeled AON (111In-AON) the 3′-DOTA functionalized AON (3′-DOTA-AON) was dissolved in 0.2 M NH4OAc buffer pH 7.0 to yield a concentration of 10 μg/μL. The solution was aliquoted and stored at −80°C. For radiolabeling, a solution of 111InCl3 in 0.05 M HCl (7.5–13 μL, 102–202 MBq) was mixed with twice the volume of 0.2 M NH4OAc buffer pH 6.5, and 1 μL of the 3′-DOTA-AON stock solution was added per 50 MBq of 111InCl3. The solution was incubated at 60°C for 10 min in an Eppendorf thermomixer (350 rpm), followed by addition of 5 μL of 10 mM DTPA in phosphate-buffered saline (PBS, pH 7.0 with NaOH) and incubation at 60°C for another 5 min. Radiochemical yield and purity was assessed by analytical HPLC using the same method as described above for the 123I-labeled AON and by radio-TLC using ITLC-SG strips (Varian, Inc.) eluted with 200 mM EDTA in saline, which were then imaged on a phosphor imager (FLA-7000; Fujifilm). The crude reaction mixture was purified through a Zeba spin desalting column (7 kDa MWCO, 0.5 mL; Thermo Scientific) preconditioned with saline to obtain the pure 111In-AON (64–156 MBq in 54–85 μL of saline). Calculated pseudo-specific activity based on radiolabeling yield and Zeba-recovery was 4.6 ± 0.2 MBq/μg (n = 4).
In vitro stability of radiolabeled AONs
In vitro stability of 123I-AON and 111In-AON was studied in PBS pH 7.4 and 50% mouse serum in PBS at 37°C. Mouse serum was isolated from blood of wild-type C57BL/6 mice. Directly after radiosynthesis and purification, a solution of the pure tracers in PBS pH 7.4 (radiochemical purity as determined by analytical HPLC >99%) was diluted with either PBS only or with appropriate volumes of PBS and mouse serum to achieve a concentration of ∼25 MBq/mL in the incubation mixture. The mixture was then incubated at 37°C in a thermomixer under gentle agitation (350 rpm). Aliquots were taken at indicated time points up to 48 h after incubation. For the serum samples, aliquots were thoroughly mixed with an equal volume of ice-cold ACN (−20°C), and proteins separated by centrifugation (13,200 rpm, 5 min). Aliquots of the supernatant were used for analytical HPLC and measuring of radioactivity in a gamma counter as described below. To quantify tracer binding to serum proteins, the remaining supernatant was discarded and radioactivity of the pellet was determined.
Preparation of injection solution for animal studies
Individual doses were prepared maximally 15 minutes before administration by diluting the required volume of a freshly made 80 mg/mL stock solution of the unmodified 2′-O-methyl phosphorothioate AON in saline with an appropriate volume of the 123I-AON or 111In-AON stock solution, and diluting with saline to obtain injection doses of 100 μL containing ∼30 MBq of the tracer and the amount of nonfunctionalized AON corresponding to 100 mg/kg body weight. Final quality control of the injection solution was performed by analytical HPLC (Supplementary Figs. S1 and S2). Radiochemical purity of all injection solutions was >99%.
In vivo animal studies
For all studies, indicated mice were anesthetized using medical air containing 2%–3% isoflurane (0.4 L/min), and were maintained under anesthesia with medical air containing 1%–2% isoflurane (0.4 L/min) throughout the experimental procedure. Body temperature was maintained by heating the animal bed via a continuous flow of warm air, while anesthesia depth was controlled by altering the isoflurane concentration guided by continuous monitoring of the breathing frequency. Maximum anesthesia duration was 4 h in all imaging experiments described.
Four hours experiment (SPECT-CT 0–4 h postinjection (p.i.) followed by conventional biodistribution): 100 mg/kg AON containing tracer amounts of 123I-AON or 111In-AON (23–30 MBq/mouse; <1% of the dose) was injected subcutaneously in the neck of anesthetized mdx mice (n = 2–3), followed by SPECT scans for ∼3.3 h (4 × 50 min) and finally a CT scan. At the end of the experiment mice were euthanized by tissue perfusion (about 4 h p.i.) with saline and tissues were isolated for further analysis.
Twenty-four hours experiment (conventional biodistribution 24 h p.i.): 100 mg/kg AON containing a tracer amount 111In-AON (29–30 MBq/mouse; <1% of the dose) was administered subcutaneously to awake mdx mice (n = 3). Subsequently, 24 h p.i. blood was collected from the vena saphena and mice were euthanized by tissue perfusion with saline. All tissues were collected (and urine from the bladder if available) and blotted dry, weighed, and parts were analyzed by gamma counting, while the other parts of each tissue sample were immediately frozen in liquid nitrogen and stored at −80°C for subsequent ligation-hybridization measurements.
Forty-eight hours experiment (SPECT-CT 2–4 h, 22–24, and 46–48 h p.i followed by conventional biodistribution): 100 mg/kg AON, containing a tracer amount 111In-AON (29–31 MBq/mouse; <1% of the dose) was administered subcutaneously to awake mdx mice (n = 3). Mice were then anesthetized three times (2–4, 22–24, and 46–48 h p.i.), subjected to a CT-scan followed by a SPECT scan (∼90 min) in each of the three timeframes, resulting in an average scan time point of 3, 23, and 47 h p.i. Immediately after the last scan blood was collected from the vena saphena and animals were euthanized by tissue perfusion (about 48 h p.i.). Tissues were isolated for further analysis.
SPECT-CT imaging and data analysis
SPECT scanning was performed using a NanoSPECT-CT scanner (Bioscan, Inc., Washington, DC) and the following conditions were used during CT scanning: 45 kV, 360 projections at 2,000 ms per projection. SPECT images were reconstructed and a Philips IMALYTICS Research Workstation (Philips Research, Aachen, Germany) was used to overlay the SPECT and CT images using anatomical landmarks and a rigid registration algorithm. Heart, muscle (quadriceps), and bone (femur) were identified purely from the CT scan, whereas bladder, liver, kidney, and injection areas were identified from the CT scan with guidance from the SPECT scan. Tissues and the injection site were segmented in the reconstructed CT and SPECT images to define volumes of interest (VOI) for the analysis of tracer levels in the corresponding regions in the SPECT image. The total radioactivity counts in the determined VOIs were subsequently expressed as the percentage of the injected dose (as determined by the total radioactivity counts in a VOI encompassing the complete animal).
Gamma counting of tissue samples
The isolated tissue specimens were combined with 1 mL of water, and sample radioactivity was counted in a gamma counter (Wizard 1480; PerkinElmer) using energy windows of 138–180 keV for 123I and 100–510 keV for 111In, respectively. Standards of the tracer solution injected in the animals were included to determine the percentage injected dose per gram (%ID/g) and per organ (%ID/organ).
Ligation-hybridization assay
Quantification of the unlabeled AON levels was performed by a ligation-hybridization assay using template probes complementary to the AON as previously described [9]. Calibration curves of the analyzed AON prepared in 60 times diluted pooled control mouse tissue in PBS were included. AON concentration in standards of the solution injected in the animals was measured by ligation-hybridization to determine the percentage injected dose per gram (%ID/g) and per organ (%ID/organ). All analyses were performed in duplicates.
Statistical analysis
The two-sided unpaired Student's t-test was used to assess the statistical significance of differences between two sets of data. One-way analysis of variance followed by Tukey's multiple comparison test was used to assess the statistical significance of differences between multiple sets of data. Results are presented as the means ± SD. Differences were considered to be statistically significant when P < 0.05.
Results
Synthesis of 123I- and 111In-labeled AONs
For introduction of the 123I label to the 3′-NH2-AON (Fig. 1B) we have developed a customized protocol based on the Bolton-Hunter method, a mild iodination method commonly employed for radiolabeling of proteins [16,17]. The two-step procedure comprises radioiodination of the Bolton-Hunter reagent SHPP under oxidative conditions in the presence of chloramine-T to yield the intermediate 123I-SHPP, which is isolated by extraction into toluene, and conjugated to the 3′-NH2-AON (Fig. 1D). After purification by preparative HPLC and formulation in saline, 81–126 MBq of 123I-AON (5%–7% decay-corrected radiochemical yield) was obtained from 1.7 to 1.9 GBq of [123I]NaI in a total synthesis time of about 2 h. Radiochemical and chemical purity of 123I-AON as assessed by analytical HPLC were >99% and >95%, respectively (Supplementary Fig. S3).
As an alternative strategy, we explored labeling of the corresponding 3′-DOTA-AON (Fig. 1C) with 111In. Using optimized conditions (60°C for 10 min in ammonium acetate buffer pH 6.5), radiolabeling yields of the crude ranged from 85% to 98% (Supplementary Fig. S4). Following size-exclusion purification over a Zeba spin column, radiochemical purity of the final tracer as determined by analytical HPLC was ≥99% (Supplementary Fig. S5). In total, 64–156 MBq of 111In-AON was obtained from 102 to 202 MBq of 111InCl3, with isolated radiochemical yields ranging from 61% to 77%.
In vitro stability of radiolabeled AONs
123I-AON proved to be quite stable in PBS (pH 7.4) at 37°C. Based on radio-HPLC analysis, ∼97% of intact tracer was recovered after 6 h incubation, slowly decreasing to 93% after 24 h, and 91% after 48 h. Following incubation in 50% mouse serum for 1 h at 37°C, only ∼20% of radioactivity was recovered in the supernatant after protein precipitation and centrifugation, indicating binding of the probe or its metabolites to serum proteins (Supplementary Table S1). Notably, the value of ∼20% is identical to the initial value obtained at t = 0 and stayed fairly constant over time (only 7% increase in 24 h), strongly suggesting that it is predominantly the intact tracer binding to the serum proteins, and not potential metabolites. The percentage of intact probe in the supernatant as determined by radio-HPLC was 95% after 24 h, similar to the value in PBS (Supplementary Fig. S6A).
Similarly, following incubation of 111In-AON in 50% mouse serum for 1 h at 37°C, only ∼27% of radioactivity was recovered in the supernatant after protein precipitation and centrifugation (Supplementary Table S2). Radio-HPLC analysis of the supernatant revealed excellent stability of the probe, with >99% of intact radiotracer after 24 h (Supplementary Fig. S6B).
Pharmacokinetics of 123I-AON and 111In-AON based on SPECT-CT scan analysis
Biodistribution of the AON labeled either with 123I or 111In was determined after subcutaneous (s.c.) injection of 100 mg/kg unmodified AON (Fig. 1A) (spiked with trace amounts of 123I-AON or 111In-AON; ∼25 MBq/mouse) in mdx mice by SPECT-CT scans 0–4 h after injection. The scans showed substantial accumulation of the tracer in the liver and the kidney (See Fig. 2 for representative scan). In the kidney, the radiotracer appeared concentrated in the renal cortex. A large part of the radiotracer was also visibly present in the bladder, suggesting that the compound was efficiently cleared by the kidney.

Representative SPECT/CT images of mdx mouse in time frame 150–200 min after s.c. injection of unmodified AON (100 mg/kg) spiked with 123I-AON. s.c., subcutaneous; SPECT/CT, single-photon emission computed tomography/computed tomography.
Absolute levels of 123I-AON or 111In-AON within the various tissues at the analyzed time frames (between 0 and 200 min after injection) were determined by analysis of reconstructed SPECT and CT scans. Results are presented in Fig. 3, and the data clearly show that at every time point analyzed significant amounts of the tracer were detected at the injection site. The levels markedly decreased over time [from >50% of the dose in the first time frame (ie, 25 min p.i.) to ∼20% of the dose in the last time frame (ie, 175 min p.i.)], showing that both 123I-AON and 111In-AON were released from the injection site after s.c. injection (under anesthesia) relatively slowly. The highest AON levels were observed in the liver, kidney, and the bladder, with levels still slowly increasing during the first 4 h after injection. In general, the results for the 123I-AON and 111In-AON were quite comparable and indicated that the biodistribution of the AON was not markedly influenced by the 123I or 111In label. Levels of 111In-AON in the bladder tended to be somewhat higher than 123I-AON levels, however, this was not significantly different. Notably, HPLC-analysis of the urine of mice obtained after 24 h revealed only 13% of polar metabolites, while the majority of the radioactivity (87%) was excreted in the form of the intact 111In-AON (results not shown). The AONs were detected in the femur, quadriceps, and heart, but at relatively low overall levels (Table 1). Both for femur and quadriceps AON levels were increasing over time, while levels in the heart remained almost constant.

Tissue levels of 123I-AON
Data are presented as% of injected dose/g tissue (n = 3).
P < 0.01 (111In-AON compared to 123I-AON).
AON, antisense oligonucleotide; SPECT, single-photon emission computed tomography.
Comparison of biodistribution of 123I-AON and 111In-AON based on SPECT-CT analysis, gamma counting, and ligation-hybridization assay
To determine whether detection of the radiolabels using SPECT-CT imaging provided representative and quantitative data of the biodistribution of the radiolabeled AONs, isolated tissue samples obtained from animals after the scans were analyzed by gamma counting (radiolabel detection) and by a ligation-hybridization method, which was developed for quantification of total unmodified AONs in biological samples (Fig. 4). In general, SPECT-CT data showed good correlation with conventional tissue biodistribution data. Tissue concentrations of both 123I-AON and 111In-AON tended to be slightly higher based on gamma counting compared to SPECT-CT scans, which can be explained by differences in the exact time of detection (∼175 min vs. ∼240 min after dosage, due to acquisition of CT scans just before euthanasia). Additionally, levels of total AON detected by ligation-hybridization assay were consistently lower (approximately threefold, except for liver where it was approximately sixfold) compared to levels based on gamma counting (see also Supplementary Fig. S9).

Levels of 123I-AON
The biodistribution data of the 123I-AON and 111In-AON based on gamma counting and ligation-hybridization measurements confirmed the minor differences in biodistribution between the two differently labeled AONs observed in the SPECT scan analysis (Supplementary Fig. S7). In particular, the gamma counting data showed approximately threefold higher blood levels of 123I-AON compared to 111In-AON (P < 0.01 at 4 h after injection, Supplementary Fig. S7A), which may be linked to the slightly higher urinary excretion of 111In-AON (with SPECT-CT imaging increased bladder concentrations of 111In-AON compared to 123I-AON were observed, Fig. 3). Also, comparison of the gamma counting data revealed a slightly higher spleen uptake of 123I-AON compared to 111In-AON. This difference, however, was not found for the unmodified AON (as determined by ligation-hybridization assay), and might be related to 123I-AON aggregates or other adducts.
Pharmacokinetics of 111In-AON up to 48 h after injection
Since qualitatively and quantitatively comparable results were obtained for both AONs independent of the radiolabel, we decided to continue our studies with the 111In-AON for practical reasons, among others the longer physical half-life of In-111 (2.8 days vs. 13.2 h for I-123) and a straightforward radiolabeling procedure. Figure 5A shows the levels of 111In-AON by SPECT in various tissues at the analyzed time frames within ∼2–48 h after injection in mdx mice (n = 4). In contrast to the previous data, which were obtained in anesthetized mice, the major part of the 111In-AON was released from the injection site within the first 3 h after injection: after 3 h only 3% of the dose was still present, slowly decreasing to 1.5% of the dose after 47 h versus ∼15% of the dose still present at injection site 3 h after injection in the short-term experiment, Fig. 3B. A likely explanation for this difference is the fact that in this second experiment, the mice were awake during the first 2 h after injection, and movement and absence of anesthesia may have enhanced the release of compound from the injection site. It was observed that 111In-AON was predominantly present in liver and kidney 23 and 47 h p.i., similar to the data collected during the first 4 h p.i., whereas 111In-AON was almost absent from the bladder at 23 h after injection. Levels of 111In-AON in the quadriceps, femur, and heart were low (<1.5% of injected dose/g tissue) and, most pronounced in the quadriceps, (slowly) decreased over time 3–47 h after injection (Table 2).

Tissue levels (% ID/organ) of 111In-AON in mdx mice at different time frames after s.c. injection of unmodified AON (100 mg/kg) spiked with 111In-AON as determined from SPECT scans
Data are presented as % of injected dose/g tissue (n = 4).
Verification of the SPECT-CT data by total gamma counting demonstrated only minor differences between the two analytical methods, apart from liver at 24 h p.i. and bone at 48 h p.i., where levels of radioactivity were significantly higher when measured with gamma counting than based on SPECT analysis (Fig. 5B). These results indicate that SPECT-CT analysis can be used to noninvasively determine the pharmacokinetics of the 111In-AON. In line with the data obtained from the ligation-hybridization assay described above, absolute levels of the unmodified AON were significantly lower than 111In levels measured by gamma counting (Fig. 5B and Supplementary Fig. S8). The ratio between the tissue levels determined by gamma counting and the ligation-hybridization assay are presented in Supplementary Fig. S9, showing that the ratio was the highest for the liver and that there was no significant change of this ratio over time. The observation that the ligation-hybridization assay gave lower levels of AONs compared to the gamma counting, especially in the liver, could be due to (potentially matrix-dependent) incomplete recovery of the AON in the ligation hybridization assay. In addition, differences in liver metabolism or liver uptake of the unlabeled AON compared to the radiolabeled AON may also have caused this difference. What is the exact cause of this discrepancy would be of interest for future studies.
Discussion
In this study we describe the radiolabeling of an AON with either 123I or 111In and the application and evaluation of noninvasive SPECT-CT imaging methods to quantitatively assess the pharmacokinetics and biodistribution of radiolabeled AONs in vivo. Results obtained from SPECT-CT were comparable to the more conventional biodistribution analysis using gamma counting and a ligation-hybridization assay, further confirming the usefulness of SPECT-CT analysis to noninvasively study pharmacokinetics of radiolabeled AONs in vivo. Importantly, while it was previously considered a challenge to noninvasively quantify muscle levels in mice, we established that the AON uptake in muscle, a key tissue in DMD, could be determined and quantified using SPECT-CT imaging in mdx mice. We expect that the applicability of this method is not only limited to preclinical pharmacokinetics and pharmacodynamics studies, but that SPECT-CT imaging may also be employed in the clinic to determine target organ concentrations in patients. This is an important step toward enabling direct and noninvasive optimization of AON therapy in (DMD) patients and a further application of SPECT-CT imaging in drug development. The current experiments describe the use of 2′-O-Me phosphorothioate oligonucleotides, but we expect that this methodology is applicable to any other oligonucleotides chemistry. It is therefore not limited to 2′-O-Me phosphorothioate oligonucleotides in the DMD field, but its application is potentially much broader, provided that the chemistry is compatible with the synthesis conditions required for installation of the label as described here. Naturally, as for any new application, this would require further research.
In a first experiment, the AON under investigation in this study was labeled with two different SPECT-radionuclides (123I or 111In) to determine whether the 123I-labeling synthon or the 111In-chelator moiety would affect the pharmacokinetics of the AON, and if so, which labeling strategy would best reflect the biodistribution pattern of the unmodified AON. Results from both radiolabeled AONs were relatively similar, the levels of 111In-AON in the bladder tended to be somewhat higher than the 123I-AON levels, although the difference was not significant (due to high variation). The higher levels of 111In-AON in the bladder/urine appeared also to be reflected by lower levels in the heart, which might be assumed to reflect the levels in the circulation, especially early after administration. These results suggest a somewhat faster urinary elimination of the 111In-labeled AON, which could be explained by the higher hydrophilicity of the 111In-AON compared to its 123I-AON analog. Nevertheless, the pharmacokinetic and biodistribution profile of 123I-AON and 111In-AON are qualitatively and quantitatively comparable and also reflect the profile of the unmodified AON (Figs. 3 and 4), suggesting that both labeling methodologies can be used to study the pharmacokinetics of AONs of interest. For practical reasons (ease of labeling, lower cost and better availability of the radionuclide, and the longer half-life), we decided to continue our longer term study with the 111In-labeled AON.
The results obtained in this study with both 123I-AON and 111In-AON, showed that the AONs were rapidly excreted via the bladder in the first 4 h after administration (10%–23% of the injected dose; Fig. 3). Furthermore, levels in kidney and liver gradually increased in the first hours after administration in parallel with decreasing levels at the injection site before remaining quite stable and relatively high throughout the study up to 48 h (∼10% and ∼5% of the injected dose in liver and kidney, respectively, Fig. 5). This indicates an initial elimination phase with fast urinary excretion, followed by a relatively long phase (at least 48 h) with stable tissue levels of the AON, including muscle. This is in line with earlier studies of AON pharmacokinetics, also reporting high liver and kidney uptake and long biological half-lives of 2–4 weeks for AONs [18,19]. This long half-life of the AONs may be due to their RNA binding capacity, as it has also been reported that modifications of sugars at the 2′ position, like the 2′-O-methyl phosphorothioate AON used in this project, can increase RNA binding affinity, thereby significantly increasing the tissue half-life of the AON [19].
To assess whether SPECT-CT imaging could be used to quantitatively determine the tissue levels of AONs in vivo, we compared SPECT-CT results from the radiolabeled AONs with the AON levels as determined by gamma counting and a ligation-hybridization assay (Figs. 4 and 5). These two assays differ from SPECT-CT analysis with respect to what is/can be detected: gamma counting, similar to SPECT-CT, determines the total activity of radiolabel in isolated tissue and therefore is not able to distinguish between the tracer AON and potential metabolites, whereas the ligation-hybridization assay specifically detects the full-length, nonmetabolized AON. The data obtained from the ligation-hybridization assay in general show qualitatively similar results to the SPECT-CT imaging and gamma counting, suggesting that at least for a qualitative overview of AON levels in vivo SPECT-CT imaging provides relevant data. Quantitatively, the ligation-hybridization assay consistently resulted in three to five times lower AON levels than determined based on the radiolabel with SPECT-CT imaging and scintillation counting (except for liver where the difference was six to nine-fold between SPECT-CT and ligation-hybridization). This might be due to the fact that the radiolabeled AONs were not subjected to 3′ exonucleolytic metabolism, the major route of 2′-O-Me phosphorothioate RNA degradation [20], because due to the chemical modifications for radiolabeling, the 3′ terminus is blocked (Fig. 1B, C, respectively). In contrast, the unmodified AONs could be prone to metabolism, and the resulting shortened AONs would not have been detected by the ligation-hybridization assay, thereby yielding an underestimation of relative AON levels versus the SPECT and scintillation counting methods. Moreover, it cannot be excluded that the hybridization-ligation assay underestimated the levels of unchanged AON in the tissues due to potential incomplete recovery from the tissue. Potential overestimation of the total AON levels by radioactivity-based detection due to measurements of free radiolabel could also partly explain the results. Free iodide is known to accumulate in the thyroid and when 123I-labeled compounds are used in vivo, there is a possibility that the radiolabel is released from the parent compound. To exclude this, the SPECT scans were visually inspected for accumulation of [123I]iodide in the thyroid of the mice. In fact, we did not observe any significant uptake of radioactivity in the thyroid in the SPECT scans, suggesting that deiodination of 123I-AON did not occur to a significant extent. This finding is further supported by the high stability of both radiotracers found in the in vitro studies (>94% for 123I-AON and >99% for 111In-AON was recovered after incubation in 50% mouse serum at 37°C for 24 h). Therefore, overestimation of the total AON levels by SPECT-CT and gamma counting due to free radiolabel is highly unlikely.
An interesting observation was the difference between clearances of the labeled AONs from the injection site between the two studies. In the first (short-term) study, the biodistribution of the labeled AON within 4 h after injection was determined, whereas in the follow-up (longer-term) studies biodistribution was determined within a time frame of 48 h p.i. The imaging data clearly revealed that after injection under anesthesia the release from the injection site was quite slow (Fig. 3) and that around 4 h after administration there was still 15%–20% of the AON present at the injection site. However, when the mice received s.c. injections while awake, the major part of 111In-AON was released from the injection site within the first 3 h after injection (∼3% of injected dose present at injection site). These differences might be due to the administered anesthesia, as it is known that anesthesia may affect the pharmacokinetics of test compounds [21]; besides, movement of the animals may have stimulated AON release from the injection site. This observation may be important to follow-up since it would affect the way AON (but also other candidate drug) development studies using SPECT should be analyzed and executed.
In conclusion, this study demonstrates that SPECT-CT imaging of 123I- or 111In-labeled AONs is a promising technique to noninvasively study the biodistribution of 2′-O-Me phosphorothioate AONs in vivo, and to assess differences in pharmacokinetics of candidate drugs (AONs). The use of SPECT-CT imaging may enable improved preclinical and clinical research in the development of (AON) drug candidates with better characteristics in vivo, and at the same time a reduction of the number of laboratory animals used for this type of studies. Furthermore, the here described development and application of the SPECT-CT technology may in the future also improve personalized treatment of patients with AONs, for example, by generating quantitative knowledge regarding the relationship between pharmacokinetics and efficacy of (personalized) drug treatment of patients with rare diseases.
Footnotes
Acknowledgments
We thank Caren van Kammen and Carlijn van Helvert for excellent technical assistance, and Iris Verel for animal study-related administrative assistance. For this work we received financial support of the Ministry of Economic Affairs, the Netherlands.
Author Disclosure Statement
B.A., D.M., R.V., and P.C.d.V. are employed by BioMarin Nederland BV. For E.v.d.S., T.L., H.T.J., J.W.H., K.D., R.R., and M.L.H.V. no competing financial interests exist.
References
Supplementary Material
Please find the following supplemental material available below.
For Open Access articles published under a Creative Commons License, all supplemental material carries the same license as the article it is associated with.
For non-Open Access articles published, all supplemental material carries a non-exclusive license, and permission requests for re-use of supplemental material or any part of supplemental material shall be sent directly to the copyright owner as specified in the copyright notice associated with the article.