




Abstract
To determine if the pharmacokinetics and pharmacodynamics of gapmer antisense oligonucleotides (ASOs), containing phosphorothioate backbones and 2′-O-methoxyethyl RNA modifications (2′-MOE ASOs), can be altered by renal disease, a series of experiments were performed in models of chronic kidney disease (CKD) and acute kidney injury (AKI). In an adenine diet model of CKD, 2′-MOE ASO activity in the whole kidney was preserved and the reduction in target RNA was sustained for 2–4 weeks postdose. Additionally, 2′-MOE ASO distribution within the kidney was altered in mice with CKD, in that ASO delivery to cortical regions with tubular damage was reduced while distribution to the medulla was increased. Finally, the concentration of 2′-MOE ASO in liver of mice with CKD was elevated relative to mice without CKD, indicating a reduction in renal function and ASO excretion can potentially alter the systemic delivery of 2′-MOE ASOs. These data were generally reproduced in an aristolochic acid model of AKI, with the exception that 2′-MOE ASO activity in the whole kidney was slightly reduced with acute injury. The results from these studies have important implications for the development of 2′-MOE ASO therapeutics as both renal and extrarenal 2′-MOE ASO pharmacokinetics and pharmacodynamics may be altered in patients with renal disease. Importantly, the underlying mechanisms that alter 2′-MOE ASO distribution in the context of kidney disease warrant further examination.
Introduction
K
Antisense oligonucleotide (ASO) therapeutics are currently undergoing clinical evaluation for the treatment of a wide range of disease indications, including those associated with kidney disease. One of the early chemical modifications to ASOs was the incorporation of a phosphorothioate linkage in the oligo backbone (PS ASOs). Many clinically relevant gapmer ASOs contain a uniform PS backbone and base modifications, such as 2′-O-methoxyethyl RNA (2′-MOE) flanking a central DNA gap region (2′-MOE ASO). [1]. The liver and kidney are the primary organs of ASO uptake following parenteral administration [2].
Within the kidney, the proximal tubule epithelial cells (PTECs) accumulate most of the ASO, likely through luminal uptake, although the exact mechanism is unknown [3–5]. While a great deal of effort has been spent understanding the safety and tolerability of ASOs in the healthy kidney, summarized in a recent review, whether ASO distribution and activity are altered by renal disease has not been thoroughly assessed [6]. The tissue distribution and urinary excretion of a PS ASO was found to not be substantially altered by either cisplatin or anti-Thy1.1 antibody-induced renal disease in rats [7]. However, the effect of disease on the distribution and activity of clinically relevant 2′-MOE ASOs has not been assessed. Given the number of patients being treated with antisense drugs is ever expanding, it is essential the pharmacokinetics and pharmacodynamics (PK/PD) of ASOs in both the healthy and diseased kidney be carefully assessed.
To determine if 2′-MOE ASO PK/PD and suborgan distribution were altered in the context of renal disease, we utilized mouse models of both CKD and AKI. Mouse models of kidney dysfunction were chosen as they manifest with many molecular, cellular, and gross pathological changes observed in human kidney disease and are tractable to screening multiple factors, which may affect ASO PK/PD (eg, a broad ASO dose range, type of renal injury, etc.) The adenine diet-induced CKD model (AD CKD) is a mouse model of uremic renal failure, driven by the formation of oxidized adenine uroliths that recapitulates the tubulointerstitial inflammation and fibrosis commonly observed in humans with CKD [8,9]. Ingestion of aristolochic acid induced (AAI) can lead to varying degrees of renal failure in humans and intraperitoneal (IP) injection of AAI in rodents induces AKI (AAI AKI) characterized by tubulointerstitial inflammation, podocyte effacement, and reduced glomerular filtration rate (GFR) [10–13]. We performed dose–response studies to evaluate liver and kidney 2′-MOE ASO distribution and activity in animals with both AD CKD and AAI AKI. Additionally, we characterized suborgan kidney activity (ie, cortical and medullary) and performed duration-of-action studies in both healthy and AD CKD mice.
Materials and Methods
The 2′-O-methoxyethyl (MOE) Antisense Oligonucleotide Synthesis A gapmer 2′-MOE ASO, targeting Malat-1 (MALAT-1 ASO), consisting of a uniform phosphorothioate backbone, a central DNA region, and modified flanking nucleotides (5-10-5), containing 2′-O-methoxyethyl (2′-MOE), was synthesized and purified on an automated DNA synthesizer using phosphoramidite chemistry as previously described [14]. See Supplementary Table S1 (Supplementary Data are available online at www.liebertpub.com/nat) for 2′-MOE ASO sequence and chemistry information.
Animal studies
All animal procedures were reviewed and approved by the Ionis Institutional Animal Care and Use Committee (IACUC) and conducted in accordance with the Public Health Service Policy on Humane Care and Use of Laboratory Animals. All mice were housed in a pathogen-free environment and given food and water ad libitum. FVB/NJ (JAX#1800) mice were obtained from The Jackson Laboratories.
AD model of CKD
The AD model of CKD was performed in accordance with previously published methods with the following modifications. At 8–10 ten weeks of age, mice were switched from standard laboratory chow to a control diet (CD), which was a Western Diet (Harlan Teklad Diet 88137) consisting of 42% of calories as fat and 0.15% cholesterol or the AD, which was identical in composition, but included 0.15% adenine. Mice were fed either the control or AD for 6 weeks to induce renal inflammation and fibrosis. After 6 weeks, all mice were switched to the CD and a plasma sample was drawn by retroorbital bleed. Mice were grouped according to plasma blood urea nitrogen (BUN), with BUN levels between 26–45, 46–94, and 95–170 mg/dL being considered low (LOW), medium (MED), and high (HI) responders to the diet-induced renal disease, respectively. After 4-week washout, where accumulated crystallized adenine was cleared from the kidney and disease progression was stabilized, mice were placed into the following studies.
Dose–response study
Mice from the CD and AD groups (MED and HI) received a single IP injection of phosphate buffered saline (PBS) or 90, 30, or 10 mg/kg of MALAT-1 ASO (See Supplementary Table S1 for sequence and chemistry). After 72 h, mice were sacrificed and plasma, kidney, and liver samples were collected for further analysis.
Duration-of-action study
Mice from the CD and AD groups (MED and HI) received a single IP injection of PBS or 30 mg/kg of MALAT-1 ASO. Cohorts of mice from each group were sacrificed 2 and 4 weeks postinjection. Plasma, kidney, and liver samples were collected for further analysis.
AAI AKI model
Groups of mice were injected IP with saline (pH 5.5) or 3 mg/kg AAI, in a volume of 10 μL/g body weight, daily for three consecutive days. One week later, at the peak of renal dysfunction as assessed by plasma BUN and creatinine levels, mice from both the saline and AAI groups were administered PBS or MALAT-1 ASO (at 90, 30 or 10 mg/kg) through subcutaneous (SC) injection. After 72 h, mice were sacrificed and plasma, kidney, and liver samples were collected for further analysis.
ASO dosing and necropsy
ASO dosing solutions were prepared in phosphate-buffered saline at a concentration such that the appropriate dose (mg/kg) was delivered by administration of 10 μL ASO/g body weight through SC injection. At specified time points post-ASO administration, blood was collected through cardiac puncture from anesthetized mice, animals were euthanized by cervical dislocation, and tissues were harvested for RNA expression analysis, quantification of ASO, and histological examination.
Plasma analysis
Whole blood collected, either by retro-orbital bleed at intermediate times or by cardiac puncture at necropsy was subjected to centrifugation (10 min, 10,000 rcf) to generate plasma for subsequent analysis. Plasma transaminase, creatinine, and BUN concentrations were analyzed on an Olympus AU400e automated clinical chemistry analyzer (Melville, NY).
Laser capture microdissection methods
Laser capture microdissection (LCM) was performed using the Arcturus platform (Thermo Fisher). One half of a kidney from each animal was placed in a Cryomold and frozen in O.C.T. compound (Thermo Fisher) at necropsy. Sections of the kidney were cut on a Leica CM3050S cryostat (Leica Biosystems), mounted on PEN slides (Thermo Fisher), and stored at −80 C until used for LCM. Sections were fixed in a 1:1 mixture of acetone:70% ethanol, stained with the Histogene stain (Thermo Fisher), dehydrated in increasing percentage of ethanol, and finally xylenes. Regions of the cortex and medulla were excised using a combination of UV cutting and infrared laser stimulated to the Macro LCM Caps on an ArcturusXT LCM system. Following tissue collection, the Macro LCM Caps were fitted to a 0.5-mL tube containing 50 μL extraction buffer and snap frozen on dry ice. RNA was purified according to the manufacturer's instructions using the PicoPure RNA Isolation Kit (Thermo Fisher).
RNA purification and quantitative reverse transcription-polymerase chain reactions
Approximately 50 mg of tissue was homogenized in a 1% beta-mercaptoethanol guanidine isothyocyanate buffer at sacrifice and total RNA was prepared using the RNeasy Kit (Qiagen) according to the manufacturers' direction. Alternatively, RNA was purified from tissue collected by LCM (see Laser capture microdissection methods). Target mRNA levels were measured using the One-Step RT-PCR Kit, gene-specific TaqMan probe, and primer sets, StepOnePlus reagents and thermocycler (Thermo Fisher), and subsequently normalized to the total RNA concentration (RiboGreen, Thermo Fisher). See Supplementary Table S2 for sequences of gene-specific oligos used in quantitative reverse transcription-polymerase chain reactions (qRT-PCR).
Histology analysis
Kidneys were fixed in 10% neutral buffered formalin for 48 h, dehydrated in graded ethanol, and embedded in paraffin, sectioned, and stained using Hematoxylin and Eosin or Sirius Red. ASO IHC was performed using an antibody generated in-house. In situ hybridization (ISH) for Malat-1 RNA expression was performed according to the manufacturer's instruction (Advanced Cell Diagnostics).
Quantification of ASO tissue concentration
ASO tissue concentrations were determined using modified versions of previously reported methods (Yu, 2007). Briefly, the liver and kidney tissues were homogenized and then extracted using ammonium hydroxide and phenol:chloroform:isoamyl alcohol (25:24:1). The aqueous layer was additionally purified through solid-phase extraction (Phenomenex, Inc., Strata X SPE), dried down under nitrogen, and reconstituted in 140 μL of water containing 100 μM EDTA. Samples were injected on an Agilent 1,200 liquid chromatography–mass spectrometry–UV system (Agilent, Wilmington, DE). Absorbance was measured at 260 nm and UV chromatograms were analyzed using ChemStation software.
Results
To evaluate the effect of CKD on 2′-MOE ASO PK/PD, we adapted a previously published mouse model of AD-induced CKD with the following modifications to improve food intake and reduce morbidity [8,9]. First, we used FVB mice, a strain we found that was more susceptible to renal injury at lower concentrations of dietary adenine, instead of C57BL/6 mice and, second, we substituted Western Diet for standard laboratory chow. After 6 weeks being fed 0.15% adenine in Western Diet, we used plasma BUN to stratify mice, into groups with moderate (AD MID) and severe (AD HI) CKD.
Table 1 summarizes the terminal plasma transaminase, creatinine, and BUN levels and renal mRNA biomarkers (Kim1 and Ngal) in mice on CD, and with adenine diet-induced AD MID and AD HI CKD, which were administered a dose–response of a 2′-MOE ASO targeting the ubiquitously expressed, long noncoding RNA, Malat-1 (MALAT-1 ASO). The terminal levels of the plasma biomarkers confirmed that the mice categorized as AD MID and AD HI continued to present with the same level of disease throughout the duration of the study. Furthermore, administration of MALAT-1 ASO had no effect on renal function as indicated by the lack of effect on any key biomarkers of renal function within the MID and HI AD groups and neither the AD nor MALAT-1 ASO had any effect on kidney or spleen weight (Supplementary Table S3). However, body and liver weights were higher in the CD group due to a combination of diet-induced increases in body and liver fat and the impaired metabolism in the AD-fed mice with CKD that led to weight loss (Supplementary Table S3).
Data tabulated as mean ± SEM; n = 4/group.
Statistically significant differences (p < 0.05) compared with the mean value of the CD PBS group based on one-way ANOVA adjusted with Tukey's multiple comparison test.
CD, control diet; PBS, phosphate buffered saline.
Histological analysis of kidneys from animals from the CD, AD MID, and AD HI groups corroborated the disease severity classifications based on the plasma endpoints. Serial sections of kidney were stained with Hematoxylin and Eosin (H&E), Sirius Red, an ASO-recognizing antibody, and Malat-1 ISH to assess disease-induced alterations in renal morphology, collagen deposition, and ASO distribution and activity, respectively (Fig. 1). H&E staining revealed gross morphological changes, both cortical and medullary that correlated with plasma markers of decreased kidney function and injury. Regions of cortical damage (Fig. 1 and the upper right corner of the “AD HI Cortex ASO 90” frames of Fig. 2) appeared to have diminished accumulation of MALAT-1 ASO and reduced ASO activity, as evidenced by positive Malat-1 ISH staining. Whereas a marked increase of MALAT-1 ASO staining in the medulla was observed despite a uniform increase of medullary damage and fibrosis (Figs. 1 and 2).

Histological analysis of the kidneys of mice on CD or in the medium (AD MID) or high responders (AD HI) to the AD-induced renal disease administered 90 mg/kg MALAT-1 ASO. H&E to show general renal morphology; Sirius Red to stain collagen as a result of fibrosis; immunohistochemical staining of ASO (ASO IHC) to show the pattern of ASO accumulation and ISH of Malat-1 RNA (MALAT-1 ISH). ASO, antisense oligonucleotide; CD, control diet; AD, adenine diet; ISH, in situ hybridization; H&E, Hematoxylin and Eosin.

Histological analysis of the kidneys of mice on CD or in the medium (AD MID) or high responders (AD HI) to the AD-induced renal disease administered 90 mg/kg MALAT-1 ASO. H&E to show general renal morphology; Sirius Red to stain collagen as a result of fibrosis; immunohistochemical staining of ASO (ASO IHC) to show the pattern of ASO accumulation and ISH of Malat-1 RNA (MALAT-1 ISH).
Results shown in Fig. 3A, B revealed that moderate or severe CKD did not alter MALAT-1 ASO activity in the whole liver and kidney. In the liver, regardless of the CKD status, slight dose-dependent trends in hepatic Malat-1 RNA reduction were observed across the different MALAT-1 ASO treatment groups. Similarly, in the whole kidney, no significant differences in MALAT-1 ASO activity were detected among the various treatment groups. Dose-dependent reductions in Malat-1 RNA were observed in the whole kidney, with the 90 mg/kg dose resulted in a 78% suppression of Malat-1 RNA expression in the control and adenine-containing diet groups. It is also important to note that renal Malat-1 RNA expression was reduced in mice treated with PBS in the AD MID and AD HI groups by 34% and 38% when compared with the PBS CD group. Analysis of megalin, a marker of PTECs, expression demonstrated a negative correlation between disease severity and megalin expression (Fig. 4C). Thus, the reduced Malat-1 expression is likely due to disease-induced loss of, or damage to, PTECs (and likely other cells), and the MALAT-1 ASO activity observed is attributable to activity in remaining cells.
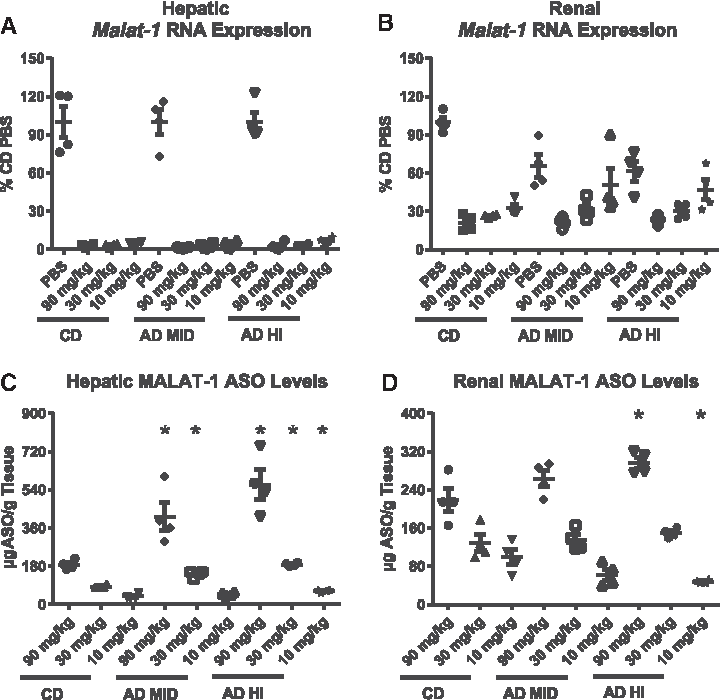
Malat-1 RNA expression and tissue ASO accumulation were determined for liver (
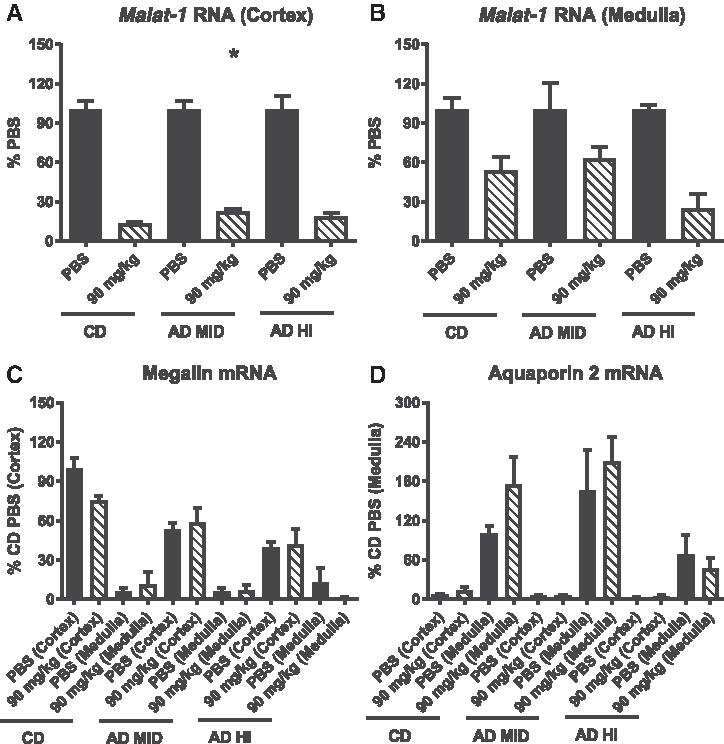
Laser capture microdissection and qRT-PCR analysis of Malat-1 RNA expression in the cortex
The effect of CKD on MALAT-1 ASO PK in the liver and kidney is shown in Fig. 3C, D, respectively. In mice administered either 90 or 30 mg/kg MALAT-1 ASO, statistically significant increases in hepatic MALAT-1 ASO accumulation occurred in both AD MID and AD HI groups when compared with the controls. At the low dose of 10 mg/kg MALAT-1 ASO, a significant increase in hepatic ASO levels were also observed in the AD HI mice. Similar trends were observed in kidney for the 90 and 30 mg/kg groups, whereas disease appeared to have a negative effect on renal MALAT-1 ASO concentration in the animals administered 10 mg/kg ASO.
To determine the impact of the increased medullary accumulation on renal suborgan MALAT-1 ASO pharmacodynamics, we performed LCM on kidneys, from PBS- and ASO-treated (90 mg/kg) animals. Broad regions of the cortex and medulla that were isolated by LCM, mRNA expression analysis was performed. At 90 mg/kg it was difficult to discern any disease-induced changes in activity in the cortex (Fig. 4A). In the medulla (Fig. 4B), a trending increase in MALAT-1 ASO activity was observed in the AD HI group (∼70% decrease in Malat-1 RNA) compared with the CD and AD MID groups (∼50% decrease in Malat-1 RNA). Expression of a PTC marker, megalin, and a marker of the principal cells of the collecting duct, aquaporin 2, demonstrated the enrichment of the desired suborgan tissue analyzed (Fig. 4C, D).
We next performed a duration-of-action study to examine how long the MALAT-1 ASO-mediated reduction in Malat-1 RNA was sustained and if renal fibrosis modified the PK/PD properties of the MALAT-1 ASO over time. The results shown in Fig. 5A, B demonstrate that a single dose of 30 mg/kg of the MALAT-1 ASO can provide durable, sustained reductions of target RNA expression in both liver and kidney. In the liver, regardless of the degree of renal dysfunction, reductions in Malat-1 RNA were greater than 95% 3 days post-MALAT-1ASO injection and still suppressed by 90% 4 weeks later. In the kidney, mice fed the CD displayed a 75% reduction in Malat-1 RNA 3 days postdose, whereas a month after the administration of MALAT-1 ASO, mean target reduction was 67%. Mice fed with AD-induced CKD displayed ∼50% knockdown of Malat-1 RNA expression 3 days post-MALAT-1 ASO administration, and this activity was maintained 4 weeks after treatment (Fig. 5B). Note that data in Fig. 3 are normalized to the PBS group of each disease state; thus, the decrease in MALAT-1 ASO activity as compared with Fig. 3 is reflective of disease-related reduction in Malat-1 RNA expression in the diseased AD MID and AD HI PBS groups. Mice with compromised renal function displayed higher levels of hepatic MALAT-1 ASO concentration over the 4 weeks of the study period (Fig. 4C). The liver MALAT-1 ASO concentration 3 days after MALAT-1 ASO injection was significantly increased in the AD MID and AD HI groups and mice with compromised renal function displayed an ∼two-fold increase versus control for the remainder of the study. In the kidney, the concentration of ASO was similar between the control and AD groups and no significant trends could be established (Fig. 5D).

Malat-1 RNA expression and tissue ASO accumulation were determined for liver (
Next, we assessed the effect of AAI-AKI on MALAT-1 ASO PK/PD. AAI AKI was induced with three daily IP injections of 3 mg/kg AAI; one-week later MALAT-1 ASO was administered at 90, 30, 10 mg/kg and necropsy was performed 72 h later. AAI administration led to a large increase in plasma creatinine and BUN, compared with the AD CKD model, without affecting plasma transaminase levels (Supplementary Table S4). A corresponding increase in renal Kim1 and Ngal mRNA expression was also observed following AAI injection that was greater than observed in the AD CKD model (Supplementary Table S2). Renal MALAT-1 ASO activity was significantly reduced at doses of 30 and 10 mg/kg and trended toward reduction at 90 mg/kg ASO in the animals with AKI; whereas hepatic activity was only reduced at lowest dose (Fig. 6A, B). Both renal and hepatic ASO tissue accumulation was significantly increased in animals administered 90 or 30 mg/kg with AAI AKI, although to a lesser extent than was observed with AD CKD. (Fig. 6C, D). Additionally, as observed in the kidney of mice with AD CKD, a shift toward increased medullary MALAT-1 ASO distribution was also apparent in animals with AAI AKI (Supplementary Fig. S1).

Malat-1 RNA expression and ASO accumulation in liver
Discussion
The results of our studies comparing MALAT-1 ASO PK/PD in healthy and diseased kidneys indicated that 2′-MOE ASO activity in the whole kidney is preserved in the context of adenine diet-induced CKD and that reduction in target mRNA can be sustained for up to 4 weeks postdose, whereas ASO activity is reduced in AAI AKI. Furthermore, kidney injury led to a marked increase in medullary ASO accumulation, by ASO IHC, in both acute and chronic disease models and an increase in medullary ASO activity in AD CKD. Additionally, the concentration of ASO in liver of mice with CKD or AKI was increased, indicating a reduction in renal function and ASO excretion can potentially alter the systemic distribution of ASOs to other peripheral organs. Finally, single administration of the MALAT-1 ASO at doses of up to 90 mg/kg did not exacerbate the pathology in either the AD CKD or AAI AKI disease models.
Using our model of AD-induced renal inflammation and fibrosis, we demonstrated that ASO activity is preserved in mice with moderate-to-high renal dysfunction. In contrast, the severe loss of renal function observed in the AAI AKI model had a negative impact on ASO activity, particularly at the lowest doses of ASO. With such a high level of renal dysfunction, one might anticipate a reduced accumulation of ASO in the AAI AKI kidneys, but that was not the case. As was observed in the AD MID and AD HI groups, there was an increase in renal ASO accumulation. This suggests the route(s) of ASO uptake and accumulation in the AAI AKI kidneys is distinct from the route(s) in the healthy kidney and that different levels or forms of kidney disease may impact the renal PK/PD relationship.
Interestingly, while reductions in Malat-1 RNA in the whole kidney, of AD MID and AD HI animals, were comparable to reductions in animals on CD, mice with the AD-induced renal inflammation and fibrosis displayed differences in ASO accumulation in the cortex and medulla. As shown in Fig. 1, ASO deposition, determined by ASO IHC, was limited in regions of the cortex of most affected by the AD. This decrease in ASO delivery to the diseased regions of the cortex was further confirmed by a lack of reduction in Malat-1 RNA determined by ISH. If these results are extended to the clinic, it may indicate that opportunities for treating fibrotic regions of the renal cortex maybe limited. Conversely, mice in the AD groups exhibited an increase in ASO accumulation in the medulla. Subjectively, although a similar change in medullary ASO accumulation occurred in AAI AKI kidneys, the extent was not as great as in the AD model. Subsequent qRT-PCR analysis of medullary samples collected by LCM, confirmed by the increased delivery of ASO, led to greater reductions in medullary Malat-1 RNA. This alteration in ASO distribution in the diseased kidney presents important opportunities for drug discovery as well as potential safety concerns. Targeting these regions in the diseased kidney could enable the development of antisense drugs for the treatment of medullary cystic or urolithic diseases. Additionally, the medulla is primarily comprised of the loop of Henle and collecting ducts, regions of the kidney that play a critical role in water and electrolyte balance. Effective ASO targeting within these regions could also provide opportunities in treating the hyponatremia associated with heart failure. Conversely, given the potential to reduce targets expressed in the medulla of subjects with CKD, both the gene of interest and patient population must be carefully considered when using ASOs for treating extrarenal disorders in the clinic.
The underlying mechanism of altered ASO distribution in the compromised kidney is unclear, but may in part, be due to changes in the GFR and/or the cortical inflammation and fibrosis observed in mice fed the AD. In the healthy kidney, the greater accumulation of ASO in the PCT is assumed to be due to increased receptor-mediated uptake of protein associated with ASO from glomerular filtration. Our pilot studies, optimizing the AD model, demonstrated that increases in plasma creatinine and BUN were associated with reductions in GFR evaluated by measuring the clearance of FITC-inulin over time (data not shown). It is possible that the reduced GFR might allow more ASO in blood to bypass glomeruli, enhancing delivery to the arterioles and capillary beds that perfuse the medulla, where the ASO could then be taken up from the basolateral side of the nephron. Additionally, the inflammation and tubular damage observed in mice fed the AD could also limit the normal receptor-mediated clearance of ASO into this region of the nephron. Thus, reduction of ASO uptake in the cortex could allow for more ASO to be delivered to distal luminal sites of the nephron.
The results from our studies indicate that a reduction in renal function can potentially alter the systemic pharmacokinetic properties of ASOs. In the dose–response and duration-of-action studies in the AD CKD model as well as AAI-AKI model, the hepatic accumulation of ASO was greater in mice with compromised renal function. At dose levels greater than 25 mg/kg, in mice, the ASO-binding capacity of plasma proteins is exceeded and unbound ASO is eliminated in the urine [2]. With reduced filtration, due to renal injury, we hypothesize, excess ASO, above the plasma protein-binding capacity, recirculates and can be taken up by the liver and other tissues. This effect was most pronounced in the 90 mg/kg groups, but also present to a lesser extent at 30 mg/kg across both models. Based on clinical experience and the allometric scaling of dose predictions from mouse to human, 30 mg/kg in the mouse represents a dose level in humans (∼2 g) that is much higher than clinically relevant doses of 2′-MOE ASOs (≤0.3 g in Phase III and open-label extension studies) [2,15]. Nevertheless, these results raise important considerations for the clinical application of ASOs in patients with concurrent kidney disease, where potentially enhanced liver ASO distribution could represent a safety concern. Additionally, a more comprehensive evaluation of ASO accumulation in other extrarenal organs in the context of CKD will be necessary to see if other tissues are similarly affected.
The duration-of-action study demonstrated that following a single administration of ASO, sustained inhibition of target RNA for at least 2 weeks in both healthy and disease kidney, may support a monthly dosing regimen for ASOs in the clinic. These findings agree with previous studies examining the PK/PD properties of ASOs in the normal kidney. Malat-1 RNA is found at high levels in nearly all cells and has a reported RNA half-life of 9–12 h, suggesting it is constitutively expressed, thus the reduced level of Malat-1 RNA expression is likely due to continuous ASO activity [16].
An important observation from our study was that administration of MALAT-1 ASO to mice with AD CKD or AAI AKI did not exacerbate the chemically induced renal dysfunction. We did not observe any evidence of increased renal impairment, even at the highest dose of 90 mg/kg, which would have manifested in increases in plasma creatinine and BUN, as well as, a greater induction of Kim1 and Ngal mRNA expression in the kidney. A recent report analyzed the effect of 11 unique 2′-MOE antisense therapeutics in Phase 2 and 3 clinical trials and found no statistically significant difference in adverse renal events in ASO-treated versus placebo-treated patients, including a very limited number of patients with preexisting renal dysfunction [15]. There have been adverse renal events reported in patients with transthyretin amyloidosis treated with the 2′-MOE antisense drug, inotersen, but a complete understanding of the interaction between the 2′-MOE ASO and the underlying renal pathology of the affected patients remains unclear [17]. As a greater number of people, at risk for renal disease or with renal comorbidities, are treated with ASOs, it will be important to monitor renal profiles in these populations.
In conclusion, we have shown that, at the whole organ level, renal activity of 2′-MOE ASO s is maintained in mice with preexisting renal insufficiency and that the duration of action of an 2′-MOE ASO appears unaffected by concurrent kidney disease. Analysis of the renal subtopography and hepatic distribution of parentally administered 2′-MOE ASO demonstrated greater medullary 2′-MOE ASO accumulation and activity and an increased concentration of 2′-MOE ASO was observed in the livers of mice with renal disease. These observations suggest both challenges and opportunities that should be considered in the development of antisense therapeutics for the treatment of patients with established or at risk for kidney dysfunction.
Footnotes
Author Disclosure Statement
All authors are employees of Ionis Pharmaceuticals, Inc.
References
Supplementary Material
Please find the following supplemental material available below.
For Open Access articles published under a Creative Commons License, all supplemental material carries the same license as the article it is associated with.
For non-Open Access articles published, all supplemental material carries a non-exclusive license, and permission requests for re-use of supplemental material or any part of supplemental material shall be sent directly to the copyright owner as specified in the copyright notice associated with the article.
