
Abstract
Locked nucleic acid-modified antisense oligonucleotides (ASOs) can achieve strongly different degrees of target knockdown despite having similar biophysical properties and 100% homology with their target. The determinants for this observation remain largely unknown. We used multi-specific ASOs that have 100% sequence complementarity with a common target (IDO1) and a different number of diverse targets and investigated their effect on gene expression in a cell line by RNA-sequencing. We observed a significant higher chance for downregulation of long genes compared to short genes, of genes with high compared to lower expression, and of genes that have more than one binding site for the respective ASO. By investigating the expression of genes that have binding sites for more than one ASO we identified the individual binding site being an important determinant for activity. Under the selected experimental conditions we have not seen indications that availability of RNase H is a limiting factor as the number of degraded target RNA molecules correlated significantly with the number of predicted target RNA molecules. Taken together, by using multi-specific ASOs as tool compounds we identified determinants for ASO activity that can be taken into consideration to improve the selection process of highly potent and selective ASOs in the future.
Introduction
Antisense oligonucleotides (ASOs) are an emerging therapeutic modality with several approved drugs [1–8] and further ASOs within advanced stages of development [9–11]. Although the general approach of designing ASOs is fully rational, guided by Watson-Crick complementarity of the ASO to its target RNA, individual ASOs have a large range of target-knockdown efficacies necessitating extensive screens of numerous compounds until candidates with optimal properties are identified. Comprehensive knowledge of the different factors that affect activity of ASOs is expected to result in a more efficient selection process concomitant with considerable cost and time savings. Several factors that affect the activity of RNase H-dependent ASOs have been postulated. Roughly these factors can be subdivided into different categories:
ASO-intrinsic factors such as the tendency of the ASO to form secondary structures or dimers most probably modulate activity.
The effect of target affinity is impressively demonstrated by the emergence of high-affinity chemical modifications such as constrained ethyl (cET) and locked nucleic acid (LNA) modifications that have led to a quantum leap in ASO activity [12–14].
In addition, activity is also dependent on the target RNA; their targetability by ASOs in general and the accessibility of a specific ASO binding site due to protein binding or secondary structure [15,16].
Furthermore, interactions between the ASO and host cell factors are important for cellular uptake and intracellular trafficking to the target site [17–19].
Finally, the sequence of the ASO—RNA duplex also determines the efficiency of RNase H to cleave the target RNA [20].
In a classical screen, a target RNA is selected and many different ASOs are designed typically having different binding sites on the target RNA, different secondary structures and affinities, different protein binding characteristics, and different capabilities to engage RNase H.
In this setting the target RNA is the only common denominator and the contribution of the other factors on ASO activity cannot be evaluated.
To allow a more isolated evaluation, we have designed ASOs targeting many different genes. In particular we have designed groups of LNA-modified gapmers with 100% sequence complementarity to ∼100, 500, or 2,500 human genes. In total 51 ASOs were designed and tested. As common target, they all were directed against the pre-mRNA of indoleamine 2,3-dioxygenase 1 (IDO1). For each individual ASO, differential activity on the different targets must stem from target RNA-dependent factors such as the general targetability of the RNA or the accessibility of the specific binding site since factors such as secondary structure of the ASO, cellular uptake, transport, and RNase H sequence preferences are the same for each target.
ASOs were tested in the ovarian cancer cell line EFO-21 by gymnosis. QuantiGene Singleplex analysis and RNA-sequencing were used for determination of the effects of ASOs on gene expression.
Materials and Methods
Antisense oligonucleotides
Oligofyer™ an in-house implemented pipeline, normally used to design sequence-specific ASOs as potential drug candidates was adapted for the purpose of this study. Besides the sequence complementarity to IDO1, ASOs were designed to target multiple further genes. In the following, they are called multi-specific ASOs. All ASOs were designed as gapmers with a length of 17 nucleotides, with a fully phosphorothioated backbone and 3 LNAs in each flank. Our in-house criteria predicting activity were fulfilled by all ASOs that were ordered at Microsynth and dissolved in H2O (stock concentration: 1 mM). Sequence of selected ASOs is shown in Supplementary Table S1.
Treatment of EFO-21 cells with ASOs
EFO-21 cells (DSMZ) were seeded in 96-well flat bottom plates (5,000 cells per well) or 24-well plates (50,000 cells per well) in Dulbecco's modified Eagle's medium (DMEM) with antimycotic-antibiotic (1%), sodium pyruvate (1%), and heat-inactivated fetal bovine serum (10%). Cells were treated with the indicated ASO at a final concentration of 5 μM for 3 days without the use of a transfection reagent.
RNA isolation
RNA was isolated from EFO-21 cells using the RNeasy Plus Mini Kit (Qiagen). In brief, cells were lysed in 350 μL RLT plus buffer (containing 3.5 μL beta-mercaptoethanol) per well of a 24-well plate. Genomic DNA was depleted on gDNA Eliminator Spin Columns and RNA was isolated according to the manufacturer's instructions.
QuantiGene mRNA expression analysis
IDO1 mRNA expression was analyzed in cell lysates or in isolated RNA using the QuantiGene Singleplex Assay (Thermo Fisher Scientific). The following probe sets were used: human IDO1 (SA-12156).
Sample preparation for RNA-seq
The sample preparation was performed according to the protocol “NEBNext Ultra II Directional RNA Library Prep Kit for Illumina” (NEB# E7760S/L). Briefly, rRNA was depleted from total RNA using the rRNA depletion kit (NEB# E6310). After fragmentation of the rRNA reduced RNA, a cDNA synthesis was performed. This was used for ligation with the sequencing adapters and PCR amplification of the resulting product. All samples had an RNA integrity number above 9.7 and showed normal migration profiles on a bioanalyzer chip (RNA 6000Nano labchip kit, Agilent). The size of the resulting products was consistent with the expected size distribution (a broad peak between 300 and 500 bp).
Clustering and DNA sequencing using the NovaSeq6000 was performed according to manufacturer's protocols. A concentration of 1.1 nM of DNA was used. The RNA-sequencing experiments were performed at GenomeScan B.V., Plesmanlaan 1d, 2333 BZ, Leiden.
Primary data analysis and results
Image analysis, base calling, and quality check was performed with the Illumina data analysis pipeline RTA3.4.4 and Bcl2fastq v2.20. At least 40.5 Mio clusters were obtained per sample at a quality score % ≥ Q30 of at least 91.5. All fastq-files were investigated using fastQC (www.bioinformatics.babraham.ac.uk/projects/fastqc/) before and after trimming. Version 0.39 of trimmomatic [21] was used to filter low quality reads, cut TruSeq adapter sequences. STAR (version 2.7) [22] was used to align the reads to the reference sequence from GENCODE (gencode.v34.primary_assembly) [23].
RNA-seq data analysis—differential gene expression
For transcriptome-wide differential gene expression analysis, data were read in R [24]. To calculate and visualize the principal component analysis (PCA), the specific DESeq2 [25] function plotPCA was used in combination with ggplot2 [26]. To reduce the size of the dataset and improve downstream analysis all genes that did not have a raw count of at least five in at least four samples were filtered out before (n = 23,446 remaining) and after the initial PCA (n = 23,323 remaining).
As it is not clear which degree of target knockdown is needed to achieve a biological effect, we focused only on the statistical significance and regarded genes as significantly differentially expressed if an adjusted P value below 0.05, as calculated using standard settings of DESeq2 [25], was observed. The independent filtering performed within DESeq2 by default identifies genes containing count outliers or low normalized counts for all samples and no adjusted P value is assigned to those genes. Thus, in general low expressed genes were not counted as significant.
To assess the gene length and the location of the ASO binding site within the pre-mRNA of a gene only its longest transcript was used.
Statistical analysis
Significance of correlation of different observations was tested using Spearman's correlation analysis. To assess the relationship between variables possibly influencing the activity of ASOs a chi-square test of independence was applied. To keep the number of tests low, only selected cases, in general the extremes, were compared. In this explorative study only in case of the pure RNA-seq results a correction for multiple testing was applied.
Results
Investigation of IDO1 knockdown efficacy of multi-specific ASOs in EFO-21 cells
Fifty-one LNA-modified Gapmers (Supplementary Table S1) with 100% homology to IDO1 and different numbers of additional targets were investigated with regard to their IDO1 knockdown efficacy (as measured by residual IDO1 mRNA expression when compared to mock-treated cells) in EFO-21 cells (screening experiment). Therefore, EFO-21 cells were treated for 3 days with 5 μM of the respective ASO and IDO1 mRNA expression was investigated by QuantiGene Singleplex assay. As shown in Fig. 1A, we observed an over 90% knockdown of IDO1 by selected ASOs from all three different groups and no correlation (Spearman r = 0.06, P = 0.68) between the mean IDO1 knockdown efficacy and the number of genes with 100% homology (Fig. 1B).
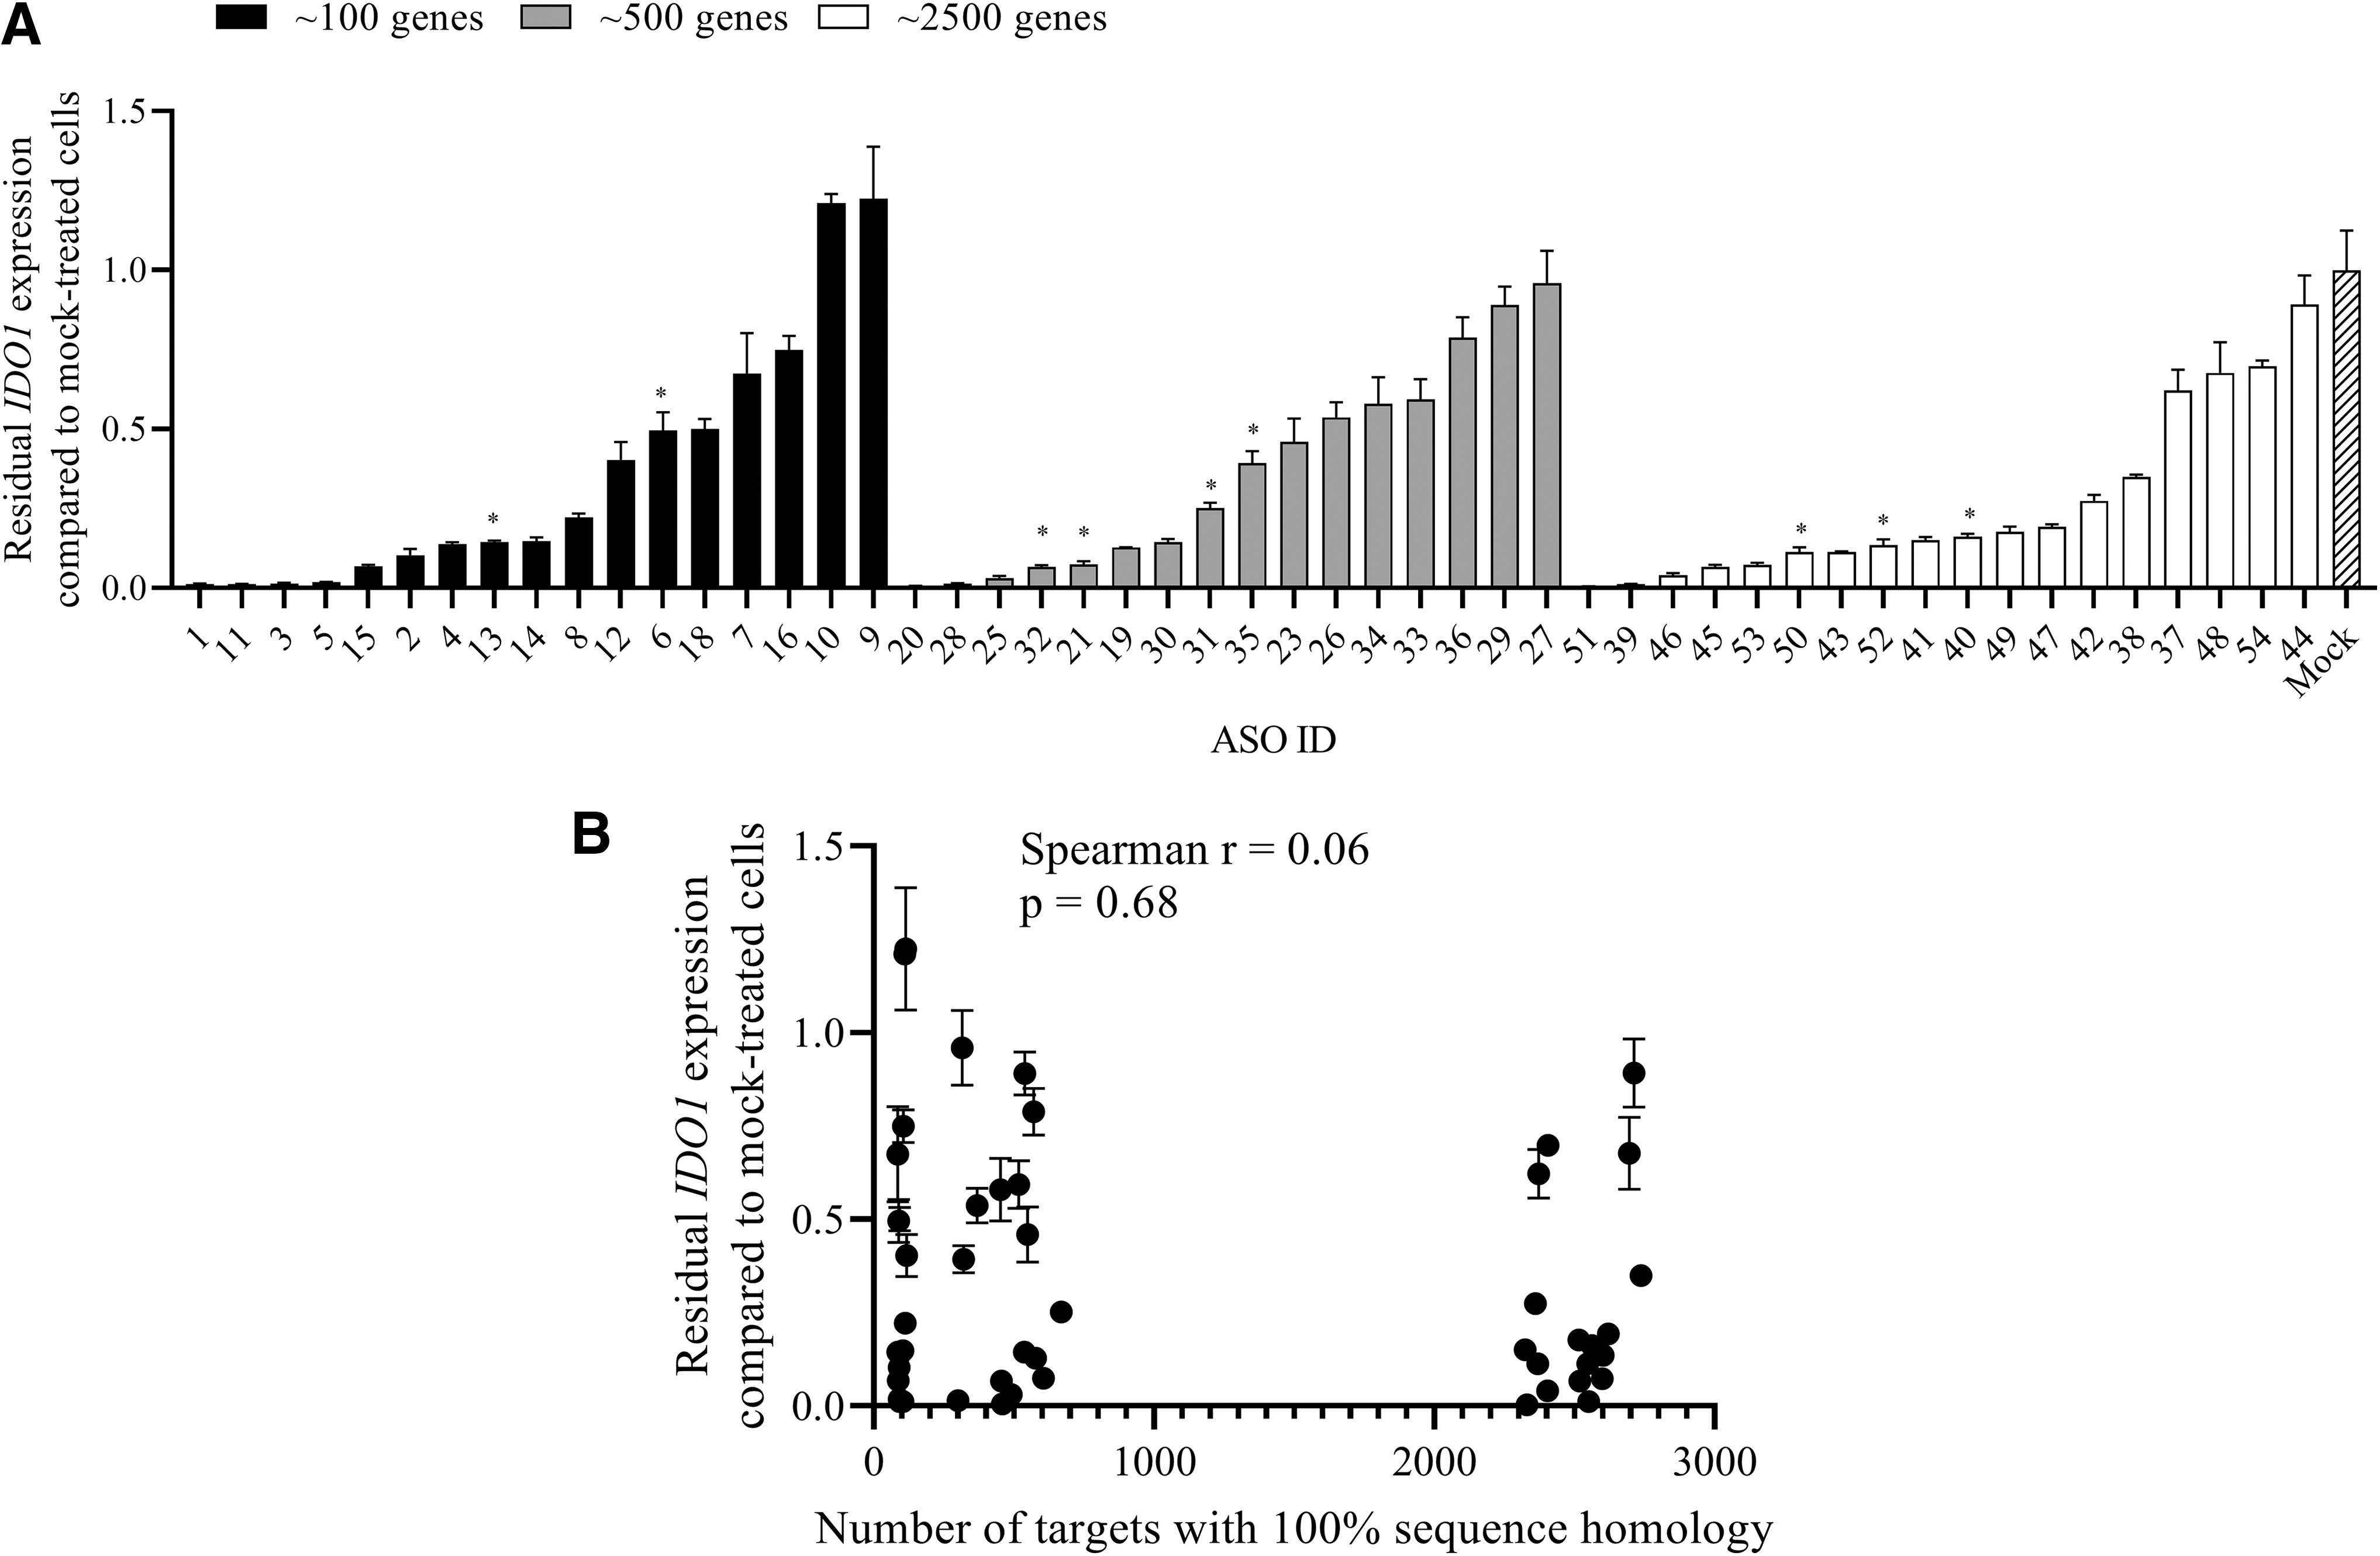
Investigation of IDO1 knockdown by multi-specific ASOs in EFO-21 cells. EFO-21 cells were treated with the indicated ASO at a concentration of 5 μM for 3 days in a 96-well plate. IDO1 mRNA expression was determined by QuantiGene Singleplex RNA assay.
We selected nine ASOs with different degrees of activity but with a knockdown efficacy of at least 50% for further investigation of target activity by RNA-sequencing (selected ASOs are marked by an asterix in Fig. 1A).
Gene expression analysis by RNA-seq in EFO-21 cells treated with multi-specific ASOs
We treated EFO-21 cells with the multi-specific ASOs 6, 13, 21, 31, 32, 35, 40, 50, and 52 for 3 days at a final concentration of 5 μM and performed gene expression analysis by RNA-sequencing. Twenty three thousand three hundred twenty-three genes passed all quality control and filtering steps and thus were tested for differential gene expression. An initial PCA using the 3,000 most variable genes showed two separated samples that were excluded from further analysis (Supplementary Fig. S1A). The following PCA without these samples nicely showed that the triplicates cluster together as expected (Supplementary Fig. S1B).
We first compared the expression of IDO1 from the screening experiment (as shown in Fig. 1) and the expression of IDO1 as determined by RNA-sequencing. As shown in Fig. 2, we observed a significant correlation (spearman r = 0.98, P < 0.0001) of IDO1 expression in the two experiments strengthening the reproducibility of our initial observations and also directly validating the quality of the RNA-seq data.

Correlation of IDO1 expression in the screening experiment and the RNA-seq experiment. EFO-21 cells were treated with selected ASOs from the different groups at a final concentration of 5 μM in 24-well plates for 3 days. RNA was isolated and gene expression was analyzed by RNA-seq. Residual IDO1 expression relative to mock-treated cells (set as 1) was calculated. The mean of three technical replicates ± SD is shown. Correlation of residual IDO1 expression in the screening experiment compared to expression in the RNA-seq experiment was tested using Spearman's correlation.
Investigation of the impact of ASO and target gene intrinsic factors on target downregulation
We furthermore analyzed the RNA-seq data with regard to downregulation of predicted genes that have binding sites with a homology of 100% to the respective ASO. As shown in Fig. 3A and Supplementary Table S2 and Supplementary Fig. S2, treatment of EFO-21 cells with all nine tested ASOs resulted in significant downregulation of a certain percentage of predicted genes. We observed considerable differences in the capacities between ASOs to suppress their predicted targets (Fig. 3A and Supplementary Tables S3–S11). ASO 6 was the ASO with the lowest overall activity significantly suppressing only 18% of its targets, while ASO 35 had the highest overall activity, suppressing nearly 2.5-fold more (44%). There was no obvious dependence of the overall activity from the number of targets.
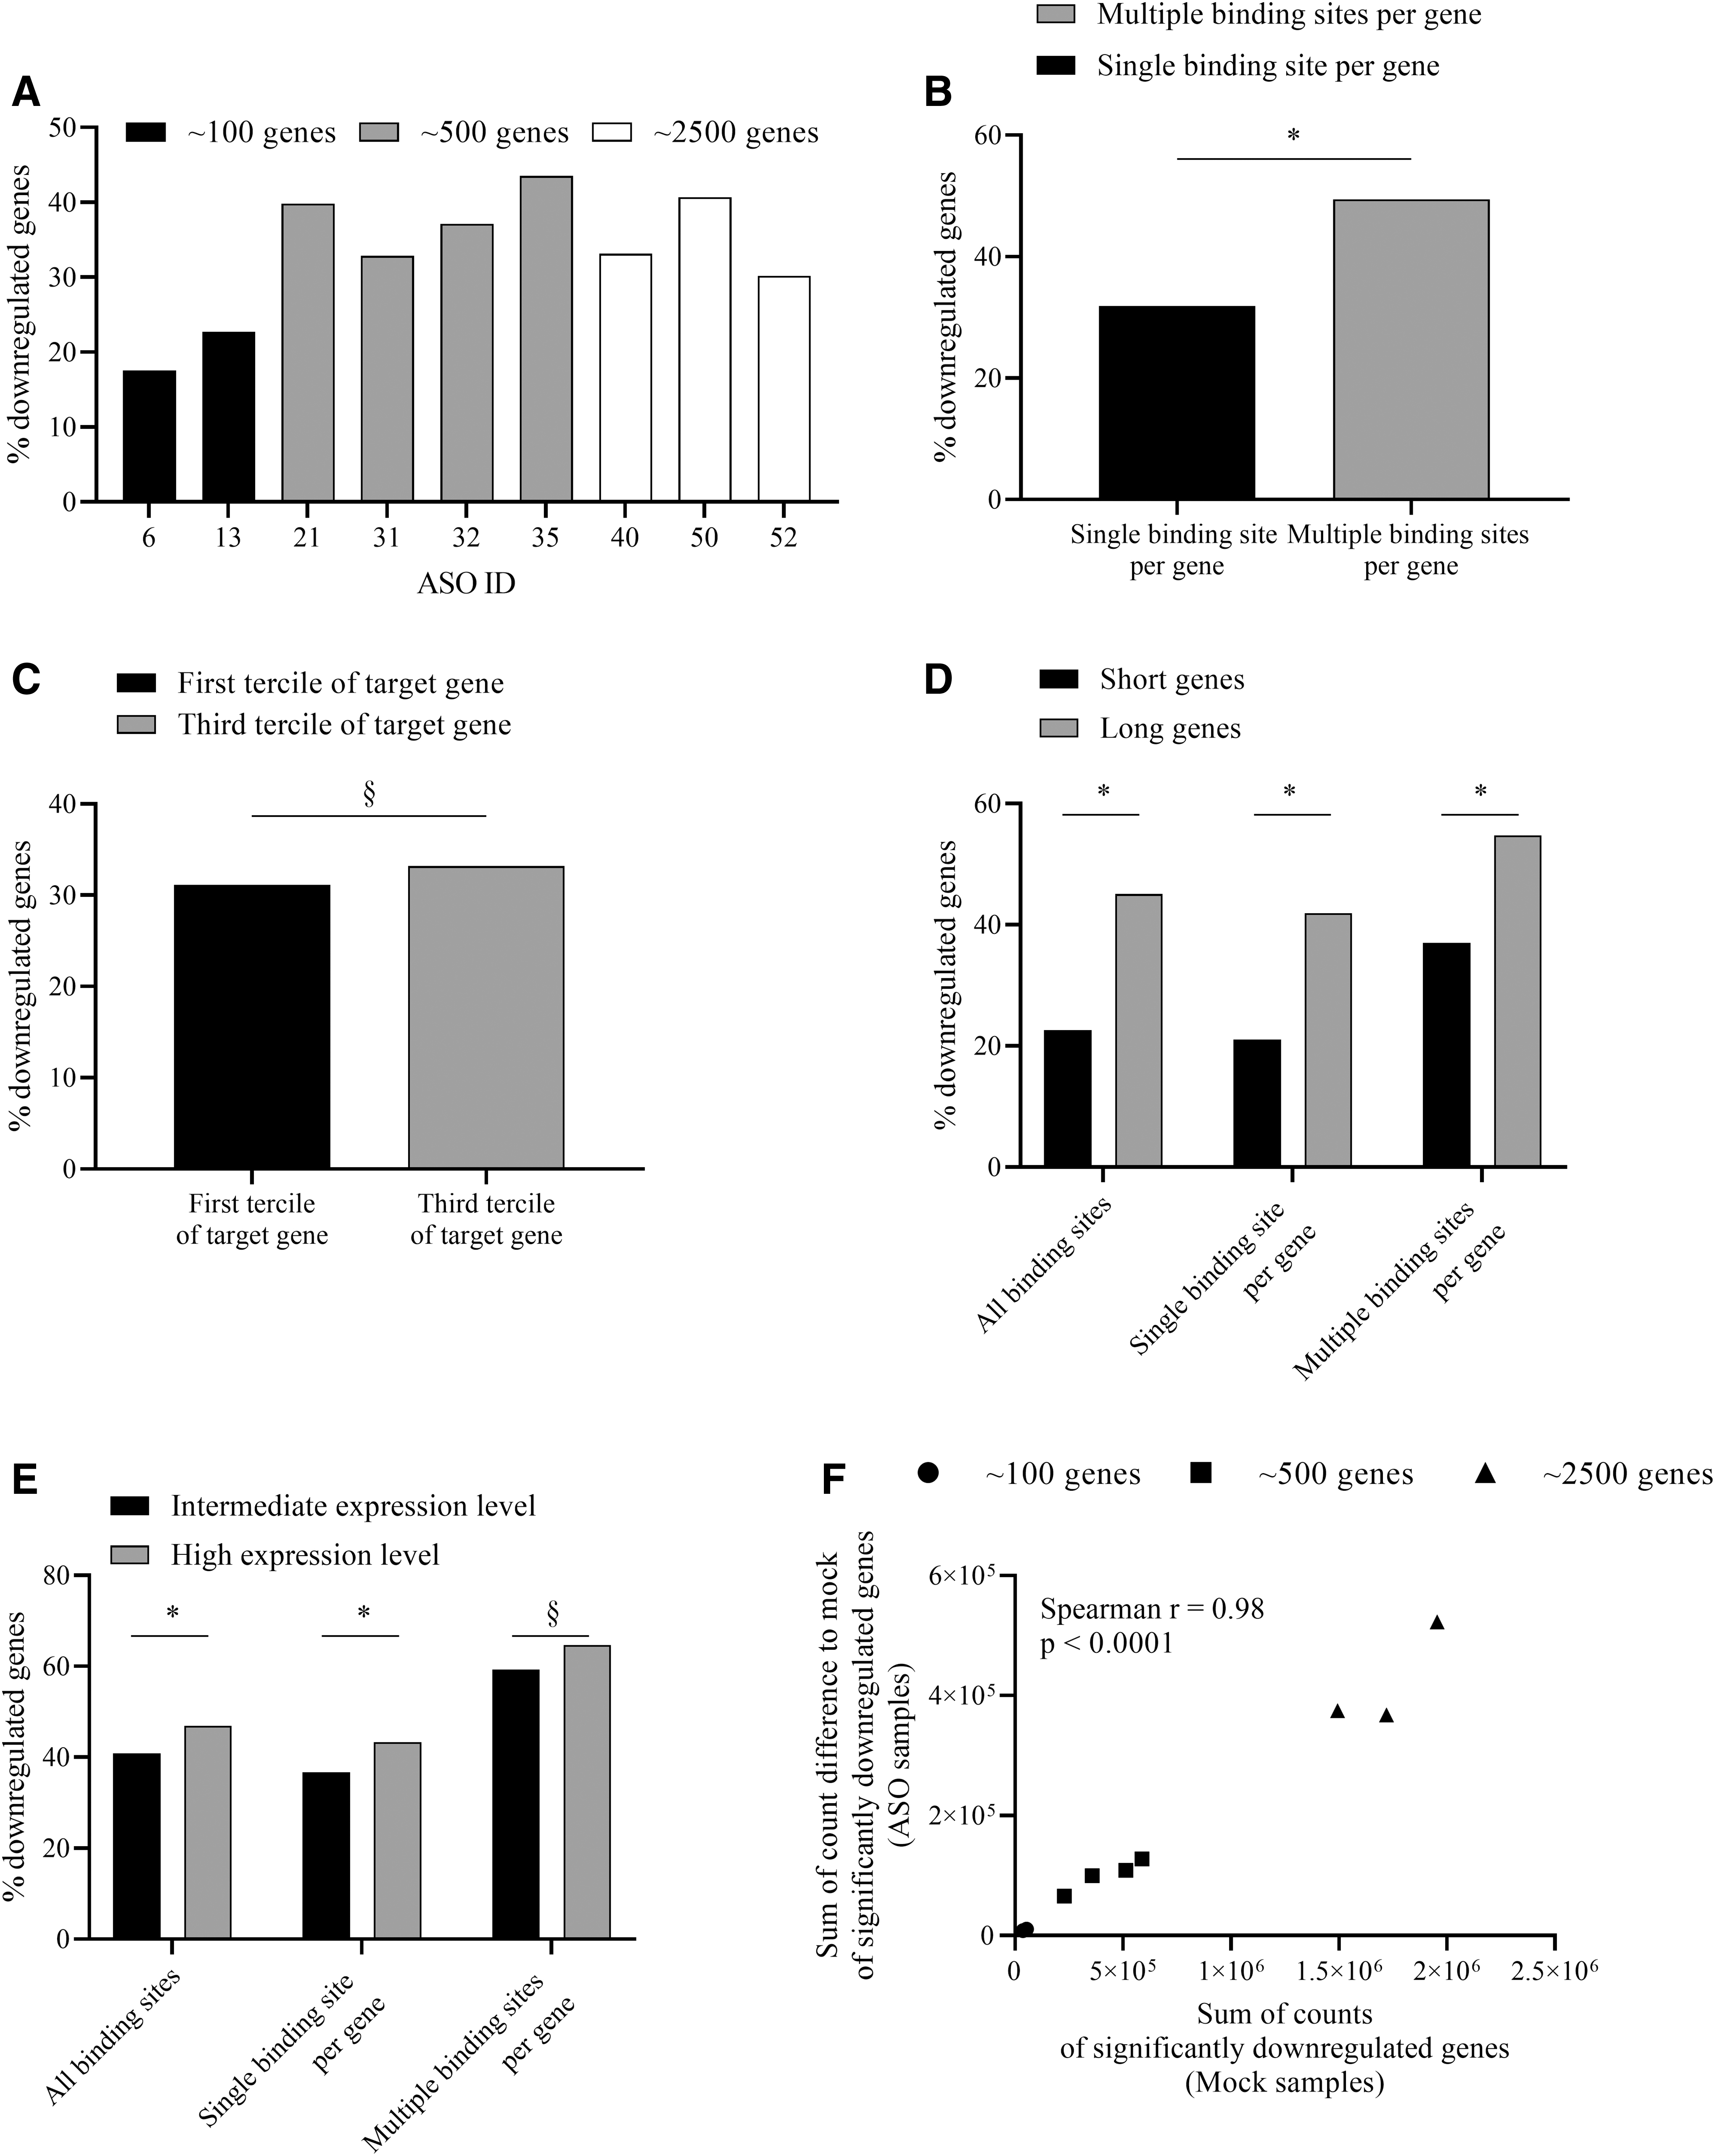
Detailed investigation of the impact of the ASO, the ASO binding site on the target gene, and the length and expression of the target gene on downregulation.
Many of the target genes contained more than one binding site for a specific ASO. The percentage of downregulated genes strongly depended on the number of binding sites of the respective ASO per gene (Fig. 3B). The percentage of downregulated genes was significantly lower (Supplementary Table S12) if the genes contained only one binding site when compared to genes with two or more (Supplementary Table S13) binding sites (32% vs. 49%).
To investigate, whether the degree of target knockdown has an impact on our observation, we divided the genes into terciles according to the degree of their knockdown. Details are given in Supplementary Table S14 but the absolute number of genes showing a high (>66%) degree of knockdown is limited. As shown in Supplementary Fig. S3A and Supplementary Table S12 genes of every tercile were similarly affected.
We furthermore sought to explore, if the position of the ASO-binding site in an intron or an exon of the pre-mRNA had an influence on the likelihood of target knockdown. Therefore, we took all ASOs into account and analyzed their binding regions on pre-mRNAs with a single ASO binding site. Surprisingly, there was only one single binding site of an ASO that was positioned in an exonic region compared to 6,704 binding sites in intronic regions and thus we could not conduct this analysis.
In a further approach to investigate whether the location of the binding site on the pre-mRNA has an influence we divided each gene into three parts (terciles) based on its sequence length. As shown in Fig. 3C and Supplementary Table S15, the number of downregulated genes was not significantly different if the binding site was positioned in the first tercile versus the third tercile of the respective target gene. The same holds true when the degree of target knockdown was taken into account (Supplementary Fig. S3B and Supplementary Table S15). In line with this finding, we have also not observed a dependency of the position of the ASO binding site on the IDO1 gene and the activity of the respective ASO with regard to IDO1 downregulation (Supplementary Fig. S4).
We further investigated whether the length of a gene has an influence on the chance of being downregulated. Therefore, the dataset was again divided into terciles, here based on the lengths of the genes (pre-mRNA), that were targeted by any of the nine ASOs. The classification into short genes (mean length of 28,689 base pairs), intermediate genes (mean length of 81,421 base pairs), and long genes (mean length of 382,160 base pairs) is shown in more detail in Supplementary Table S16. As depicted in Fig. 3D, we observed a significantly higher (Supplementary Table S17) number of downregulated long genes when compared to short genes. This was independent from the number of binding sites per target gene. The same holds true when the degree of target knockdown was taken into account (although not significant for a target knockdown efficacy >66%) (Supplementary Fig. S5A and Supplementary Table S18).
We further analyzed the number of binding sites for the different degrees of target knockdown. For a knockdown efficacy of <33%, we observed a significantly higher percentage of downregulated long genes compared to short genes with a single or multiple ASO binding sites (Supplementary Fig. S5B and Supplementary Table S19). In the case of a knockdown efficacy of 33%–66%, there was a significantly higher percentage of downregulated long genes compared to short genes with a single ASO binding site and a trend to a higher number of downregulated long genes with multiple ASO binding sites (Supplementary Fig. S5C and Supplementary Table S20). For downregulated genes with an efficacy of >66%, we observed the same trend that long genes with a single ASO binding site appear to be more likely downregulated than short genes with a single binding site.
For genes with ASO binding sites this trend appears to be inverted but those results have to be interpreted with care due to the low number of genes fulfilling these criteria (Supplementary Fig. S5D and Supplementary Table S21).
We next assessed the impact of the expression level of the target gene on the chance of being downregulated by an ASO. Therefore, terciles of gene expression level were defined, namely low, intermediate, and high (Supplementary Table S22). We excluded genes with low expression from this analysis due to the high variance that we observed between sequencing replicates.
As shown in Fig. 3E, we observed a significantly higher percentage (Supplementary Table S23) of downregulated genes with a high expression compared to genes with intermediate expression when all genes (all binding sites) or genes with one binding site for the respective ASO were considered. When only genes with two or more binding sites were considered, we observed a nonsignificant trend to a higher percentage of downregulated genes with high expression compared to genes with intermediate expression. For weakly suppressed genes (<33% knockdown) we observed a significant higher percentage of downregulated genes with high expression level when compared to genes with intermediate expression level (Supplementary Fig. S5E and Supplementary Table S24).
This was true for genes with a single ASO binding site and for genes with multiple ASO binding sites (Supplementary Fig. S5F and Supplementary Table S25). For moderately to strongly suppressed genes (>33% knockdown) all genes were significantly downregulated (Supplementary Fig. S5E and Supplementary Table S24).
Investigation of the suppressive capacity of ASOs
We wanted to analyze, if the overall suppressive capacity of ASOs is limited at higher numbers of targets. Therefore, we correlated the number of predicted targets with the number of degraded target transcript molecules. We observed a significant correlation (Spearman r = 0.98, P < 0.0001) between the number of target transcript molecules in mock-treated cells [Sum of counts of significantly downregulated genes (Mock samples)] and the number of degraded target transcript molecules in the respective ASO-treated sample (Sum of count difference to mock of significantly downregulated genes) (Fig. 3F). Under the selected experimental conditions, no saturation was visible at higher target numbers.
Investigation of effects of ASOs on expression of genes having binding sites for more than one ASO
We furthermore performed a comprehensive analysis of the RNA-seq data set and investigated whether there are differences in the downregulation of genes having binding sites for more than one ASO. Table 1 shows that from in total 1,353 genes that were predicted to be targeted by two ASOs, 291 (21.51%) were significantly downregulated by both ASOs and 370 (27.35%) were downregulated by one ASO but not by the other. We made comparable observations for genes that were predicted to be targeted by three, four, and five ASOs. Only five genes were predicted to be targeted by six ASOs and none to be targeted by seven and eight ASOs.
Genes Targeted by Multiple Antisense Oligonucleotides
Number of genes that were predicted to be targeted by 2 to all 9 ASOs and were either not downregulated by all ASOs (all_NS), significantly downregulated (padj <0.05) by all ASOs (all_Sig) or by one or more but not by all ASOs (Mixed).
Per design, one gene (IDO1) was predicted to be targeted by all nine ASOs and the nine ASOs used in these analyses had been selected based on their significant suppression of IDO1.
Representative examples for the degree of downregulation of genes that are targeted by more than one ASO are shown in Fig. 4. DCLK1 was predicted to be a target of the ASOs 6, 50, and 52. ASO 6, which has overall a weaker activity when compared to ASO 50 and 52 (Fig. 3A) led to a downregulation of DCLK1 by ∼50%, whereas ASO 50 led to a downregulation of ∼30% and ASO 52 had no effect on DCLK1 mRNA expression (Fig. 4A). CUX1 was predicted to be a target of the ASOs 6, 21, 31, 40, 50, and 52 and was downregulated by all ASOs by >20% (range: 23.6%–63%).
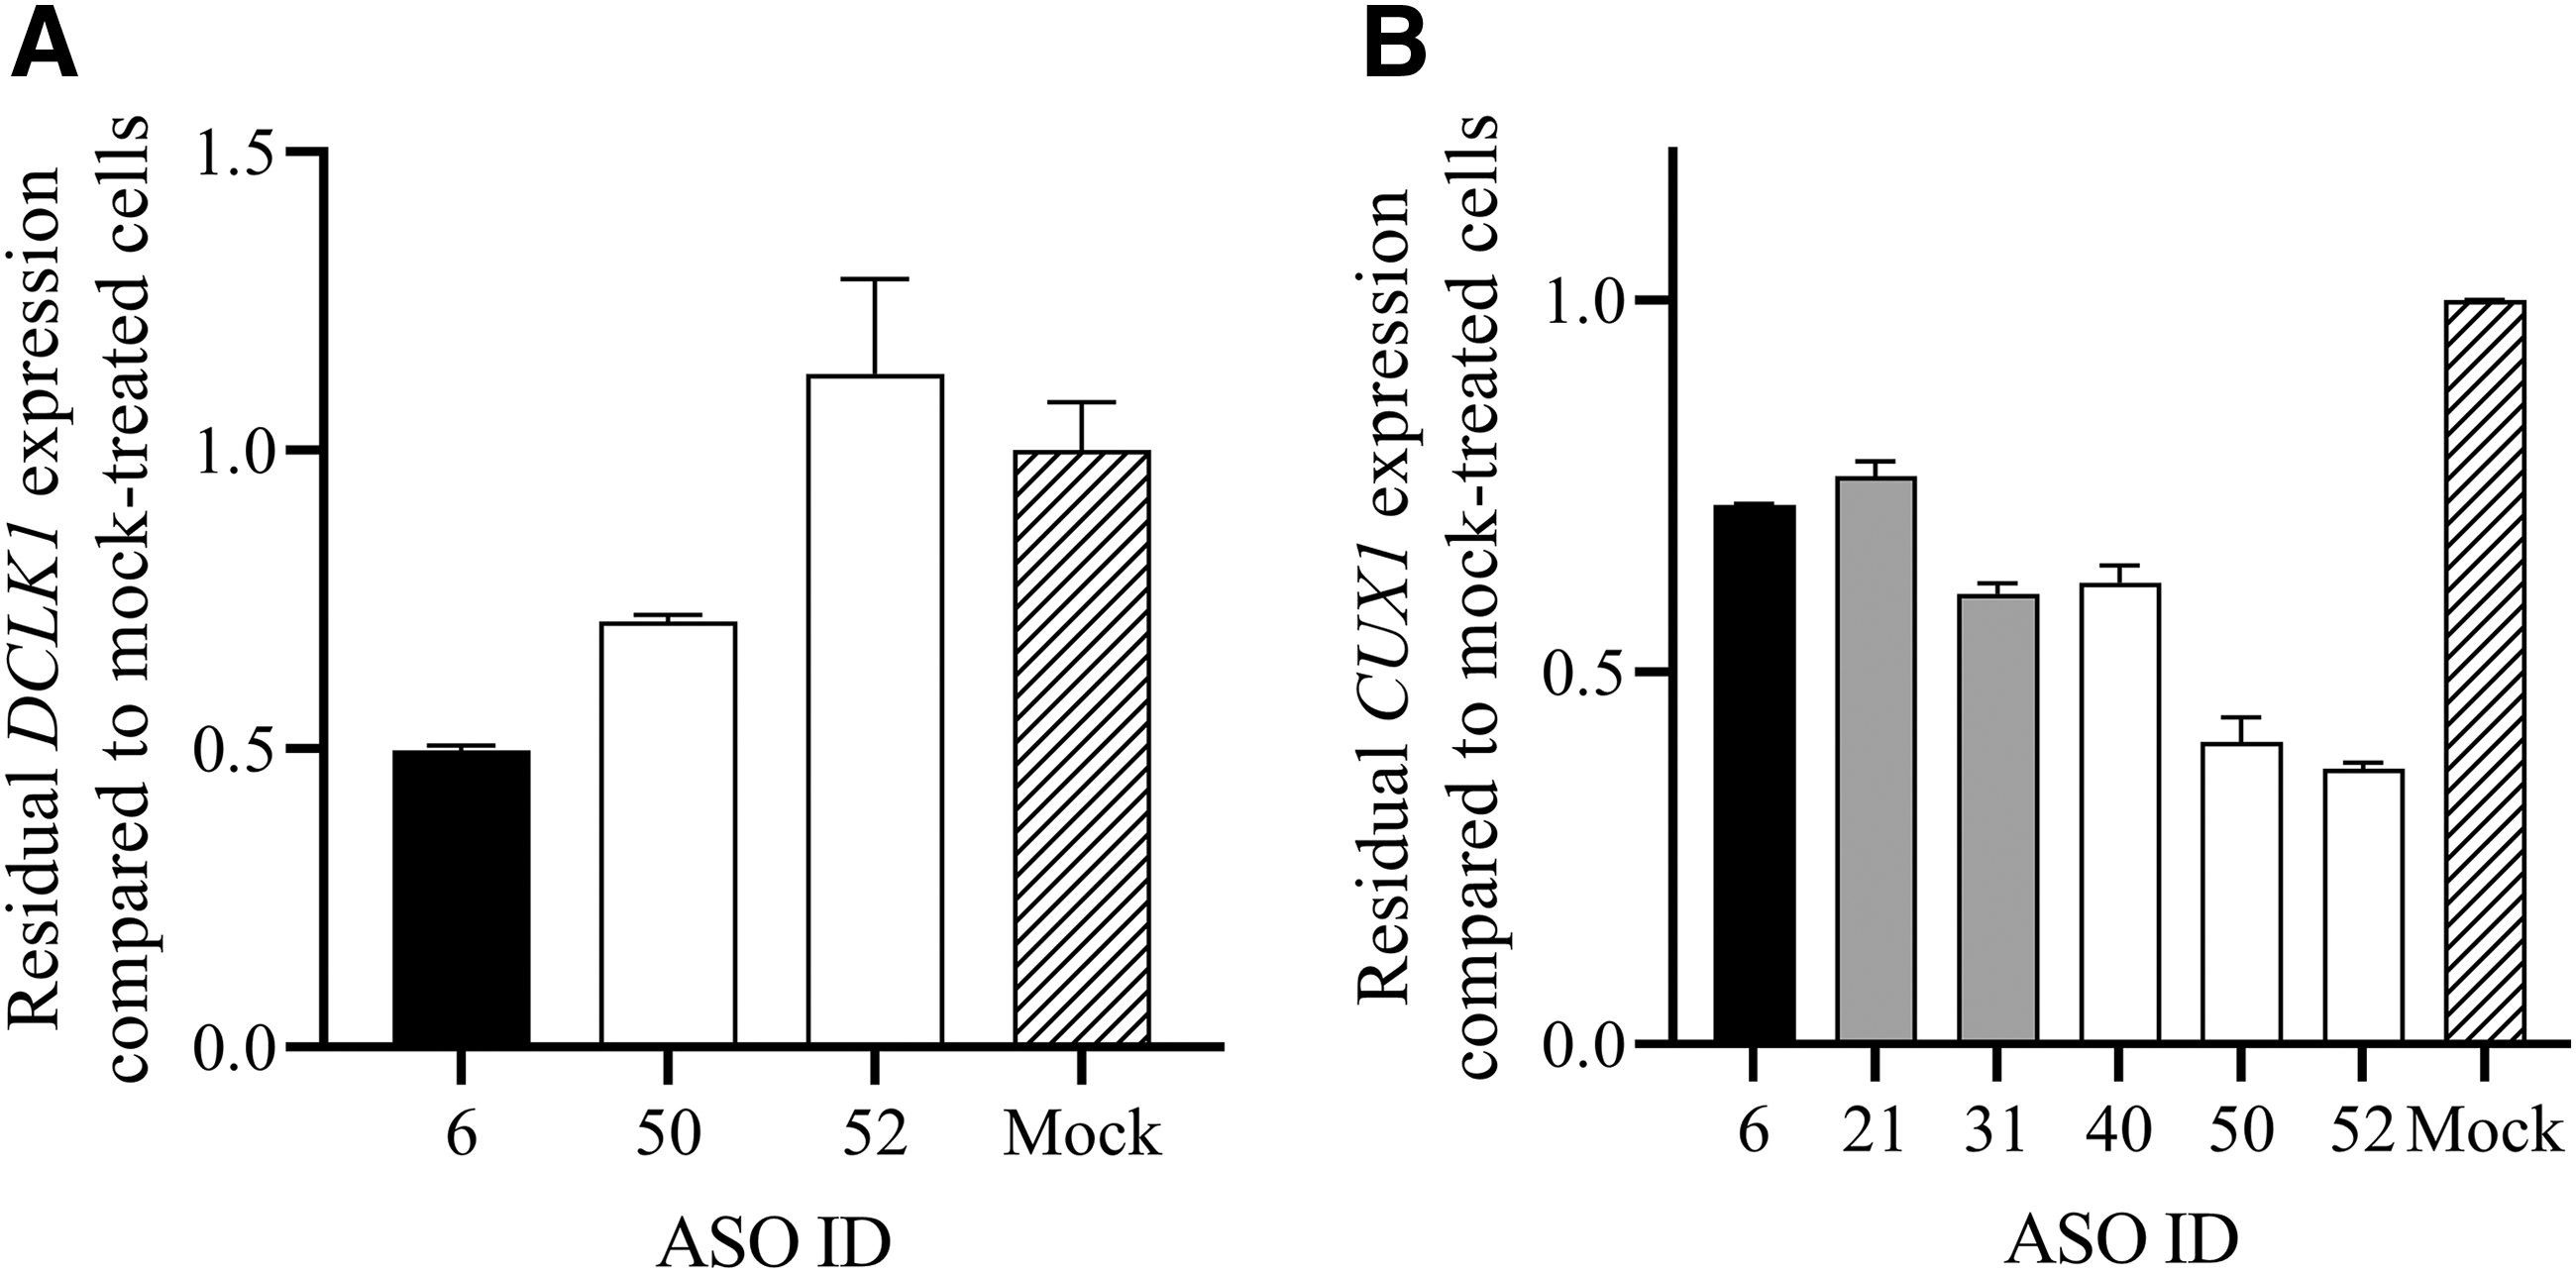
Knockdown of selected genes.
Discussion
In this study we aimed to delineate the different factors that influence activity of RNase H-dependent ASOs. Therefore, we designed and tested a set of multi-specific ASOs that have 100% sequence homology to up to 2,738 genes. They all share 100% sequence homology to the IDO1 gene. By gene expression analysis we generated a dataset that allows us to analyze several of the factors that are postulated to affect ASO activity in an isolated fashion.
Questions that we addressed: Are there ASO-specific factors that influence the overall performance of an ASO in general for all potential targets? What is the influence of features of the target RNA on ASO activity? How much do the abundance and the length of the transcript affect their targetability and how important is the ASO-binding site within the transcript?
We have tested 51 ASOs with different numbers of potential targets for knockdown of the common target IDO1. The different ASOs induced different degrees of IDO1 knockdown ranging from >90% knockdown to no activity. Interestingly, ASOs with either potent or poor activity were found in all groups as defined by the number of potential targets (Fig. 1A). There was also no correlation between the activity against IDO1 and the number of potential targets (Fig. 1B).
The differences in activity may either stem from ASO-molecule-specific features or from the accessibility of the binding site on the IDO1 pre-mRNA. To delineate between these factors we have performed RNA-seq for selected candidates with different degrees of activity to analyze activity on all potential targets. Figure 3A shows that there are also considerable differences in the overall activity of the ASOs as determined by the proportion of targets that are significantly suppressed by each individual ASO. These results suggest that ASO-specific features exist such as differential cellular uptake, transport, binding affinity to the target and ability to recruit RNase H.
However, our data also indicate that the binding site on the mRNA can play an important role for ASO activity. While we have not seen a significant difference between ASOs with binding sites on either the 5′ or 3′ portion of the transcript, we have found examples that ASOs with poor overall activity were able to induce a stronger knockdown of specific genes compared with ASOs of better overall activity targeting the same gene on a different binding site (Fig. 4A).
One observation was that genes that have more than one binding site for a specific ASO were suppressed with a significantly higher probability compared to genes with only one binding site. This observation is in agreement with Pedersen et al. [27] who have found that ASOs targeting repeated regions have higher activity compared with ASOs targeting non-repeated regions. For multiple binding sites there is a higher probability that at least one binding site has optimal accessibility, which can explain the better knockdown of genes with multiple binding sites. If possible, ASOs having multiple binding sites within a specific target should be included in screens, however for most targets it will be a challenge, identifying ASOs with multiple binding sites specific only for this target and without sequence homology to potential off targets.
Analyzing attributes of transcripts with regards to their targetability, we examined the roles of length and the expression level. Interestingly, we have found that longer transcripts have a higher probability to be significantly suppressed. Although longer transcripts have a higher chance for having multiple binding sites, this effect was also evident for transcripts having only one binding site. Currently, we do not have a mechanistic explanation for this observation.
We have also observed that more abundant transcripts were better suppressed compared with less abundant transcripts. This appears counterintuitive on first sight, especially when assuming that the number of available ASO or RNase H molecules may limit ASO efficacy, which we discuss further below.
Assuming comparable RNA half-life, higher abundant transcripts should have a higher transcription rate. If RNase H-mediated RNA degradation mostly takes place during transcription [28,29], on the nascent transcript, more potent and faster knockdown is expected for RNAs with higher transcription rate.
Besides the investigation of the relevance of ASO-specific factors and target RNA-specific factors that influence ASO efficacy, the dataset generated also allows to explore general factors that may limit ASO activity such as availability of ASO and RNase H at the correct intracellular location.
Both nuclear and cytoplasmic pathways [30,31] have been described to mediate ASO-dependent cleavage and degradation of target RNAs. However, since the vast majority of ASO-target sites of this study is located within intronic regions of pre-mRNAs, we assume an RNase H-mediated degradation of the pre-mRNA in the nucleus as the relevant mechanism within this study.
The numbers of LNA-modified ASO molecules that enter the cells and the nucleus by gymnosis/unassisted delivery and the corresponding target knockdown have been measured before [32].
In addition, controlled numbers of LNA-modified ASO molecules have been administered to cells by microinjection into the cytosol [18]. In these studies, estimations of the ratio of target RNA abundance and ASO molecules in the nucleus required for target knockdown have been made and it was discovered that for target RNAs with relatively high copy numbers the amount of LNA-modified ASO molecules required for knockdown is substantially higher than the amount of molecules of the respective target RNA [18].
By increasing the number of targets, we massively changed the ratio between target and ASO molecules compared to typical single-target approaches. To our surprise, under the selected experimental conditions, ASO uptake, transport and abundance in the nucleus at the active site and availability of RNase H do not appear to be limiting factors for simultaneous suppression of many genes.
We have seen that: (1) IDO1 could be efficiently suppressed by more than 90% by ASOs having numerous additional targets and that the knockdown did not correlate with the number of targets (Fig. 1). (2) We have shown that a high proportion of targets was simultaneously suppressed significantly independent from the number of predicted targets (Fig. 3A). (3) The suppressive capacity of an ASO did not saturate with increasing target transcript levels (Fig. 3F). This is corroborated by the observation that higher expressed genes were not suppressed less efficient, but even more efficient compared to lower expressed genes. Together, these data suggest that for the typical single-target approach RNase H levels may not limit ASO efficacy.
Taken together, we have shown that ASO-specific factors and target RNA-specific factors play important roles for ASO efficacy and that many different RNAs can be simultaneously suppressed by ASOs. Considering the high overall capacity of ASOs to suppress RNAs, there is also the need to design ASOs with a clean off-target profile to prevent abundant suppression of off-target genes.
We are aware that the findings of this study are based on experimental data generated in one cell line. However, the analysis of 9 different ASOs that target in total 5,175 different genes allowed the generation of a robust dataset. Confirmation of the findings in independent cell systems in the future will allow further investigation of their general applicability.
Footnotes
Acknowledgments
The authors thank Monika Schell, and Stefanie Raith for their excellent technical support.
Author Disclosure Statement
All authors are currently employees of Secarna Pharmaceuticals GmbH & Co. KG.
Funding Information
This research received no specific grant from any funding agency in the public, commercial, or not-for-profit sectors.
References
Supplementary Material
Please find the following supplemental material available below.
For Open Access articles published under a Creative Commons License, all supplemental material carries the same license as the article it is associated with.
For non-Open Access articles published, all supplemental material carries a non-exclusive license, and permission requests for re-use of supplemental material or any part of supplemental material shall be sent directly to the copyright owner as specified in the copyright notice associated with the article.