
Abstract
A forced degradation study of a proprietary short interfering RNA (siRNA) molecule most of whose constituent nucleotides have been modified at the 2′ position was conducted to assess degradation pathways and stability liabilities. The siRNA was subjected to various conditions as a solid and in solution followed by analysis with reverse-phase ultra-performance liquid chromatography–mass spectrometry. Positional isomers of degradants gave rise to multiple chromatographic peaks with identical masses. In some instances, the exact location of a modification was elucidated, but in most cases although the identity of the nucleotide affected was proposed with a high degree of confidence, its position within the oligonucleotide sequence was not determined. Reaction mechanisms were proposed for all observed major degradants based on reverse-phase ultra-performance liquid chromatography–mass spectrometry data generated in this laboratory and a search of literature sources. This work demonstrates that the chemistry at the 2′ position of constituent nucleotides controls degradation pathways of highly modified siRNA molecules under various conditions and that classes of degradants can be predicted with a fair amount of confidence. A table of mass differences is presented that can be used as an aid to making partial structural assignments in oligonucleotide molecules containing similarly modified nucleotides.
Introduction
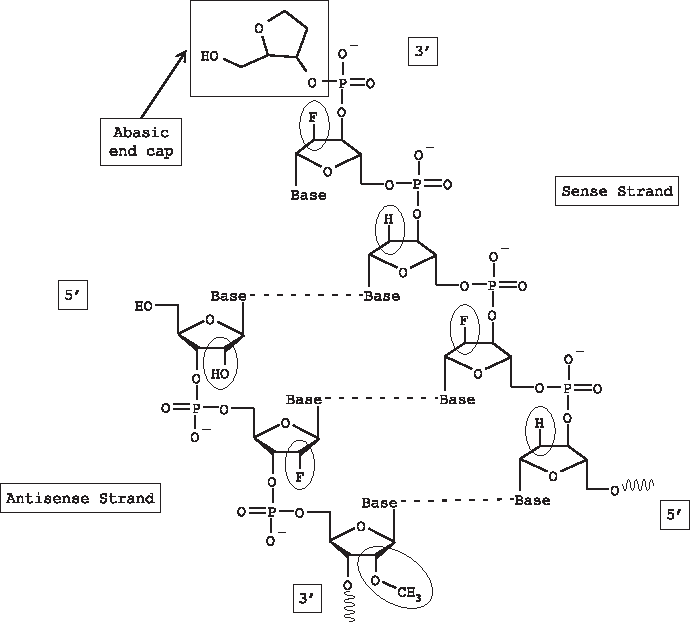
General structure of double-stranded short interfering RNA; hydrogen bonds are represented by dashed lines; 2′ substituents are circled; abasic end cap unique to sense strand is enclosed in box.
The ds siRNA was subjected to various conditions as a solid and in solution to generate degradation products with the aim of better understanding degradation pathways of highly modified oligonucleotide molecules. All exposed samples were analyzed by reverse-phase ultra-performance liquid chromatography–mass spectrometry (RP-UPLC-MS). Although the sequence of the ds siRNA is proprietary and cannot be disclosed presently, the observations in this study are expected to apply broadly to other ds siRNA molecules comprised of similarly modified nucleotides since in nearly all cases of this particular study, the position of a nucleotide within the siRNA sequence was not a factor in whether or not the nucleotide was affected. For the one special case where the position of the nucleotide within the siRNA sequence affected the degradation pathway, the controlling nucleotides are disclosed.
A review of the scientific literature of oligonucleotides was conducted in preparation for this forced degradation study with the aim of giving guidance in interpreting results of these experiments and to capture the most relevant information with regard to issues expected to arise in the shipping/handling, storage, formulation, and preparation for analysis of this class of molecule. The review accurately anticipated and described the reaction mechanisms observed in this study, and although many reaction mechanisms were possible, a limited number were actually deemed as plausible and surprisingly few strand scission degradants were observed.
Materials and Methods
Forced degradation reagents
A single batch of ds siRNA was used for the study and no corrections for water (typically ∼10% weight/weight) or salt (typically ∼5% weight/weight) content were made for sample preparation. The sample was maintained at −20°C when not in use. Reagents utilized in forced degradation experiments were prepared from commercial reagents including compressed nitrogen (National Specialty), UHP grade; compressed oxygen (Linde), UHP grade; hydrochloric acid solution, 1M (Fisher Scientific); hydrogen peroxide solution, 3 wt.% in water (Sigma-Aldrich); phosphate-buffered saline (PBS) [10 × ] (G Biosciences); sodium hydroxide, 1M (Fisher Scientific); and water (Sigma-Aldrich), HPLC grade.
Environmental chamber
Elevated-temperature solid and solution samples were stored protected from light in a VWR Model 1915 oven maintained at 60°C.
Solid sample exposure
Solid samples to be maintained at 60°C were preweighed into autosampler vials that were sealed in serum vials with silica desiccant sachets to normalize moisture content. The relative humidity within the vials is presumed to be <15% based on earlier monitored experiments. Two sealed vials were separately purged with oxygen or with nitrogen. One sealed vial was not purged and served as an atmospheric control. The 3 vials were stored for a duration of 3 days. After exposure, all samples were diluted to a concentration of 0.5 mg/mL in 1 × PBS for analysis by RP-UPLC-MS.
Solution sample exposure
A stock solution containing 2 mg/mL of the siRNA in 2 × PBS was prepared and maintained at 5°C when not in use. Aliquots of the stock were diluted with appropriate reagents to prepare the solutions listed in Table 1 at a concentration of 1 mg/mL. Note that exploratory experiments were also carried out at lower concentrations, yielding similar chromatography but no MS experiments were carried out on those samples. A separate control sample was prepared from the stock at the time of analysis of exposed samples. Exposure times were designed to yield around 5% to 10% degradation. After exposure, the solutions were neutralized if necessary and diluted with 1 × PBS to a concentration of 0.5 mg/mL before analysis by RP-UPLC-MS.
PBS, phosphate-buffered saline.
Solution samples were prepared in serum vials that were sealed before exposure. Note that most solution samples contained 1 × PBS to maintain a high salt content rather than to preserve a particular pH value. This was done to mimic more closely the actual likely storage conditions of any siRNA product in solution since a high salt content is associated with increased stability of the duplex nature of oligonucleotides, including those that have been modified (SCHILDKRAUT, 1965; Freier and Altmann, 1997; Tan and Chen, 2006). The pH of a solution also affects duplex stability and its effect was qualitatively assessed by melting temperature experiments using a thermostated UV spectrophotometer in which dilute sample solutions were heated while monitoring UV absorbance at 260 nm. The duplex is intact in 1 × PBS (pH 7.8), partially denatured in water (pH 6.1), intact in 0.01M HCl in 1 × PBS (pH 5.5), and totally denatured in 0.01M HCl (pH 2.1) and in 0.01M NaOH in 1 × PBS (pH 12.0). Initial exposure of the 0.01M HCl in 1 × PBS solution resulted in very little degradation, presumably since the pH of the solution was not adequately acidic to promote degradation and since the base pairs of the nucleotides were shielded in the duplex structure; therefore, the 0.01M HCl exposure was repeated in water with no PBS added.
RP-UPLC-MS
Chromatographic analysis was carried out using a Waters Acquity UPLC. The eluent was monitored by UV at 260 nm. Impurity peaks are classified as sense or antisense related based on proximity to their respective parent strand peaks in the chromatogram. Variation in retention times due to mobile phase and column variations that occurred day to day over the course of the study were observed and did not significantly impact the relative retention times of analytes as demonstrated by method development experiments. A full-scale chromatogram of the control sample is shown in Fig. 2.
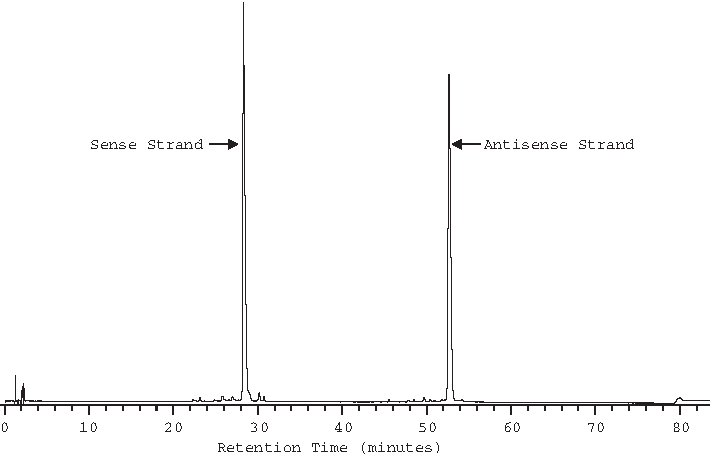
Full-scale reverse-phase chromatogram of the short interfering RNA control sample.
An Agilent 6300 Series Ion Trap mass spectrometer was placed in series after the UV detector with PEEK tubing using a T connector so that the flow reaching the MS was 30 μL/minute. Parameters were optimized during development to predominantly generate the −4H charge state of the sense and antisense strands. Other charge states were also generated and an algorithm provided with the MS software [DataAnalysis for LC/MSD Trap Version 3.2 (Build 121)] was utilized to calculate the deconvoluted neutral average masses of analytes based on the intensity weighted average of observed multiply charged ions. For purposes of calculating mass differences between the sense and antisense strands and their degradants, the observed mass values were used without correction to theoretic values. In some cases it was necessary to prepare fresh samples of the siRNA at higher concentrations of the siRNA (2–2.5 mg/mL) to form greater quantities of primary and secondary degradants to better enable characterization. MS instrument parameters are given in Table 2.
Results
Sense- and antisense-related impurities are summed separately and in total as reported in Table 3 as area % values. Typically <0.15% of impurities are not amenable to attributing to the sense or antisense strands since these impurities either elute nearly equidistantly between the 2 strands or elute close to the void volume. A notable exception is the sample exposed to 0.01M HCl, which contains 1.51% impurities (predominantly early eluters near the void volume) that cannot be attributed exclusively to the sense or antisense strands.
Impurities for some samples elute either equidistantly between the sense and antisense peaks or near the void volume and cannot be clearly attributed to one or the other strand but are included in the total impurities.
When appreciable degradation occurred, the sense strand degraded at the same or to a greater extent than the antisense strand under all conditions examined except at a high pH value, where the antisense strand degraded preferentially. The heated solid samples all appeared to degrade to the same extent (sense and antisense strands) regardless of atmosphere, indicating that the mechanism involved is purely thermal and not dependant on atmospheric oxygen. The sense strand degraded preferentially in the heated 1 × PBS solution sample and especially the 0.01M HCl solution sample.
Solid samples stored at 60°C
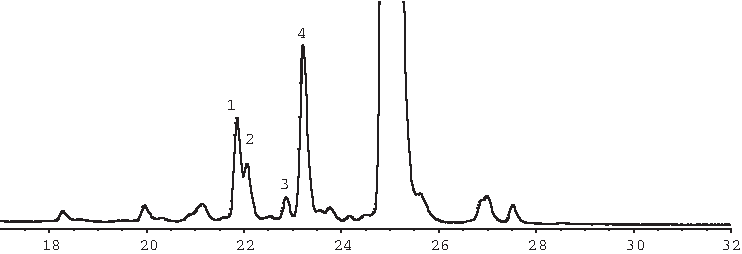
An overlay of the UV chromatogram and of extracted ion chromatograms created postanalysis based on masses observed for impurities detected in the solid sample stored at 60°C is presented in Fig. 3. Chromatograms for the solid samples stored under air and under oxygen are nearly identical. Peaks 1, 2, and 3 in the UV chromatogram correspond to peaks detected in the extracted ion chromatogram at an m/z of 1708.7. Peaks 4 (shoulder), 5, and 6 in the UV chromatogram correspond to peaks detected in the extracted ion chromatogram at an m/z of 1713.3. Peaks 7 through 10, 12, and 14 in the UV chromatogram correspond to peaks detected in the extracted ion chromatogram at an m/z of 1684.0. Peaks 11 and 13 in the UV chromatogram correspond to peaks detected in the extracted ion chromatogram at an m/z of 1688.5.

Overlay of UV and extracted ion chromatograms for solid sample purged with nitrogen and stored at 60°C.
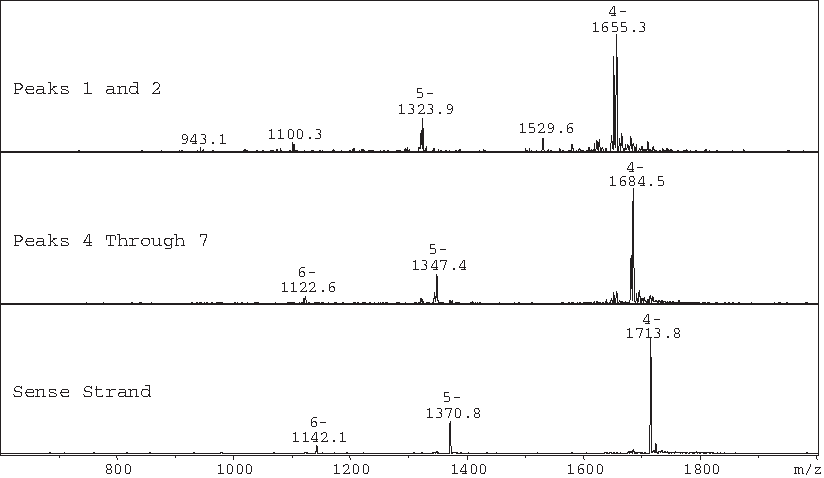
Mass spectra for the sense and antisense strands and for selected degradants in the heat exposed sample are given in Fig. 4 with the most intense charge state ions labeled. The spectra were deconvoluted to obtain average masses given in Table 4.
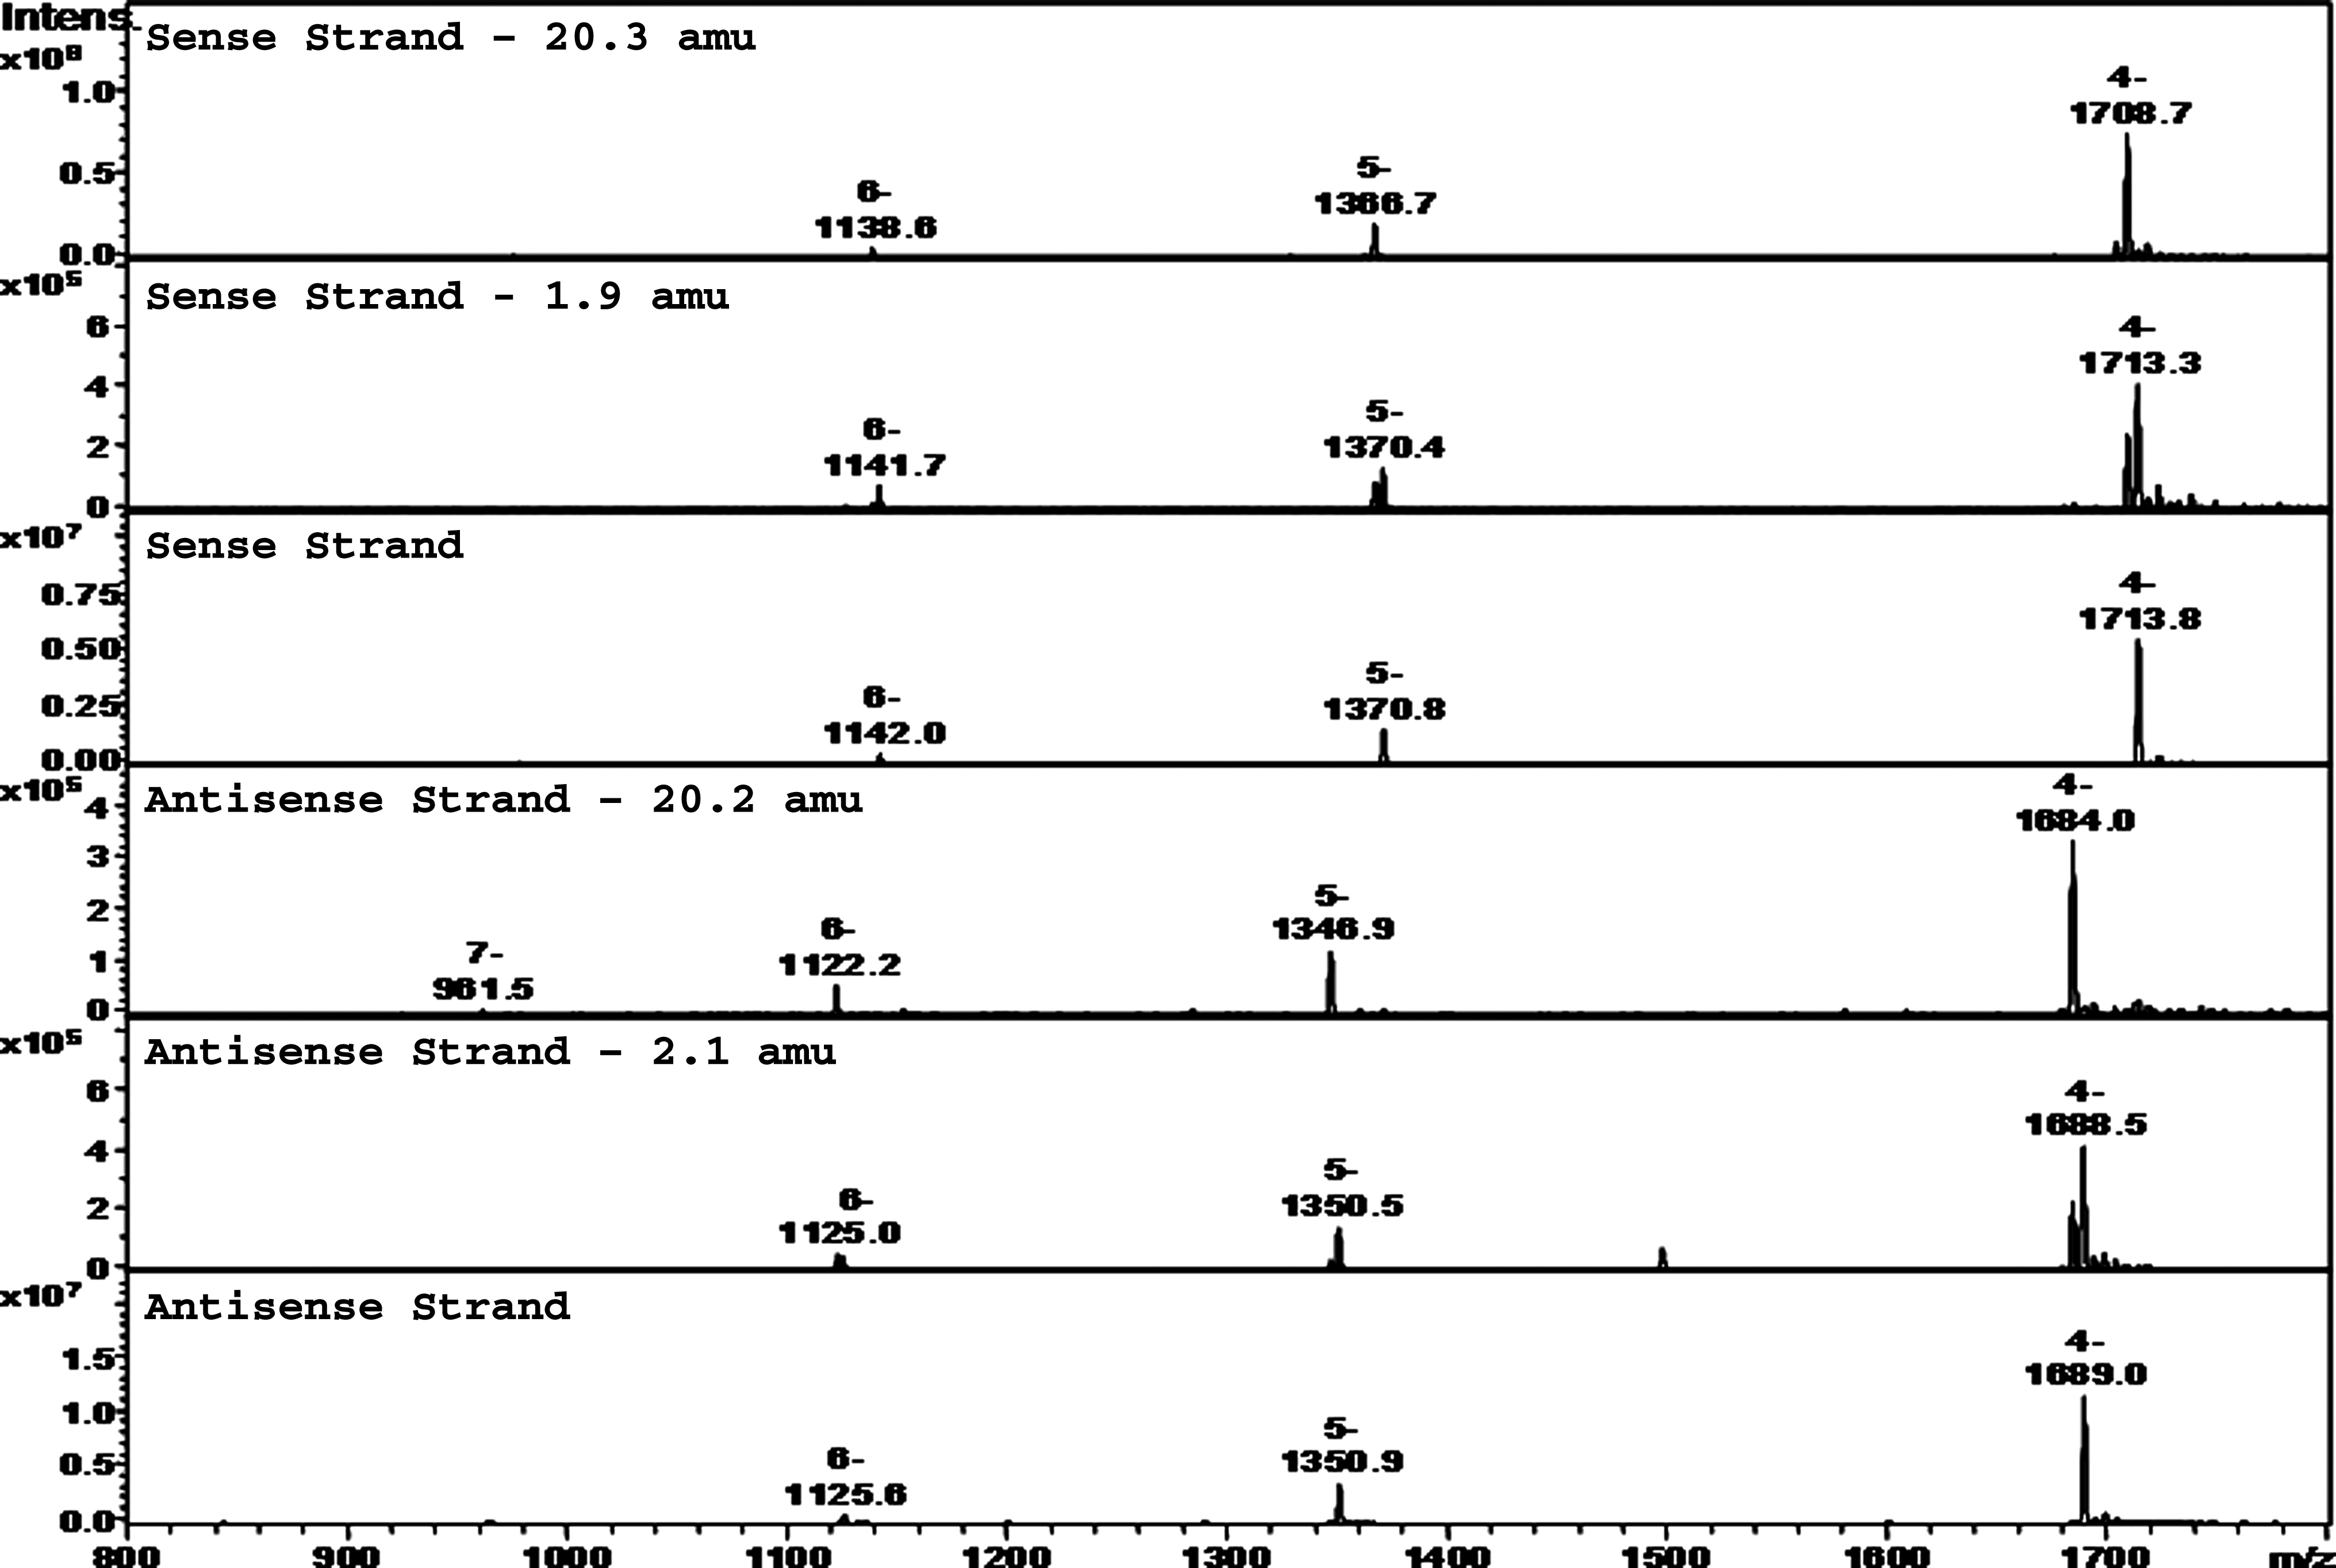
Mass spectra of sense and antisense strands and their major degradants for solid sample purged with nitrogen and stored at 60°C.
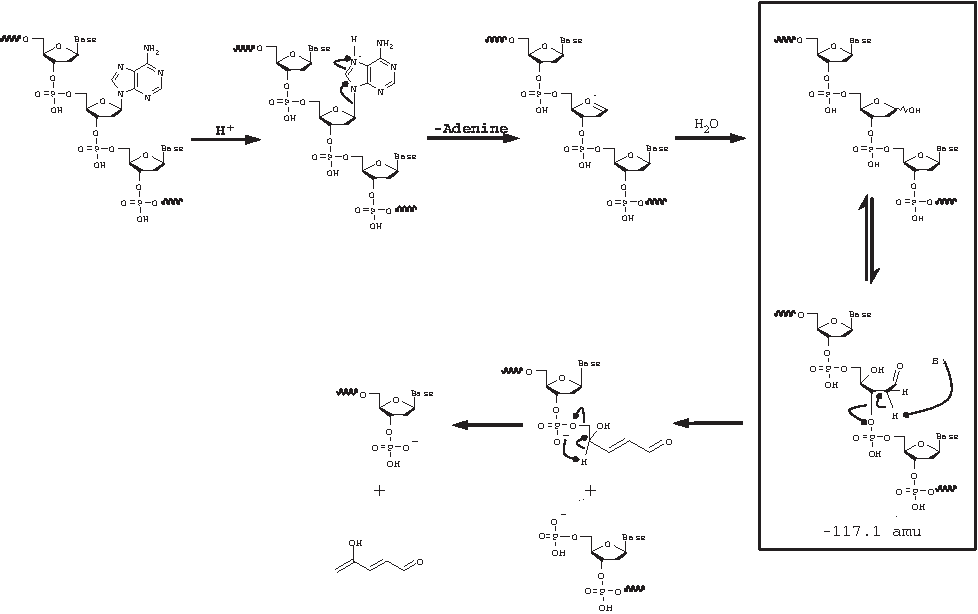
Due to the limited mass accuracy of the detector used, the mass determined for the sense strand in this chromatographic injection was 6859.0, which differs from its calculated average value of 6860.3 by 1.3 amu. Similarly, the mass determined in this chromatographic injection for the antisense strand at 6759.8 differs from its calculated average value of 6761.0 by 1.2 amu. Peaks 1, 2, and 3 in the UV chromatogram have an averaged mass of 6838.6, differing from the observed sense strand mass by 20.4 amu, which likely corresponds to impurities in which a proton and a fluorine atom have been removed from one of the 8 available 2′deoxy-2′-fluoro-ribonucleotides in the sense strand to form a 2,2′-O-anhydro-ribonucleotide (Doerr and Fox, 1967). Impurities with a nominal mass difference of 20 amu from the parent strand were also detected in the control sample, though at much lower levels. Possible sources of these impurities include impure starting materials being incorporated into the strand(s) or chemical degradation occurring during steps of the synthesis of strand(s) that occur at higher than ambient temperature. Peaks 4, 5, and 6 in the UV chromatogram have an averaged mass of 6857.1, which differs from the mass determined for the sense strand by 1.9 amu and correspond to impurities with a loss of 2 protons from the sense strand. This article proposes that these degradants are arabinosylnucleotides, which are readily formed by hydrolysis of the above-mentioned 2,2′-O-anhydro-ribonucleotides (ibid.). Fig. 5 (adapted from previous reference) illustrates the reaction mechanisms by which 2′deoxy-2′-fluoro-cytidine and 2′deoxy-2′-fluoro-uridine undergo loss of HF to form their respective 2,2′-anhydronucleotides followed by hydrolysis to form their respective arabinosylnucleotides. Species generated through this mechanism are necessarily arabinosyl (not ribosyl) due to the constraining geometry of the 2-2′ anhydro intermediates from which they are formed. The reaction rate for 2′deoxy-2′-fluorocytidine is about 29 times that of 2′deoxy-2′-fluorouridine (ibid.); therefore, the degradants observed in this work are more likely to result from cytidine rather than uridine though uridine degradants cannot be ruled out. Peaks 7 through 10, 12, and 14 in the UV chromatogram have an averaged mass of 6739.6, differing from the observed antisense strand by 20.2 amu, which corresponds to the mass of the antisense strand in which a proton and a fluorine atom have been removed from one of the 10 available 2′deoxy-2′-fluoro-ribonucleotides. Peaks 11 and 13 in the UV chromatogram have an averaged mass of 6757.9, which differs from the mass determined for the antisense strand by 2.1 amu, corresponding to a loss of 2 protons from the antisense strand. These degradants are analogous to those discussed for the sense strand. The degradants formed in samples maintained at elevated temperature are evidently the result of a purely thermal mechanism since no difference in levels of impurities was observed for the 3 different atmospheres; the samples were exposed to and the samples were protected from light. Additionally, hydrolysis of the 2,2′-O-anhydroribonucleotides to arabinosylnucleotides occurred under conditions of very low levels of moisture.
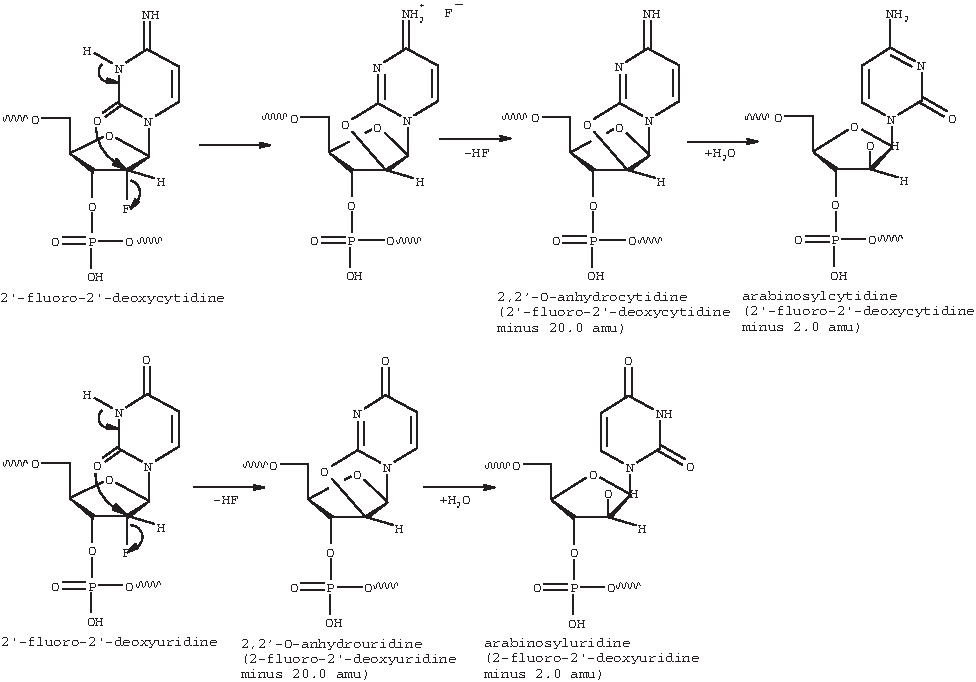
Conversion of 2′-fluoro-2′-deoxycytidine and 2′-fluoro-2′-deoxyuridine to observed degradants.
1 × PBS solution sample stored at 60°C
Only the sense strand showed appreciable degradation in 1 × PBS solution maintained at 60°C. A UV chromatogram centered on the sense strand and its impurities detected in this sample is presented in Fig. 6. Peaks 1 and 3 have masses consistent with 2,2′-O-anhydroribonucleotides and peaks 2 and 4 have masses consistent with arabinosylnucleotides as discussed for solid samples stored at 60°C. It is evident from visually comparing UV chromatograms in Figs. 6 and 3 that the ratio of arabinosylnucleotide peak sizes to anhydroribonucleotides peak sizes is greater in the 1 × PBS sample maintained at 60°C than in the solid sample maintained at 60°C. This observation is corroborated by Doerr and Fox, who showed that the formation of arabinosylnucleotides goes to completion if the liberated HF is neutralized, whereas only anhydroribonucleotides or a mixture of anhydroribonucleotides and arabinosylnucleotides is formed in a low-pH environment.
UV chromatogram of 1 × phosphate-buffered saline sample stored at 60°C.
0.01M NaOH in 1 × PBS solution sample
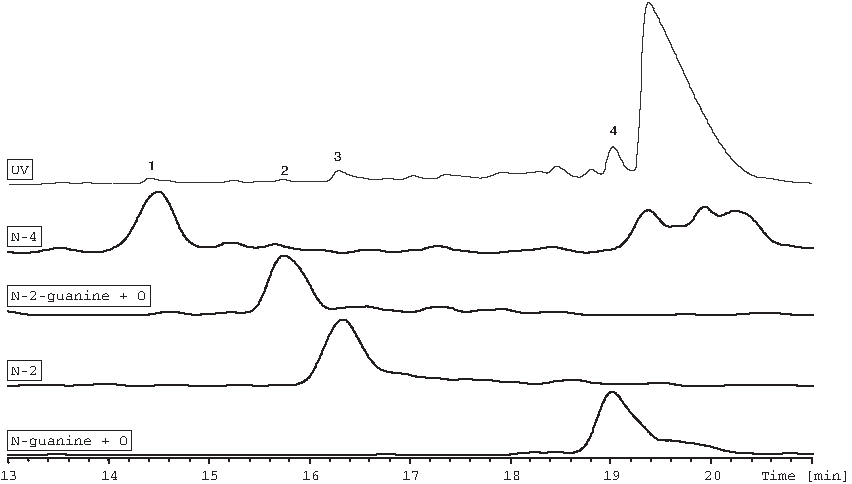
Only the antisense strand showed significant degradation in a 1 × PBS solution containing 0.01M NaOH. An overlay of the UV chromatogram centered on the antisense strand and its impurities and of extracted ion chromatograms created postanalysis based on masses observed for impurities detected in this sample is presented in Fig. 7. The mass determined for the antisense strand in this chromatographic injection was 6760.0, which differs from its calculated value of 6761.0 by 1.0 amu. The masses determined for the degradants in order of elution time correspond to the antisense strand minus the 2 ribonucleotides at the 5′ end (N-2; RRT [relative retention time, to the antisense strand] = 1.03), the antisense strand minus the ribonucleotide at the 5′ end (N-1; RRT = 1.04), and the antisense strand minus the 3 nucleotides at the 5′ end (N-3; RRT = 1.07).

Overlay of UV and extracted ion chromatograms of base treated sample centered around the antisense strand.
The 3 nucleotides lost from the antisense strand are unmodified ribonucleotides; that is, the 2′ -OH groups were available to participate in an intramolecular nucleophilic substitution known to occur at high pH values (Oivanen et al., 1998). Since the sense strand is comprised only of 2′-deoxy- or 2′-deoxy-2′-fluoro-ribonucleotides, similar degradants are not observed for the sense strand (Nawrot and Sipa, 2006). Figure 8 (adapted from the previous 2 references) illustrates the proposed mechanism for this reaction.

Mechanism Of RNA cleavage under basic conditions.
0.01M HCl solution sample
Only the sense strand showed appreciable degradation in a solution of 0.01M HCl. An overlay of the UV chromatogram centered on the sense strand and its impurities and of extracted ion chromatograms created postanalysis based on masses observed for impurities detected in this sample is presented in Fig. 9. Peaks 1, 3, and 8 in the UV chromatogram are of a mass consistent with the 2,2′-O-anhydroribonucleotides as discussed above. No arabinosylnucleotides were detected. Peak 2 in the UV chromatogram corresponds to peaks detected in the extracted ion chromatograms at an m/z of 1655.3 and at an m/z of 1651.2. The coeluting peaks 4 through 7, 9, and 10 in the UV chromatogram correspond to peaks detected in the extracted ion chromatograms at an m/z of 1680.5 and at an m/z of 1684.5. Mass spectra for the sense strand and selected major degradants (peaks 2 and 4 through 7) when exposed to 0.01 M HCl are shown in Fig. 10. Only the most intense charge state ions of the higher-molecular-weight species are labeled. Neutral average masses determined via deconvolution of these spectra are listed in Table 5.

Overlay of UV and extracted ion chromatograms of acid degraded sample centered about the sense strand.
Mass spectra of selected peaks from Fig. 9.
The mass determined for the sense strand in this chromatographic injection was 6859.2, which differs from its calculated value of 6860.3 by 1.1 amu. The masses associated with peaks 1 and 2, nearly coeluting peaks, correspond to degradants that differ from the observed mass of the sense strand by 234.1 and 250.6 amu, respectively. These masses correspond to the mass of the sense strand that has undergone loss of 2 adenines (observed: 234.1; calculated: 234.2), or one guanine and one adenine (observed: 250.6; calculated: 250.2). The masses determined for peaks 4 through 7, which are poorly resolved, and 9 and 10, which are poorly resolved from the sense strand peak, correspond to the mass of the sense strand that has undergone loss of one adenine (observed: 117.1; calculated: 117.1) or one guanine (observed: 133.4; calculated: 133.1). All of these degradants can be formed through a mechanism involving an oxocarbonium ion intermediate (Watts et al., 2009) and this reaction generally leads to strand scission. Figure 11 (adapted from Watts and Burrows) illustrates the loss of adenine from a segment of DNA, yielding a product with the mass of the full-length DNA segment minus 117.1 amu corresponding to one of the masses observed in this experiment. Loss of guanine, of one guanine and one adenine, or of 2 adenines yields the other masses detected in this experiment. Rate constants for adenosine and guanosine are similar, whereas rate constants for pyrimidines are much lower. The observation that the antisense strand showed no degradation under this condition over the course of the study is expected since the antisense strand has electronegative substituents (F, O-methyl, or OH) at the 2′ position, which destabilize the oxocarbonium ion intermediate and therefore inhibit depurination or depyrimidination (ibid.).
Mechanism of acid-catalyzed loss of adenine and eventual strand cleavage in DNA.
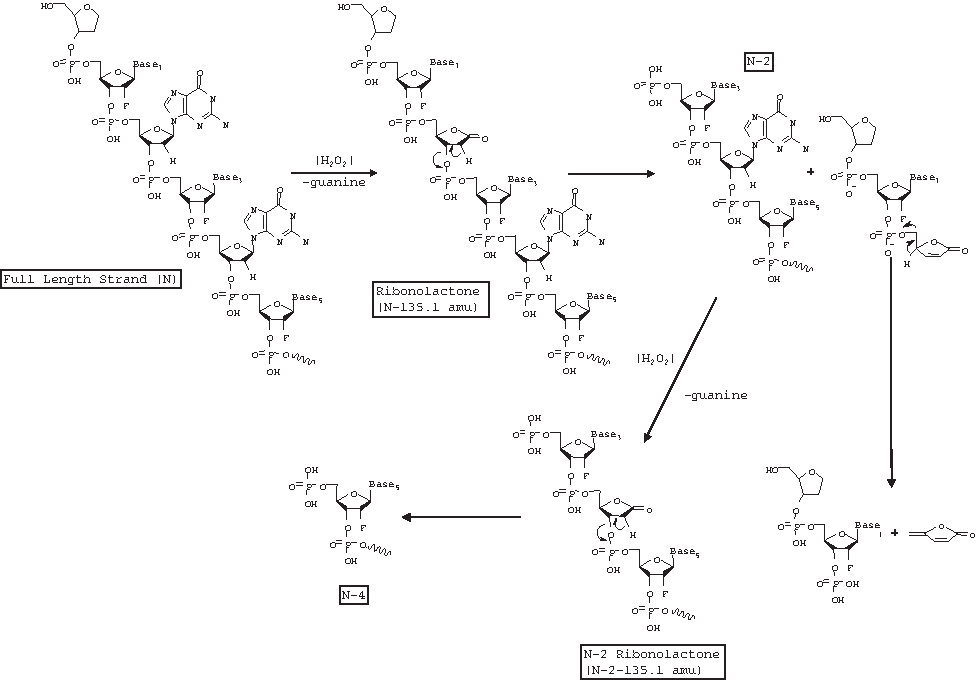
H2O2 in 1 × PBS solution sample
The initial use of 5 ppm H2O2 in 1 × PBS with 4 hours of exposure resulted in insufficient degradant levels to enable characterization by MS. To generate greater amounts of degradants for characterization by MS, the experiment was repeated with 25 ppm H2O2 in 1 × PBS. Only the sense strand showed appreciable degradation. An overlay of the UV chromatogram centered on the sense strand and its impurities and of extracted ion chromatograms created postanalysis based on masses observed for impurities detected in this sample is presented in Fig. 12.
Overlay of UV and extracted ion chromatograms of oxidized sample.
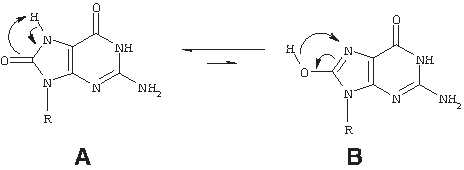
The mass determined for the sense strand in this chromatographic injection was 6859.0, which differs from its calculated value of 6860.3 by 1.3 amu. Peak 1 in the UV chromatogram corresponds to a peak detected in the extracted ion chromatogram at a m/z value corresponding to the −4 charge state of the mass of the sense strand minus the abasic end cap and the first 4 nucleotides from the 5′ end. Note that peaks apparently co-eluting with the sense strand in the extracted ion chromatogram are due to the −5H charge state of the sense strand and do not represent impurity peaks. Peak 2 in the UV chromatogram corresponds to a peak detected in the extracted ion chromatogram at an m/z corresponding to the −4 charge state of the mass of the sense strand minus the abasic end cap and the first 2 nucleotides from the 5′ end along with the loss of one guanine and addition of oxygen to form a 2′-deoxyribonolactone within the remaining 19-mer strand. Peak 3 in the UV chromatogram corresponds to a peak detected in the extracted ion chromatogram at an m/z corresponding to the −4 charge state of the mass of the sense strand minus the abasic end cap and the first 2 nucleotides from the 5′ end. Peak 4 in the UV chromatogram corresponds to a peak detected in the extracted ion chromatogram at an m/z corresponding to the −4 charge state of the mass of the sense strand minus one guanine and the addition of oxygen to form a 2′-deoxyribonolactone within the full-length strand. Oxidative reaction mechanisms leading to the series of proposed degradant structures are shown in Fig. 13 (adapted from Pogozelski and Tullius, 1998).
Mechanism of acid-catalyzed loss of adenine and eventual strand cleavage in DNA.
Also detected in the mass chromatogram of the H2O2-degraded sample were multiple poorly resolved peaks with masses consistent with the full-length sense strand plus 16 amu, likely corresponding to the addition of oxygen to one guanine to form 8-oxoguanine and its minor tautomer within the full-length strand (Fig. 14; adapted from Sheu and Foote, 1995).
Overlay structure of 8-oxoguanine
It is critical that strand scission at the 3′ end of the sense strand occurred at the guanosine nucleotides at the 2 and 4 positions and did not result from sequential loss of the abasic end caps and/or other nucleotides. The abasic end cap is cleaved only with great difficulty (Farand and Beverly, 2008). In addition, guanosine and especially 2′-deoxy-guanosine is more sensitive to oxidation than the other nucleotides in the siRNA. Deoxyribonucleic acids are depurinated about 500 times more rapidly than ribonucleic acids (Burrows and Muller, 1998) and this can explain the observation that the sense strand, which contains deoxyribonucleic acids, was degraded to a much greater extent than the antisense strand, whose ribonucleotides possess electronegative substituents at the 2′ position. It is highly likely that the guanines that were cleaved from the sense strand were first oxidized to 8-oxo-guanine, which is a better leaving group than guanine (ibid.).
Discussion
A proprietary siRNA was subjected to various conditions as a solid and in solution to generate degradation products with the aim of developing a better understanding of degradation pathways. Under the conditions studied, the compound was remarkably resistant to base loss and/or strand scission except under very harsh conditions. The siRNA was somewhat sensitive to heat, both as a solid and in solution, losing HF from its available 2′deoxy-2′-fluoro-ribonucleotides in both the sense and antisense strands to form mixtures of 2,2′-O-anhydroribonucleotides. These degradants undergo hydrolysis, even in low-humidity environments, to form arabinosylnucleotides. The number of these species formed is dependent on the number of precursor 2′deoxy-2′-fluoro-ribonucleotides in the sense and antisense strands. These species are still full-length oligonucleotides and can presumably reanneal when maintained at room temperature in 1 × PBS. Literature suggests that the ratio of arabinosylnucleotides to anhydroribonucleotides formed is dependent on whether or not liberated HF is neutralized, with arabinosylnucleotides being formed preferentially if liberated HF is neutralized. The siRNA is also sensitive to pH extremes though the sense and antisense strands show differential stability. Both strands are comprised of 2′deoxy-2′-fluoro-ribonucleotides along with other modified ribonucleotides. The sense strand behaves most like DNA in that it contains deoxyribonucleotides, which are more susceptible to loss of nucleobases at low pH. This loss of nucleobase(s) may or may not be followed by strand scission. 2′-Deoxyguanosines appeared especially sensitive to oxidation, likely forming 8-oxo-guanosines. This leads to loss of the nucleobase, which in turn facilitates strand scission at the ribose moiety, yielding 2 phosphate containing oligonucleotides. Additionally, the sense strand is capped at both the 3′ and 5′ ends by abasic end caps. No evidence of cleavage at the site of these moieties was observed in this work and this agrees with other reports that these end caps are difficult to remove. The antisense strand behaves more like RNA in that it contains 3 unmodified ribonucleotides at its 5′ end that are readily cleaved under alkaline conditions to form N-1, N-2, and N-3 oligonucleotides. Table 6 summarizes the degradation products observed in this study. Mass differences are based on calculated differences and can be used to suggest probable identities of degradants observed in these or other similarly modified oligonucleotides.
Footnotes
Acknowledgments
Gary Parsons (Inhaled Products Development; Innovated Inhaled Products-UK) supported this work and its publication.
Author Disclosure Statement
No competing financial interests exist.