




Abstract
Abstract
Among Teleosts, Sparus aurata occupies a prominent place in the gastronomic and economic fields of the Mediterranean basin and other geographic districts. The knowledge of its molecular structures and functional features, such as hemoglobin, may be helpful to understand the adaptive biochemical mechanisms that allow this fish to live under extreme conditions, including fish farming. In Sparus aurata red blood cells two different α and one β hemoglobin genes have been identified. The α1 gene codifies a putative protein of 144 amino acids, the α2 gene produces a protein of 143 amino acids, and the β gene encodes a chain of 148 amino acids. Comparative analysis of various hemoglobins indicates that allosteric regulation can be modified by the substitution of one or a few key residues. The comparison of the percentage sequence differences for α and β chains in fishes indicates that evolutionary relationships between different species may be helpful to understand the mechanisms of their differentiation from other vertebrates. Hemoglobin α and β chains of about 50 teleostean temperate and Antarctic fishes were analyzed to build phylogenetic trees using different algorithms: the neighbor-joining method, the maximum likelihood approach, and the Bayesian inference computation. Sparus aurata α chains are positioned in a paraphyletic cluster, which includes the same subunit of Chrysophrys auratus and Seriola quinqueradiata, whereas the β chain is on an homophyletic branch with that of Chrysophrys auratus. Therefore, the phylogenetic approach suggests that both Sparus aurata hemoglobin α genes are paralogues and may have derived from a duplication event.
Introduction
Materials and Methods
Spectrophotometric assays
The nucleic acids manipulated during all experiments were previously quantified by using the Biomate 3 spectrophotometer (Thermo Electron Corporation, Waltham, MA, USA) at 260 nm, assuming the value of 1 OD = 50 μg/mL DNA and 1 OD = 40 μg/mL RNA (Maniatis, 1996).
Fish sample
The protocol of investigation was in accordance with the internationally accepted principles and the national law concerning the care and use of laboratory animals (national law no. 116/1992).
One specimen of adult Sparus aurata, weighing 450 g, was kindly provided by Ippocampus fish-farmer (Villafranca Tirrena, Messina, Italy) and a blood sample was obtained from the caudal vein after using MS-222 as anesthetic (40 mg/L) for no longer than 4 min. The blood sample was anticoagulated with 50 mM Na2EDTA and immediately processed. The fish was then donated to the Messina public aquarium.
RNA isolation
Total RNA was extracted and purified from red blood cells of S. aurata by using Trizol reagent kit (Invitrogen, Carlsbad, CA, USA) according to the manufacturer's instructions. After precipitation, the RNA pellet was dissolved in TE buffer, quantified as previously described, and its purity was assayed spectrophotometrically by the ratio A260/A280 > 1.8.
Rapid amplification of cDNA end
To identify the nucleotide sequence of S. aurata globin mRNAs, the sample was processed by the versatile Gene Rapid Amplification of cDNA ends method, previously described (Maruyama & Sugano, 1994; Schaefer, 1995), by using the chemicals and protocol of 5′ < - > 3′ Gene Racer kit (Invitrogen), which is highly specific and rapid for studying unknown nucleotide sequences. Because S. aurata red blood cells mainly synthesize globin mRNAs, with no gene fragments available, we chose to use both 5′ and 3′ anchor oligos supplied by Gene Racer kit.
The retro-transcription and the polymerase chain reaction (PCR) were carried out by the Superscript III and the Taq DNA polymerase HiFi (Invitrogen), respectively, on a Mastercycler thermocyclator (Eppendorf, Germany), as suggested by the manufacturer. The reaction was performed by a touchdown protocol for the high specificity of reaction, as previously described by Roux (1995). The PCR products were visualized in 2% HR agarose gel (EuroClone, UK) by fluorochromatizaton with ethidium bromide.
Only amplicons of about 700 bp were detected. The PCR products were excised from the gel and purified by using the JETquick spin column kit (Genomed, St. Louis, MO, USA) as suggested by the manufacturer.
Molecular cloning of S. aurata cDNA hemoglobins
The purified amplicons were cloned by the TOPO TA Cloning sequencing kit (Invitrogen) and the TOP 10 Escherichia coli competent cells, as previously described by Bernard et al. (1994). Forty-eight random selected clones were screened by nucleotide sequencing with both 5′(T3) and 3′(T7) oligos, that annealed both sides of the vector polylinker region, and the BigDye terminators cycle sequencing kit v. 1.1 (Applied Biosystems, Bedford, MA, USA), as suggested by the manufacturer. Each clone was previously subjected to the miniprep culture and the plasmids were extracted with the JETstar spin column kit (Genomed, UK). The polynucleotide fragments obtained were separated by capillary electrophoresis on a mod. 310 Genetic Analyzer (Applied Biosystems) with a 47-cm capillary and the POP 6TM linear polyacrilamide. The electropherograms were analyzed by the free ware Finch TV software (Geospiza, UK), whereas the sequence homology search was carried out with the BLAST program available on NCBI (http://www.ncbi.nlm.nih.gov) and the Clustal W program within the multisoftware Biology Workbench 3.2 (http://workbench.sdsc.edu).
Intronic sequences identification
Genomic DNA from S. aurata red blood cells was extracted and purified according to the procedure suggested by Travaglini (1973). On the basis of the newly identified globin nucleotide sequences, a set of sense and antisense oligos was designed for each gene, with the aim to detect the intronic sequence by PCR reactions:
The PCRs were carried out with 100 ng of DNA and 0.1U of Taq DNA polymerase HiFi (Invitrogen) according to the manufacturer's instructions. The related cycles included predenaturation at 94°C for 5 min, 35 cycles at 94°C for 30 s, 58°C for 30 s, and 68°C for 1 min, followed by a final elongation at 68°C for 15 min. After gel extraction, each PCR product was cloned and sequenced as previously described. The intronic sequences obtained from genomic DNA for each gene and the related full-length cDNA identified were carefully overlaid with the aim to construct the entire genes.
Phylogenetic trees computation
The amino acid sequences of α and β hemoglobins of S. aurata and other teleostean were separately aligned with the CLUSTAL W online software (http://workbench.sdsc.edu/). As previously described Maruyama et al. (2004b) the Human, Chicken, Turtle, Bulfrog, Coelacanth and Dogfish hemopolypeptides were included in the study as outgroup for both alignments (Table 1). After manual correction, the alignments were computed by means of the online ProTest program (http://darwin.uvigo.es/software/prottest_server.html) to assess the best-fit matrix for understanding hemoglobin chains evolution: the Dayhoff model (Dayhoff et al., 1978) was chosen as transition probability matrices for making the α (49 Taxa) and β (55 Taxa) chain trees, and was calculated as distance of amino acid substitution per site. The α and β phylogenetic trees were estimated with three different methods: the trees topology was assayed by the neighbor-joining method (Saitou and Nei, 1987) of the free ware MEGA v. 4.1 program (Tamura et al., 2007) (http://www.megasoftware.net), with 1,000 replicates for the bootstrap test; although the phylogenetic trees were evaluated with the Maximum Likelihood (ML) method implemented in the program PHYML (Guindon and Gascuel, 2003) (http://www.abc.se/∼nylander/) and with newly developed Bayesian inference method comprised in the MrBayes v.3.1.2 package (Huelsenbeck and Ronquist, 2001) (http://mrbayes.net). We estimated by PHYML program robustness nonparametric bootstrap analysis with 500 replicates; the proportion of invariable sites was evaluated during the analysis, whereas the range of rate variation across site was determined by gamma distribution set to 5 number of categories. We also performed by MrBayes software a Bayesian Markov Chain Monte Carlo (MCMC) analysis for testing evolutionary hypotheses in which the trees were weighted proportionally to their posterior probability. Two independent assays were performed for both α and β sequence alignments: the substitution matrix was Dayhoff also, the site of heterogeneity model was gamma with 4 number of categories, whereas the number of MCMC replicates was 106. The final results were summarized in a best tree after discard the first 25% of samples obtained. All phylogenetic trees were viewed by using the free ware FigTree v.1.2.3 software (Rambaut, 2006–2009).
Results
Cloning and sequence analysis of Sparus aurata hemoglobin genes
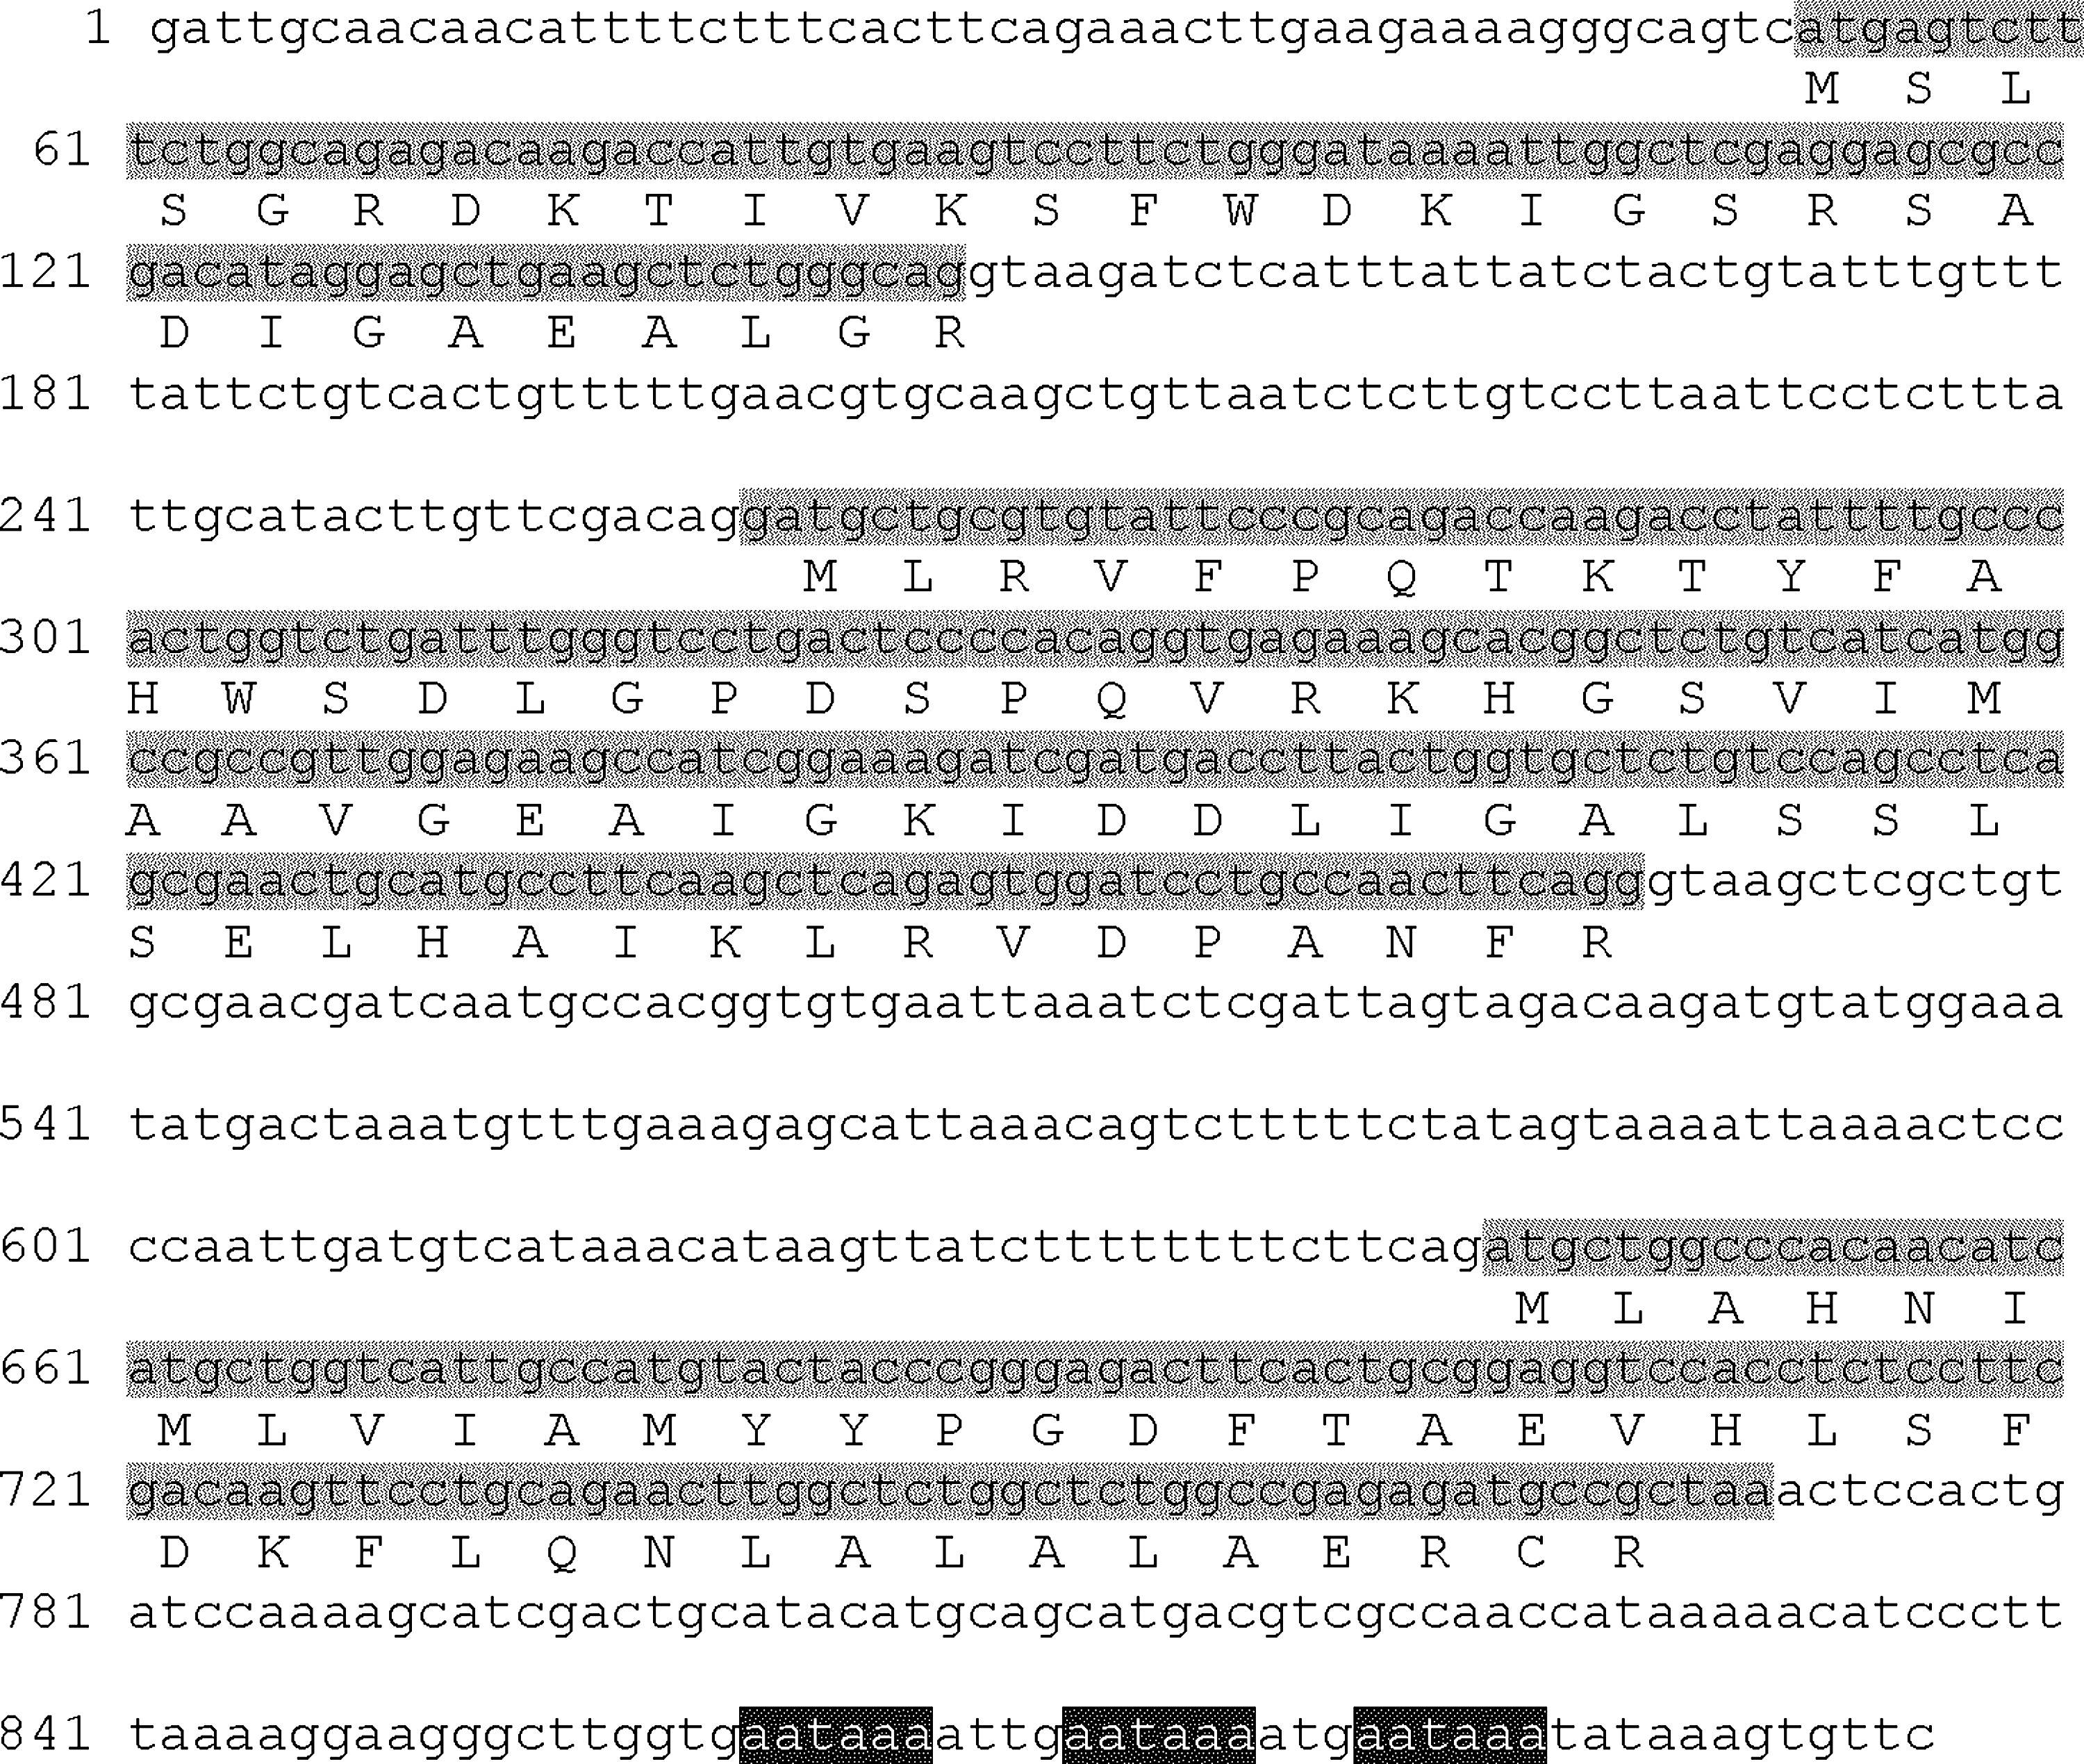
In this study, three adult hemoglobin genes were identified in S. aurata red blood cells: two different α and one β genes. Their nucleotidic and amino acidic sequences have already been submitted to the GenBank database (accession numbers: DQ520839, DQ520840, and DQ452379, respectively). The two α hemoglobin genes were called α1 and α2 on the basis of their subsequent identification. As expected, all hemoglobin genes comprise three exons and two small introns. The α1 gene is 919 nt in length and codifies a putative protein of 144 amino acids. The cDNA is 598 nt long up to the poly(A) site, whereas the open reading frame (ORF) is 435 bases long: the ATG start codon is located at position 55, the TAA stop codon at position 489 and the poly(A) signal at position 579 (Fig. 1). The α2 gene is made up of 896 nucleotides and produces a putative protein of 143 amino acids.

Sparus aurata α1 globin gene [CDS Gray, Poly(A) signal Black].
The cDNA is composed of 608 bases up to the poly(A) site and includes an ORF 432 nt long: the start codon is located at position 52, the TAA stop codon at position 483 and the three poly(A) signals at positions 572, 582, and 591 (Fig. 2). The β gene is composed of 827 nucleotides and encodes a deduced protein of 148 amino acids. The cDNA is 618 nucleotides long up to the poly(A) site and includes an ORF of 447 nt in size. The start codon is located at position 63, the TGA stop codon at position 509 and the poly(A) signal at position 594 (Fig. 3).
Sparus aurata α2 globin gene [CDS Gray, Poly(A) signals Black].

Sparus aurata β globin gene [CDS Gray, Poly(A) signal Black].
Alignment studies of S. aurata and human hemoglobin chains
All S. aurata hemoglobin sequences were aligned versus the human proteins obtained from GenBank (accession numbers: α globin = NM_000558 and β globin = NM_000517). The S. aurata α1 nucleotide sequence shows an insertion of six bases, that gives rise to Phe47Trp variation and leads to two additional amino acids in the putative α1 chain: Gly48 and Thr49 (CE 5–6) (Fig. 4). The degree of homology between the S. aurata α1 and human α chains is 47.9%. Instead, the Aurata α2 sequence exhibits only one insertion that determines the same Phe47Trp difference and introduces one further amino acid in the translated product: Ser48 (CE 5). S. aurata α2 and human α proteins show 47.6% identity, whereas α1 and α2 chains have a 59% identity (Fig. 4). The comparison of S. aurata β sequence with the human homologue shows a difference of three nucleotides that introduces the Pro121 (GH 3) in the fish chain. Their identity is 47.3% (Fig. 5).
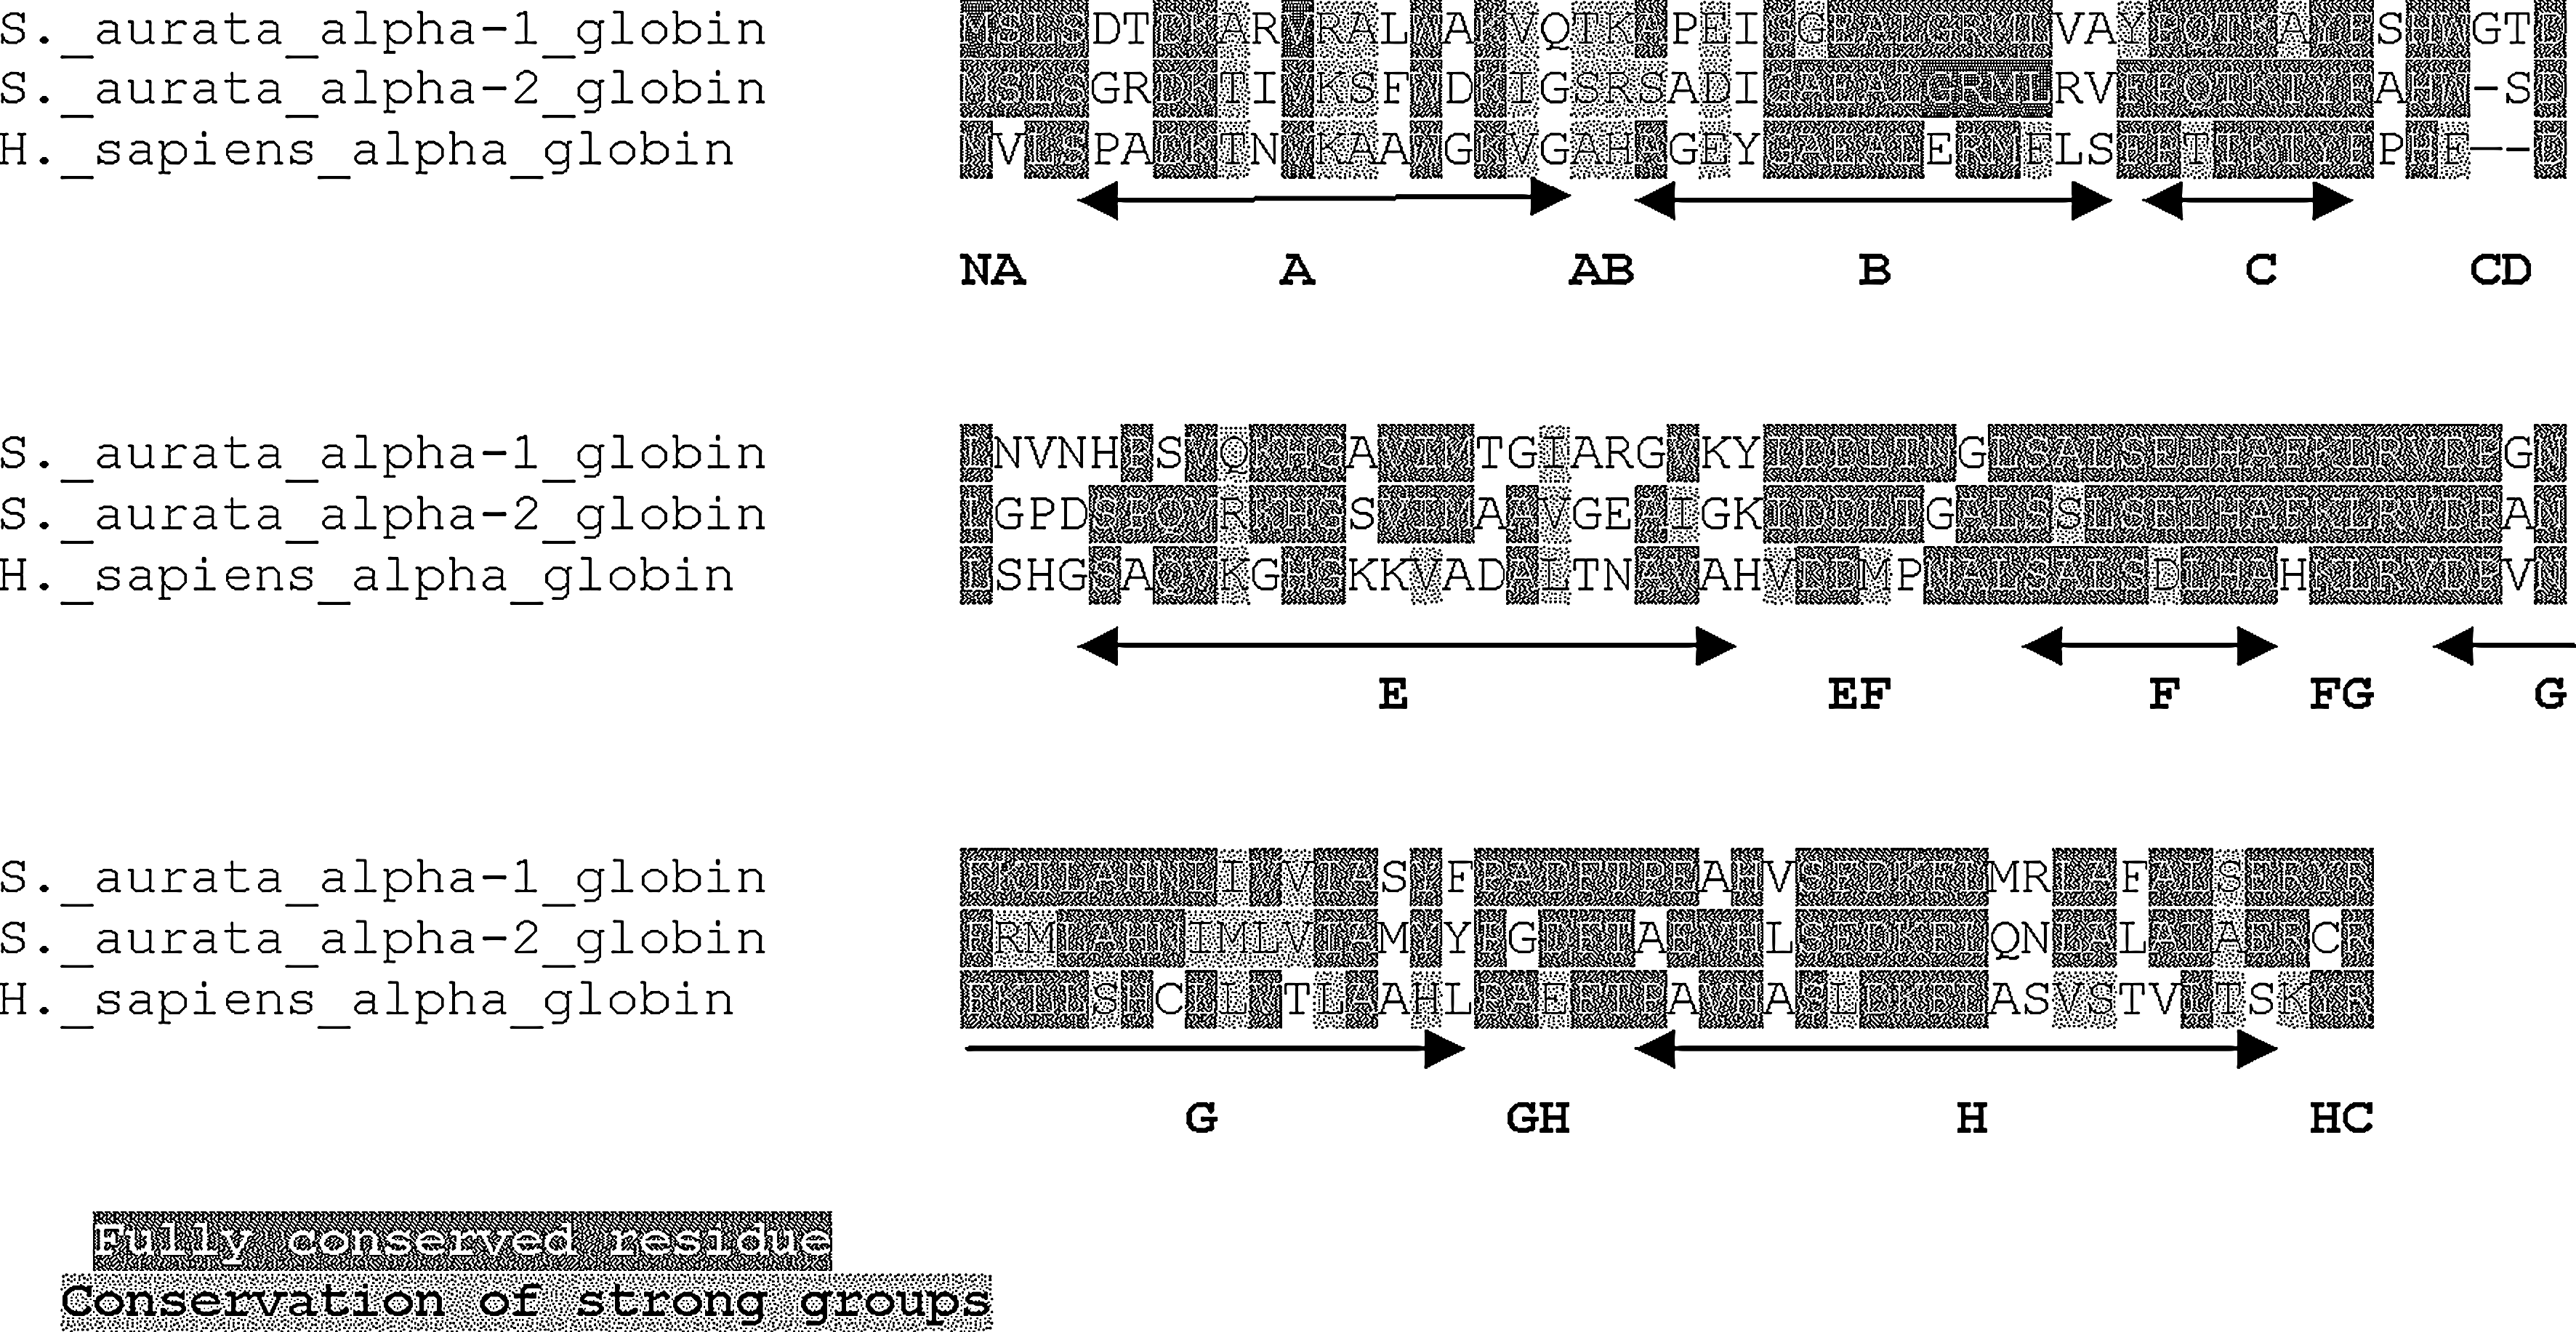
Sparus aurata and Homo sapiens α globins alignment.
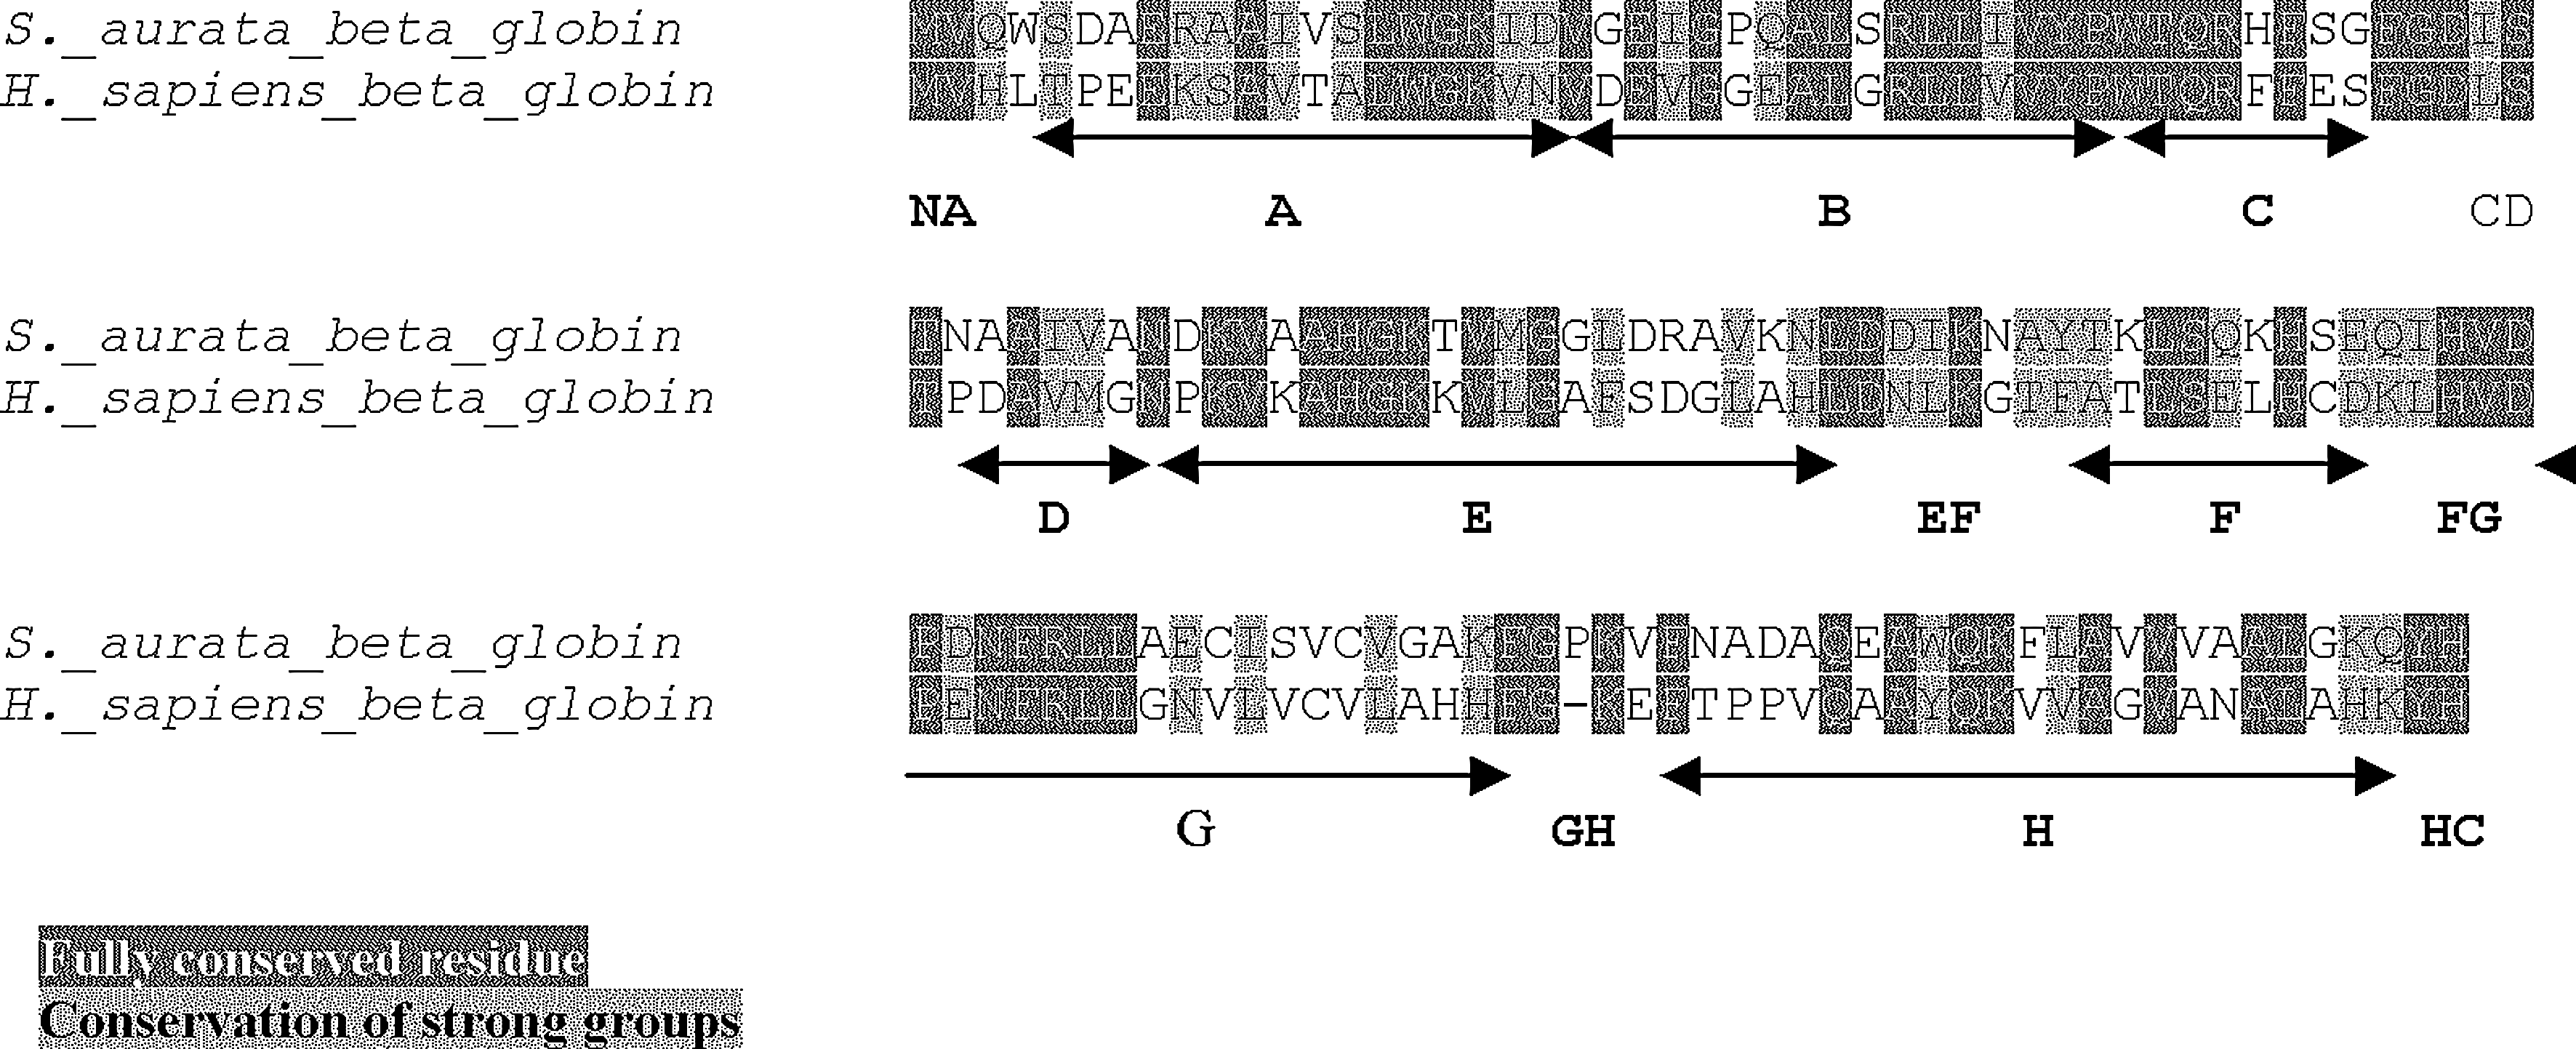
Sparus aurata and Homo sapiens β globins alignment.
The comparison of S. aurata hemoglobin chains with those of humans shows that most of the amino acids of the three proteins are fully conserved (highlighted black in the figure) or exhibit strong group conservation (highlighted gray in the figure). The α1 chain shows the CE portion two amino acids longer and 43 aa in difference (Fig. 4), whereas the α2 chain is one amino acid longer in the CE region and 42 aa in no consensus. The two S. aurata alpha hemoglobins are also different on 37 nonconsensus amino acids. The comparison of S. aurata β hemoglobin with that of humans shows the GH3 Pro insertion and a variation of 43 aa (Fig. 5).
Evolutionary relationships
A phylogenetic relationship was analyzed between S. aurata and other teleostean hemoglobin chains, as listed in Table 1. The data set was used to calculate the best α and β trees using the neighbor-joining algorithm, the maximum likelihood (ML) approach, and the Bayesian MCMC methods. The tree topologies reported in this study are congruent with the neighbor-joining assay (data not shown) and are in agreement with results of previous studies (Giordano et al., 2007; Maruyama et al., 2004b; Stam et al., 1997). The trees of α hemoglobin built by ML and Bayesian inference algorithms were highly similar and showed interesting features, although a very few terminal branches display some exceptions.
Bayesian hemoglobin α chains tree (Fig. 6) appears very well resolved, with values at the nodes upper to 0.5. The tree comprises the outgroup considered in the study and four main groups including at least seven subgroups. According to a previous report (Maruyama et al., 2004b), O. latipes Hbα2 is clustered into the outgroup and seems to be diversified from the teleostean ancestor. The first group includes two homophyletic clusters of some temperate fishes α chains (H. littorale: A. anguilla HbC and S. salar clone 3, O. mikiss, S. salar clones 5–6), whereas the second and third groups appear homophyletics and comprise the remaining non Antarctic α chains, with the some exceptions; interestingly, inside the second group there are two subclusters, one of which comprises both S. aurata α hemoglobins in paraphyletic mode: α1 chain is homophyletic with S. quinqueradiata HbB α chain, whereas the α2 chain is in homophyletic position with Ch. auratus α sequence and in paraphyletic location with the homologue sequence of S. quinqueradiata HbA. The third group clusters all C. carpio α hemoglobins and the α chains of D. rerio Hb1 and C. clarki. The fourth group may be divided into a minimum of two subgroups that include all Antarctic fish α chains and those of three temperate fishes in paraphyletic position: G. morhua, C. kumu, and T. thynnus.

Bayesian phylogenetic tree of Teleostean adult α hemoglobins (Hba) listed in Table 1 (49 Taxa). The amino acid sequences of the α chains were aligned with CLUSTAL W and analyzed with MrBayer software. The Bayesian inference (MCMC: Markov Chain Monte Carlo) evaluation was performed using the Dayhoff substitution model for 106 replicates. The first 25% of the samples were discarded, whereas the results were summarized in a best tree that may be divided in four ingroups. The values at the nodes are their posterior probability (range 0–1), whereas the branch length indicates the distance based on amino acid substitutions per site. The posterior probability of all nodes is good and superior to 0.5. As shown, S. aurata α hemoglobins are positioned in a paraphyletic way and are clustered in the second group. In this tree the position of S. aurata α2 and Ch. auratus α chains show that their related genes are orthologues.
As previously described by Maruyama et al., 2004b, the ML tree (Fig. 7) consists of the outgroup and four main groups with inside at least seven subgroups: its topology is very similar to the Bayesian tree, but some differences may be observed in few terminal branches. Moreover, the ML tree shows a small number of nodes with bootstrap values less than 0.5. The outgroup includes O. latipes α2 protein, whereas the remaining groups are organized as the Bayesian tree. These observations suggest that S. aurata α1 and α2 genes are paralogues; they had a different latest ancestor and were diversified by gene duplication. However, the two α trees display some variances, probably due to their different calculation. The main discordance observable in the ML tree is the homophyletic association between S. aurata α2 hemoglobin and S. quinqueradiata HbA α protein. In this context both Bayesian and ML trees allow only to assert that S. aurata α2 chain shares evolutionary relationships with Ch. auratus and S. quinqueradiata α sequences, but no clear information can be obtained on their mutual position within the trees. Nevertheless, the Bayesian tree appears better resolved and shows the same topology of the neighbor-joining tree (data not shown); thus, it can be speculated that S. aurata α2 and Ch. auratus α hemoglobin genes are orthologues, whereas S. aurata α2 and S. quinqueradiata HbA α genes are paralogues.
Phylogenetic tree of Teleostean adult α amino acid sequences listed in Table 1 (49 Taxa) and built with the Maximum Likelihood (ML) algorithm. After CLUSTAL W alignment, the proteins were analyzed with the PHYML software. The ML inference was carried out using the Dayhoff substitution model with gamma shape parameter set to 1.78 and proportion of invariable sites equal to 0.074. The robustness of ML tree was assessed by the bootstrap analysis with 500 replicates. The number at the nodes are bootstrap values (range 0–1), whereas the scale measures the distance based on amino acid substitutions per site. Only a few nodes show bootstrap values less than 0.5. As the Bayesian tree, the ML tree may be divided in four ingroup: S. aurata α chains are paraphyletic and are clustered in the second group. On the contrary, the ML method shows that S. aurata α2 protein is located in a monophyletic way with the S. quinqueradiata α hemoglobin A and it is paraphyletic with that of Ch. auratus.
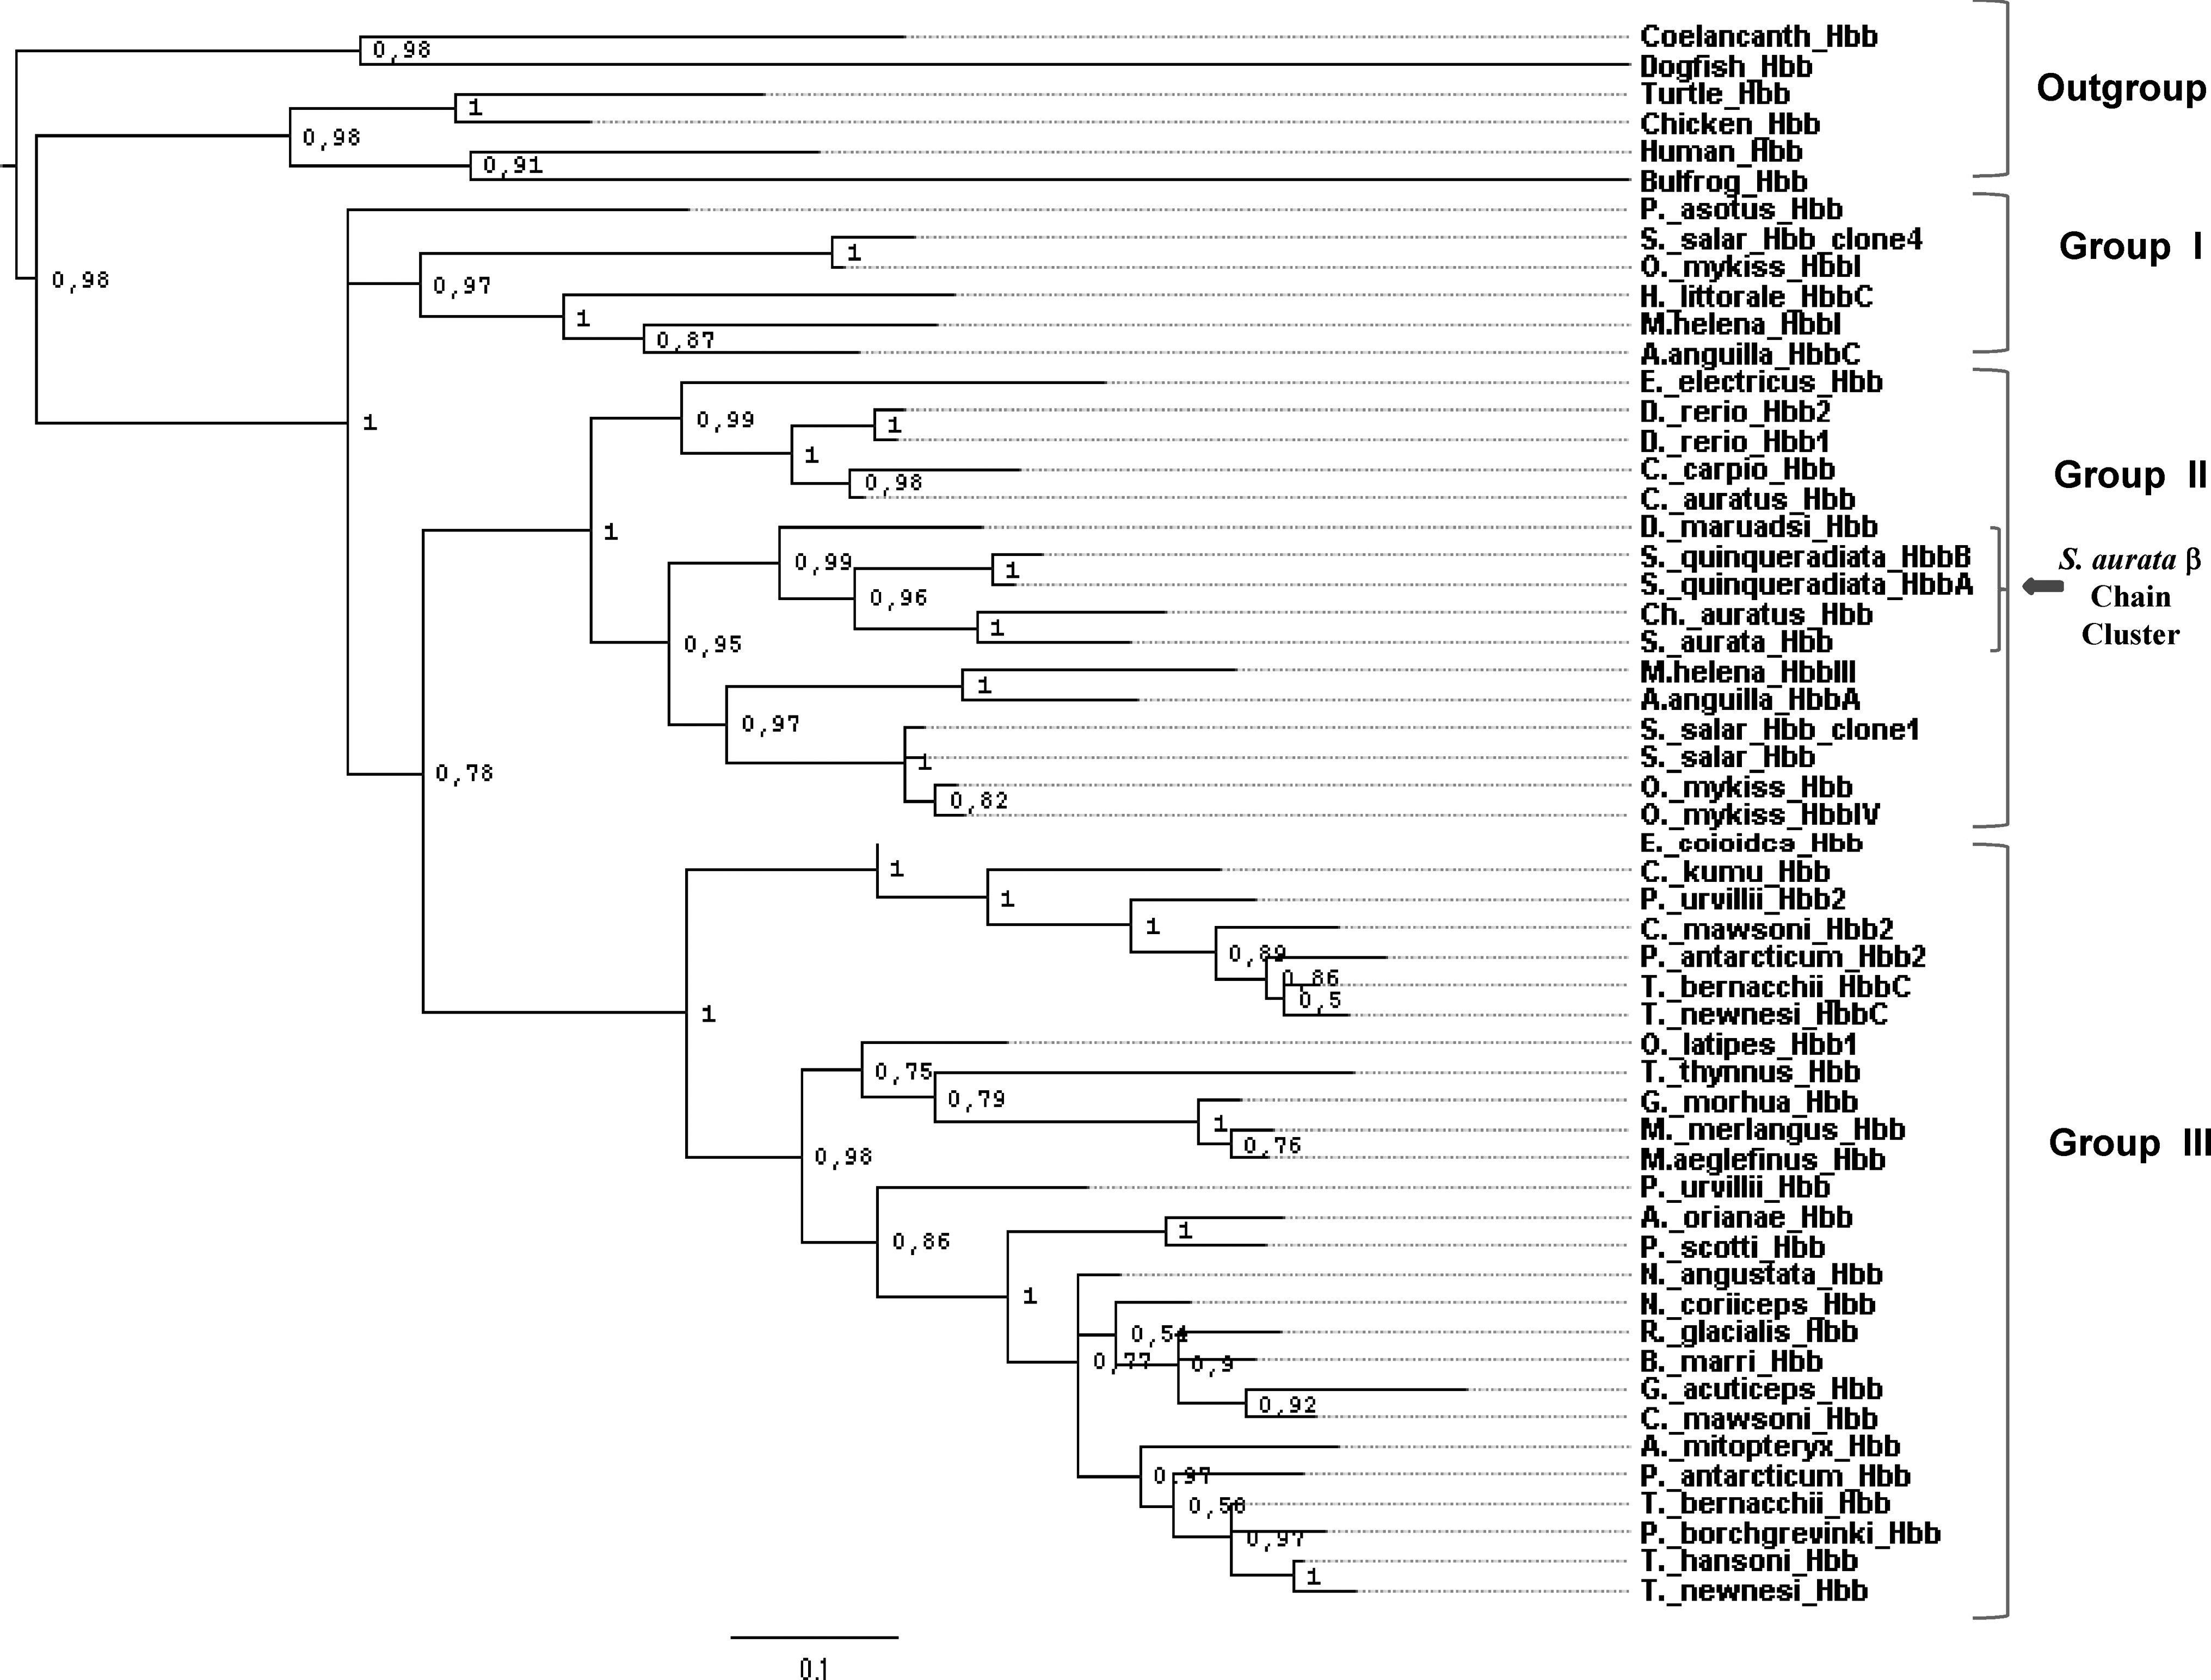
Data on Figures 8 and 9 show the topologies of the Bayesian and ML β hemoglobins, which appear to be somewhat similar to that of α proteins. The Bayesian β tree (Fig. 8) is very well resolved, with node values upper to 0.5, and comprises three main groups and at least seven subgroups. The first group follows the outgroup and comprises the β hemoglobins of some temperate fishes (P. asotus, S. salar clone 4, O. mikiss HbI, H. littorale HbC, M.helena HbC, and A. anguilla HbC), whose the sequences of M. helena and A. anguilla are homophyletic. The second and third group are homophyletic and each one may be divided in three clusters, that include the β globins of most temperate fishes. The second cluster of group II comprises S. aurata and Ch. auratus β protein in homophyletic position. The three clusters of group III comprise β chains of all Antarctic fishes and also of the temperate fish G. morhua, C. kumu and T. thynnus. Thus, the hemoglobins of these last fishes share strongly evolutionary relationship with those of Antarctic fishes. The structure of these last clusters is the following: the first is homophyletic with the second and the third; these latter are, in turn, both homophyletic. The strong relation between O. latipes and T. thynnus showed inside the second subgroup is in agreement with the study of Maruyama et al. (2004b).

Phylogenetic tree of Teleostean adult β hemoglobins (Hbb) listed in Table 1 (55 Taxa) and analyzed by the Bayesian inference method. The alignment of the sequences was carried out by the CLUSTAL W software and inferred with the Markov Chain Monte Carlo (MCMC) algorithm with MrBayer program. The substitution model was Dayhoff for 106 replicates. After discarding the first 25% of the samples, the results were summarized in the best tree as shown in the figure. The tree is organized in the outgroup and three main ingroups. The numbers at the nodes are their posterior probability (range 0–1), whereas the scale indicates the distance based on amino acid substitutions per site. The posterior probability of all nodes is good and upper to 0.5. S. aurata β chain is strongly closed in a cluster (second subgroup) and evolutionally related to Ch. auratus β hemoglobin.
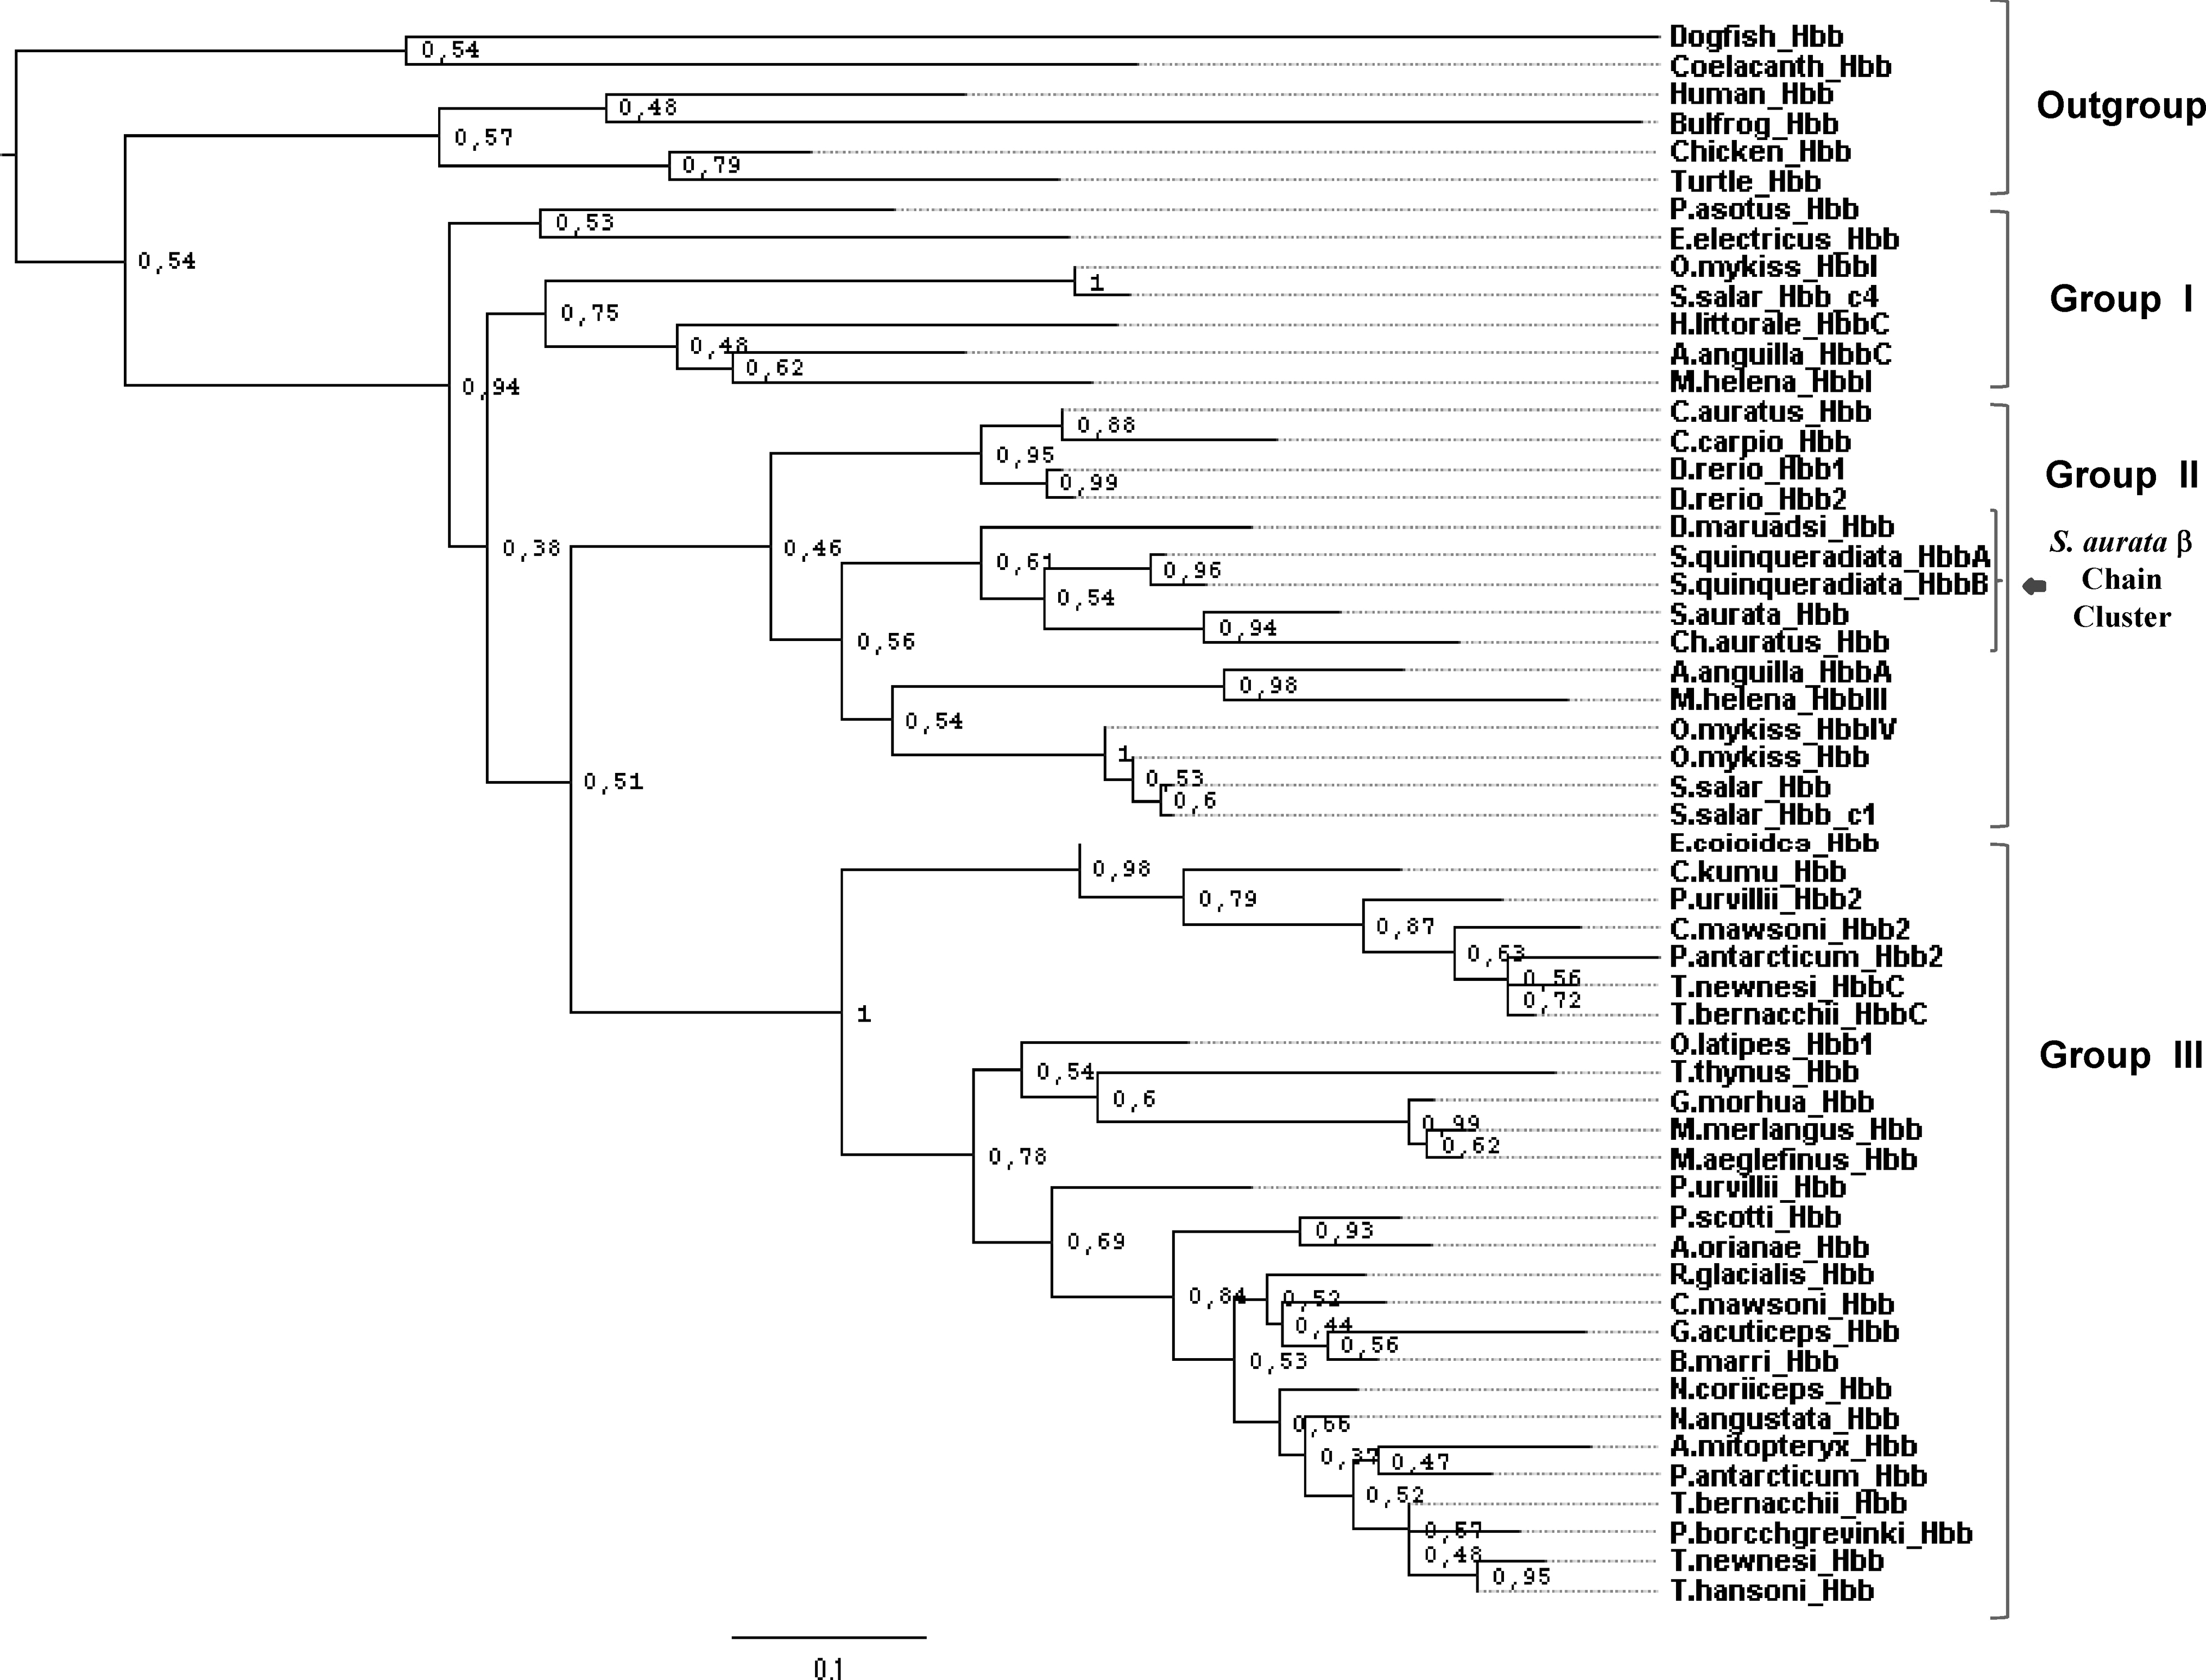
Maximum likelihood (ML) phylogenetic tree of Teleostean adult β hemoglobin sequences (Hbb) listed in Table 1 ( 55 Taxa). The alignment of the proteins was carried out by the CLUSTAL W program, whereas the analysis was conducted by the PHYML software. The substitution model applied was the Dayhoff with gamma shape parameter set to 1.84 and proportion of invariable sites equal to 0.092. The best ML tree was evaluated by the bootstrap test with 500 replicates. The numbers at the nodes are bootstrap values (range 0–1), whereas the branch lengths indicate the distances based on amino acid substitutions per site. The figure shows that a very few bootstrap values less than 0.5 are present in the tree. As the Bayesian tree, the ML phylogram comprises the outgroup and three main ingroups. S. aurata β chain is solidly clustered in a subgroup (the second) and evolutionally related to Ch. auratus β hemoglobin.
Data on Figure 9 show the β ML tree, which is topologically very similar with the β Bayesian tree. The ML tree is well resolved in its structure, with values at few nodes less than 0.5. The ML β tree is organized in three subgroups that show the same organization of the Bayesian tree. Therefore, the three algorithms used to built the phylogenies of Antarctic and temperate fishes β chain produced the same results. These observations suggest that S. aurata and Ch. auratus β genes are orthologues.
On the basis of the Bayesian and ML trees evaluation, it is possible to assert that S. aurata and Ch. Auratus α2/α chains together with the β proteins followed the same diversification from a common ancestor, while S. aurata α1 chain shares a latest common ancestor with S. quinqueradiata HbB α subunit.
Discussion
Structural and functional aspects
The β chain of Sparus aurata globin consists of 147 residues, as in O. mykiss HbIV, C. carpio, and Danio rerio hemoglobins (Petruzzelli et al., 1984), and all these tetrameric Hbs are characterized by the presence of the Root effect (oxygen affinity and cooperativity depend on pH) (Berenbrink et al., 2005; Brunori, 1975; Campo et al., 2008; Gillen and Riggs, 1972). Instead, there is a difference of one residue from mammalian hemoglobins and also from trout HbI. In the hemoglobin component of the latter, the oxygen binding curve is cooperative and the organic phosphate effect is completely absent (Brunori, 1975). If the percentage sequence differences for α and β chains of fishes hemoglobins is compared (Tables 2 and 3), one can observe that there are less differences between hemoglobins having the Root effect with respect to hemoglobins without it, but within the same erythrocyte. The observation that the β chain from O. mykiss Hb IV is significantly more similar to the corresponding chains of C. carpio and S. aurata than O. mykiss Hb I indicates that evolutionary relationships between different species based on a few sequence comparisons without additional analysis may lead to equivocal conclusions. A similar equivocal conclusion could derive considering the comparison of less α chain sequences.
In the Hbs displaying Root effect, there is a pronounced and parallel decrease of both, ligand affinity, and cooperativity as the pH becomes more acid. The hem-hem interactions, generally present at alkaline pH values, tend to progressively disappear as proton concentration increases (at low pH, the Hill coefficient value—a descriptor of the character of the binding process—reaches 1 or even less). Values of Hill coefficient below 1, which have been reported for fish hemoglobins at low pH, may be taken as an indication of either the presence of negative heme–heme interactions or independent sites with different affinities for the ligand. The drop in Hill coefficient may be related to intrinsic non equivalence between α and β chains affinity, which become more and more different as pH decreases.
The decreased cooperativity may be ascribed to a progressive stabilization induced by protons of a “low affinity” state of the tetrameric hemoglobin molecule (T state) according to a classical two-states model. This model assumes that all vertebrate hemoglobins are in an equilibrium between two distinct quaternary states: the deoxy or tense (T) state (with a low affinity for oxygen and a high one for protons) and the oxy or relaxed (R) structure where these relative affinities are reversed.
The presence of Ser93β in S. aurata, similarly in some fish Hbs, which exhibit the Root effect, is in accordance with the stereochemical interpretation of the Root effect proposed by Perutz and Brunori (1982). These authors proposed, based on sequence comparison, that the replacement of Cys-93β (conserved in all mammalian Hbs) by serine might explain the Root effect, because the OH of the serine residue would play an important role in hydrogen bond formations with the terminal Hisβ, thus stabilizing the T state. This was also supported by the absence in human hemoglobin and O. mykiss HbI (the hemoglobin which shows invariance of the O2-binding curve with pH), of serine in 93β position. In addition, in trout hemoglobin I the terminal His is replaced by Phe.
It was subsequently shown (Nagai et al., 1985) by site-directed mutagenesis that the single replacement of Cys-93β-Ser is not sufficient to change human Hb into a Root effect Hb.
Subsequently (Mylvaganam et al., 1996), crystallographic studies in CO-liganded Spot hemoglobin identified seven key aminoacid residues (Serα1, Gluα140, Trpβ3, Serβ93, Gluβ94, Arg β144, and Glnβ145) specific to Root effect Hbs and four additional residues (His β147, Tyrβ146, Serβ89, Valβ1) conserved in most hemoglobins for assembling positively charged clusters across the β1β2 interface in the R state of the protein. It is speculated that at low pH the positive charge present in this cluster would destabilize the R state, thus inducing oxygenation. These 11 key residues are functionally conserved in most or all Root effect Hbs (Bonaventura et al., 2004) of known sequence. In the case of S. aurata chains only two residues in position α140 and β144 are not conserved; in β144 there is a replacement (Arg β144-Lys) (Table 4), whereas in the α140 a different replacement is present for both the α1 and α2 chains, Gluα1140-Ser, and Gluα2140-Arg.
By comparing structures of two Hbs (one a Root effect Hb from T. bernachii and the second a non-Root effect Hb from T. newnesii) in the R state at pH 8.0, researchers at the University of Naples (Mazzarella et al., 1999) identified in both, essentially identical positive clusters to those found in the Spot structure. These results support the idea of the importance of the T state in determining the differences in proton uptake among these three proteins.
Studies (Camardella et al., 1992; Ito et al., 1995) involving both the R- and the T- state crystal structures of the Root effect Hb from the Antarctic fish T. bernachii (HbTb) have shown that a partial contribution to the Root effect is provided by the unusual interaction between aspartic acid side chains (Asp95α and Asp101β), which are present exclusively in the T-state. It has been suggested ( Mazzarella et al., 2006a) that the interaspartic hydrogen bond at the α1β2 interface is the minimal structural requirement for the Root effect in fish hemoglobin. In S. aurata is conserved Asp101β, whereas the Asp95α is present only in α2, and in α1 there is a replacement with Arg.
Finally, Mazzarella et al. (2006b) reported data indicating that His55α (there is a replacement in this position in α1 and α2 S. aurata chains with Pro and Gln, respectively) can contribute to the Root proton in HbTb and that histidine residues could play a role in modulating the strength of the Root effect. In particular, the authors suggested that the His146β, proposed as fundamental in causing the Root effect, may give only a small contribution.
In conclusion, the emerging idea is that the structural determinants, at least for a part of the Root effect, are specific for each Hb endowed with this property. In all cases studied, there is a growing awareness that the Root effect appears to require not only residues of direct function significance, but also amino acids necessary to provide the correct microenvironment for the expression of these functional effects. However, as pointed out by Brittain (2005), to have a detailed definition of determinants for the Root effect it is necessary structural information on R- and T- states at different pH values.
Phylogenetic analysis of S. aurata hemoglobin subunits
The above mentioned findings resulting by comparing a low number of protein sequences may be overcome by the evaluation of phylogenetic trees built with a substantial number of hemoglobin subunits. In the present study we built phylogenetic trees inferred from the data set using three different methods. Both α-β trees were congruent and in accordance with previous studies (Giordano et al., 2007; Maruyama et al., 2004b; Stam et al., 1997). All phylogenetic trees were substantially similar and suggest interesting observations. According to the Maximum Parsimony study ( Stam et al., 1997), the comparison of outgroup chains with the investigated teleostean proteins shows a significant degree of diversification, which indicates that several gene duplications occurred because this fish species diverged from the other vertebrates and from each other. Although our understanding of biochemical and functional features of teleostean hemoglobins are still insufficient, we may speculate that the large diversification of hemoglobin subunits in fish species was due by their life style and the adaptive necessities within the changeable aquatic environment. In fact, accordingly to previous data (Maruyama et al., 2004b), our results demonstrate that temperate C. kumu, T. thynnus, and G. morhua α and β chains are clustered with the Antarctic fish sequences; these fishes, notoriously migratory fishes, have had the necessity to adapt in an adequate way to the marine environments. In this context, selective mechanisms allowed them to evolve their hemoglobins in an appropriate manner capable of responding to the different metabolic requirements.
Among teleosts, some specimen contain a single major hemoglobin fraction and often a second minor component less than 5%. Other fishes also contain further hemoglobin components present in traces, whereas only two major fractions are frequently observed in other specimens. In our previous study (Campo et al., 2008) we identified two major S. aurata hemoglobin fractions using a high-performance liquid chromatography (HPLC) method. For this reason we are unable to classify the phylogenetic groups in Anodic and Cathodic hemoglobins, as previously reported (Maruyama et al., 2004b). The two hemoglobin fractions studied showed different values and were named Hb I and Hb II (mean levels = 35 and 65%, respectively). After fish-farming at very low oxygen concentration we observed that the percentage of S. aurata HbII decreased to the mean value of 49%, whereas the mean level of HbI increased to 51%. These previous observations are in agreement with the data related to the two α and one β genes identified in S. aurata. Furthermore, in our previous study we observed that, after the hypoxic animal exposure, gene expression of the S. aurata β gene remained unchanged, whereas the levels of α2 hemoglobin mRNA drastically decreased and those of α1 chain proportionally increased. These data suggested that S. aurata HbI and HbII components could be functionally different. Therefore, we previously concluded that the stability of fish hemoglobin tetramers together with their autoxidation-reduction cycles may involved in the adaptive molecular mechanisms (Campo et al., 2008).
By the obtained data on the S. aurata hemoglobins we may achieve the following conclusions:
S. aurata α1 and α2 hemoglobin chains could be functionally different, although in vitro assays showed that the oxygen equilibrium curve for both hemoglobin components was almost similar at pH 7.0; both Hb I and Hb II were composed of two β chains linked to two α1 and two α2 chains, respectively.
These conclusions are in agreement with the S. aurata α1 and α2 chains evolutionary history; in fact, the phylogenetic analysis of both α hemoglobins shows that they are paralogous, whereas the length of their branches suggests that α1 gene diversified more recently compared to the α 2 chain. The phylogenetic analysis allows also to observe that the more recent diversified α1 gene is the gene responsible of HbI percentage increase under extreme conditions farming. A similar evolution degree is observed for the Ch. auratus and S. quinqueradiata hemoglobins. Although S. quinqueradiata has two different β genes, it is interesting to note that both β proteins display a high degree of homology as consequence of a very recent diversification.
Conclusions
S. aurata, a member of the Sparidae family, is a fish capable of adapting to different aquatic environmental conditions, such as fish-farming and public aquaria. Studies focused on a better knowledge of its genomic and proteomic profile may be helpful to understand the evolution of its metabolic features. The anatomy of S. aurata globin genes is typical of vertebrates, whereas the related proteins show a low degree of homology with those of other animals, including fish species. This diversity is especially due to numerous amino acid variations. As well as many fish species living inshore in the Mediterranean and Atlantic sea, adult S. aurata exemplars express three paralogue hemoglobin chains, two α chains and one β chain, which determine the formation of only two major hemoglobin fractions (Campo et al., 2008).
Previous data (Giordano et al., 2007; Maruyama et al., 2004b; Stam et al., 1997) showed that the teleostean hemoglobin sequences could be derived from a common ancestral gene becuase their diversification occurred from other vertebrates. This observation is obviously deduced from the analysis of phylogenetic trees that were built using three different methods.
In this study, the phylogenetic trees of teleostean hemoglobin subunits were built for the first time using the Bayesian inference method, and compared with those obtained by maximum likelihood algorithm, because the latter was considered more appropriate for the evolutionary study of these proteins. The trees obtained using these methods are very congruent and allow to reach the same conclusions, although the trees obtained by the Bayesian calculation are better resolved. S. aurata α1 and α2 hemoglobins show a low degree of homology on both nucleotide and amino acid sequences (62 and 59%, respectively); they are evolutionarily paralogues, although comparative analysis of these chains with those of other fish species, such as O. mykiss and C. carpio, reveal apparently low significant differences in their functional properties. However, the amino acid sequences of S. aurata alpha globins are less comparable with other functionally well-known αchains and, in any case, a study based mainly on the structural diversities or on in vitro assays is not enough to draw functional conclusions. Thus, hypothesis on S. aurata α chains actual roles within the HbI and HbII fractions need further in vivo studies.
The evolutionary history of S. aurata hemoglobin chains is similar to that of other species considered in this study, such as Ch. auratus and S. quinqueradiata. In fact, the phylogenetic trees show that the α2 and β chains appeared earlier respect to the α1 chain. Therefore, the most recent evolutionary mechanisms were able to affect only the diversification of α hemoglobins in this fish. These observations suggest that the two α chains may affect different functions in S. aurata hemoglobin components. This hypothesis is supported by the evidence that fish exposed to hypoxic or low salt conditions considerably modified the percentage of both hemoglobin fractions together with the two α subunits gene expression (Campo et al., 2008).
Therefore, it is possible that S. aurata hemoglobin α chains may be related to the huge capacity to adapt themselves to the most diverse marine environments, fish-farming included. The strong adaptive capability to tolerate extreme conditions in the environment may confer to this fish the capacity to overcome several dietary and reproductive difficulties. In addition, the ability to rapidly change the concentration of the two hemoglobin fractions confers to S. aurata the capability to survive in environments with large fluctuations in osmotic pressure, low oxygen concentration, or diverse saline conditions. Furthermore, it is also able to adapt its homeostatic system to different temperature changes due to marine currents. These features taken together allow S. aurata to circumvent modern fishing techniques.
Footnotes
Author Disclosure Statement
The author declares there are no conflicts of interest.