




Abstract
Abstract
Copy number variation (CNV) is one of the most profound forms of somatic DNA changes that underlie most human cancers. However, the degree of complexity within and between DNA and mRNA variations in cancer cohorts has yet to be fully characterized. Here we characterized the connectivity of CNV/CNV and its contribution to transcriptome in human cancer cell lines. Strikingly, we found there is a significant nonrandom correlation of many unlinked DNA loci and also a significant association between CNV and mRNA expression in cis and in trans (called eCNV). Both distributions of DNA/DNA and DNA/mRNA associations exhibit a scale-free structure showing that, for DNA/DNA, a few loci correlate to many other loci, whereas most loci correlate to only a few loci; and for DNA/mRNA, certain chromosomal loci associate with many mRNAs and that many mRNAs are controlled by more than one locus. This suggests that a small number of DNA loci act as hubs in a hierarchical structure that is highly nonrandom in nature, and genes linking to these hot spots tend to be involved in similar biological functions. Derivation of highly connected structures suggests a process of undirected copy number changes followed by selection of those advantageous to tumor cells during tumorigenesis. Given that the cohort includes many tissue types, our observations may identify a common and important underlying structure present in human tumors.
Introduction
Materials and Methods
Cell lines
One hundred thirty-one cancer cell lines from Caucasian donors were obtained from American Tissue Cell Culture (ATCC, Rockville, MD, USA), DSMZ, or Sanger Center. These cell lines were derived from various tumor tissues (31 colon, 26 leukemia/lymphoma, 20 lung, 15 skin, 6 breast, 6 bladder, 5 pancreas, and 22 from other tissues including stomach, brain, prostate, cervix, bone, liver, tongue, and uterus (see Supplementary Table 1). To minimize potential differences in sample preparation, approximately 8 μg of genomic DNA from each of the human tumor cell lines was extracted from cultured cells by using Puregene kit (Gentra, Minneapolis, MN, USA).
Array CGH data
The Parallele MIP (Molecular Inversion Probe) platform (Wang et al., 2005) was used to identify CNVs in the cell lines. MIP assays were carried out in 96-well plates using the MegAllele genotyping kit (ParAllele BioScience, San Francisco, CA, USA) and DNA labeling, hybridization, and posthybridization processing, scanning, and image analysis were performed as previously described (Wang et al., 2005). A total of 17,066 single nucleotide polymorphism (SNP) markers were genotyped by using the MIP platform. Derivation and normalization of copy number for each markers was performed exactly as described (Wang et al., 2005). To compute copy number of each marker, for homozygous clusters, only the signal in the relevant allele was used, whereas for heterozygous clusters, both signals were used (summing them together). The copy sum data for each locus was determined by comparing to cancer free reference samples. To reduce noise copy sum data for a marker in a sample was smoothed by using adjacent markers within 300 kb up- or downstream.
mRNA expression data
The integrity of the total RNA from the cell lines was first assessed through analysis on an Agilent 2100 Bioanalyzer (Agilent Technologies, Palo Alto, CA, USA), then labeled, amplified, and fragmented to an average size of approximately 50 to 100 nucleotides before hybridized to Agilent Human 3.0 A1 arrays (Hughes et al., 2001), which contain 23,720 unique 60-mer oligonucleotides as probes manufactured by Agilent Technologies. The cell line samples were in the Cy5 channel, whereas the reference pool was in the Cy3 channel. Fluorescence intensities of the scanned images were quantified, normalized, and balanced, and then gene expression was measured relative to a common reference RNA pool (Human Universal Reference RNA, Stratagene, La Jolla, CA, USA), which provides a more reliable comparison of mRNA expression data within and between experiments (Novoradovskaya et al., 2004). The mRNA expression data was then analyzed with the Resolver System by using Rosetta Error Model (Weng et al., 2006). The data described in this article has been deposited into the NCBI GEO database under accession number GSE13598: (www.ncbi.nlm.nih.gov/geo/query/acc.cgi?acc=GSE13598).
Tissue/cancer type effect
Previous CNV analyses of cancers (see a recent review, Kallioniemi, 2008) pointed out that there are tissue (or cancer type)-specific CNV that we need to control in this study. To assess the tissue/cancer type effect on CNV, we first assigned each cell line to one of the eight tissue types of origin based on available annotations, then performed a one-way analysis of variance (ANOVA) analysis on every marker. Permutations were done by randomizing the tissue assignment. Then the original CNV were adjusted by Z-score transformation to normalize the tissue effect (see adjusted CNV data in Supplementary Table 2). In an analogous manner mRNA expression data was also adjusted for tissue type.
DNA/DNA correlation and DNA/mRNA associations
The degree of DNA/DNA correlation was determined by using pairwise Pearson Correlation of log2 transformed, tissue-adjusted copy number data in a pair-wise fashion. Mlratio (ratio of the mean log10 intensity) of gene expression was used in a similar fashion when calculating DNA/mRNA association. For cis-acting effect, we matched mRNAs probes (mid point) on the Agilent 3.0 A1 expression arrays with the closest DNA copy number marker within 5 megabases. To assess the significance of DNA/DNA or DNA/mRNA correlations, we ran the same analysis on permutated datasets, in which the links between CNV and their original cell lines were randomly shuffled. Because this study focused on relationships among unlinked CNV, when permuting the DNA copy number data, we preserved the intrachromosomal marker correlations.
Statistical significance of mRNA:DNA:DNA associations
For mRNAs significantly associated to at least two unlinked loci, we used a forward stepwise procedure to determine how those loci contribute to each mRNA's variance. First, each mRNA was regressed (as denoted by y) to the most correlated marker L1 (p-value < 1e-3) in model y = L1. The residuals from this regression were then fitted to the second locus (L2), which correlates to L1 but is unlinked (on a different chromosome). In many cases there were multiple L2s used with the proviso that they were significantly correlated to L1 (|r| > 0.25). This procedure was run for all mRNAs and the portion of significant p-values from the second regression from the all possible mRNA:L1:L2 trios, was summarized. For comparison, exactly the same procedure was run on the permuted data.
Results
Correlations among unlinked CNV
Because multiple tissue types were used in this study, we first evaluated if any loci significantly associated with tissue type: 6.8% of 17,066 CNV markers were found to be associated with tissues type (p < 1e-4, FDR < 0.01). The appearance of tissue specific CNV suggests either that generation of CNV is tissue specific by locus or perhaps more likely that CNV at certain loci is selected for in certain tissue types. We listed those tissue-specific CNV markers in Supplementary Table 3. Because the majority of CNV does not appear to be tissue specific (>93%), the observations are more consistent with selection. Subsequent results are based on the tissue-effect adjusted CNV/mRNA data.
We next investigated if CNV markers located on the same (linked) or distinct chromosomes (unlinked) are correlated in the cancer cell lines. Using a cutoff of p-value < 3.9e-5 (|R| > 0.35, FDR < 0.1), a large number of both intrachromosomal and interchromosomal correlations were seen (Fig. 1, lower right half). The intrachromosomal linkage was expected due to the large scale of many amplifications and deletions relative to the size of the chromosome, and has been observed in other studies (Bussey et al., 2006). It is interesting to note that the intrachromosomal correlations in many cases define more than one large CNV subregion per chromosome (e.g., chromosomes 1, 3, and 6). In addition to the expected intrachromosomal correlations we also observed many interchromosomal correlations (for the complete list, please see Supplementary Table 4). For example, a region on chr20 significantly correlated to certain regions on chromosomes 3, 11, and 18 (Fig. 1, lower right half, in red circles).
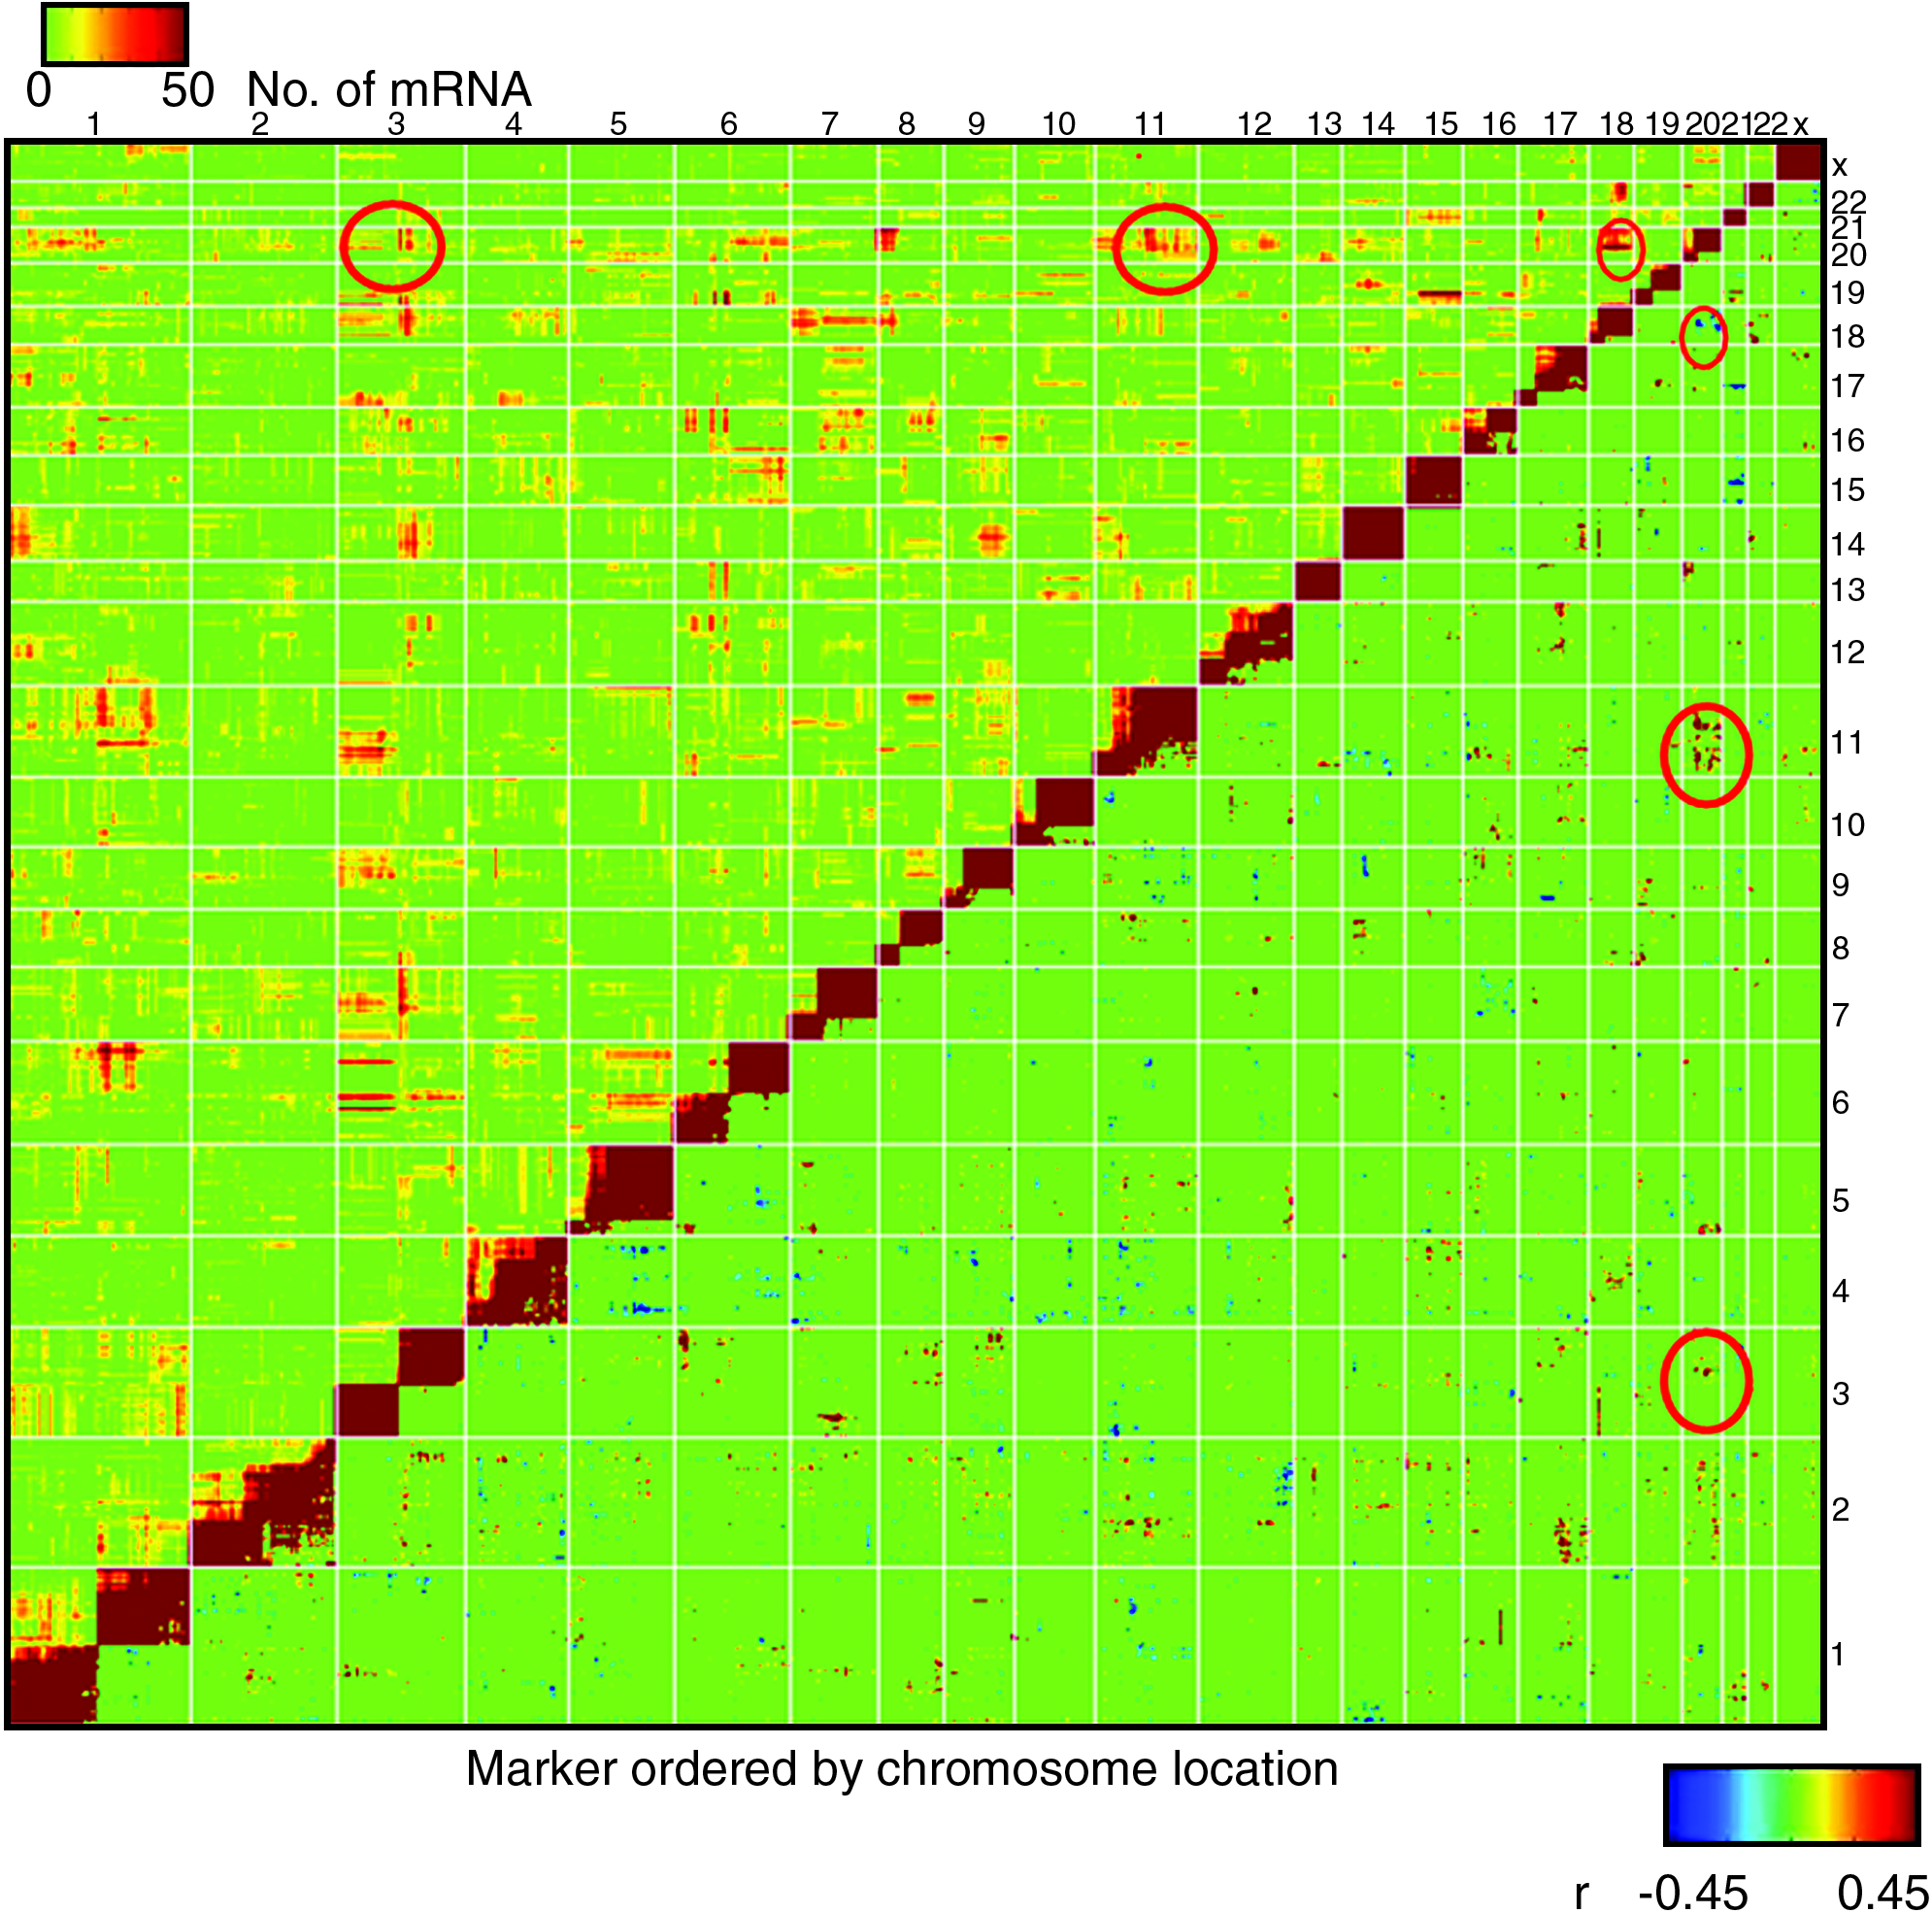
Pair-wise CNV/CNV correlation and CNV/CNV/mRNA association. Markers are ordered by chromosomal positions through the genome on the X and Y axes. The lower right half of the graph shows the significance of correlations between all pairs of CNV markers (red indicates positive correlation and blue for negative correlation). The upper triangle shows the heat map of number of mRNAs significantly correlated to markers on two different loci. This is readily observed many of the interchromosomal DNA/DNA correlations are also associated with same sets of mRNAs (several examples are highlighted in red circles).
eCNV: cis-acting and trans-acting control of CNV on mRNA variations
We next sought to establish if and how much mRNA variation is controlled by CNV in the human cancer cell lines. A common type of mRNA control is where variance in or near the gene encoding an mRNA strongly controls its level of expression, that is, a cis-acting effect. We assessed cis-effects by testing for association for every mRNA to the CNV marker closest to where the coding gene resides (see Fig. 2A). As shown across the panel of cell lines, 2,325 mRNA/CNV pairs (approximately 10% of total 23,404 genes on the mRNA expression array) were found to show strong cis-acting effects (R or correlation coefficient >0.5 with p-value < 1.2e-9, and FDR < 0.001). Therefore, a gene with R > 0.5 has at least 25% of its mRNA expression variance attributable to its cis CNV. The distribution of the data shows a pronounced bias toward positive correlations, indicating that where strong cis-effects occur, they most commonly result from a direct and simple relationship of DNA and mRNA copies per cell, which agrees with other studies (Lee et al., 2008; Pollack et al., 2002; Wang et al., 2006). A number of strongly cis controlled mRNAs with known connections to cancer were found, including ABL1, CCNE2, CDC6, CHEK1, HIF1A, PCNA, PTEN, and TOPB, among others. The strongest association was found for PLAA (phospholipase A2-activating protein, a possible tumor suppressor) with R = 0.87 (Fig. 2B). GO term (Gene Ontology) enrichment analysis (Khatri and Draghici, 2005) revealed that the cis-acting genes were enriched in a number of interesting Biological Process terms, including macromolecule metabolic process (p-value < 1.2e-48), mRNA processing (p-value < 2.3e-23) or cell cycle (p-value < 1.3e-17). These results suggest that the cis-gene lists seem to be specifically related to the cancerous growth of the cell and other functions.
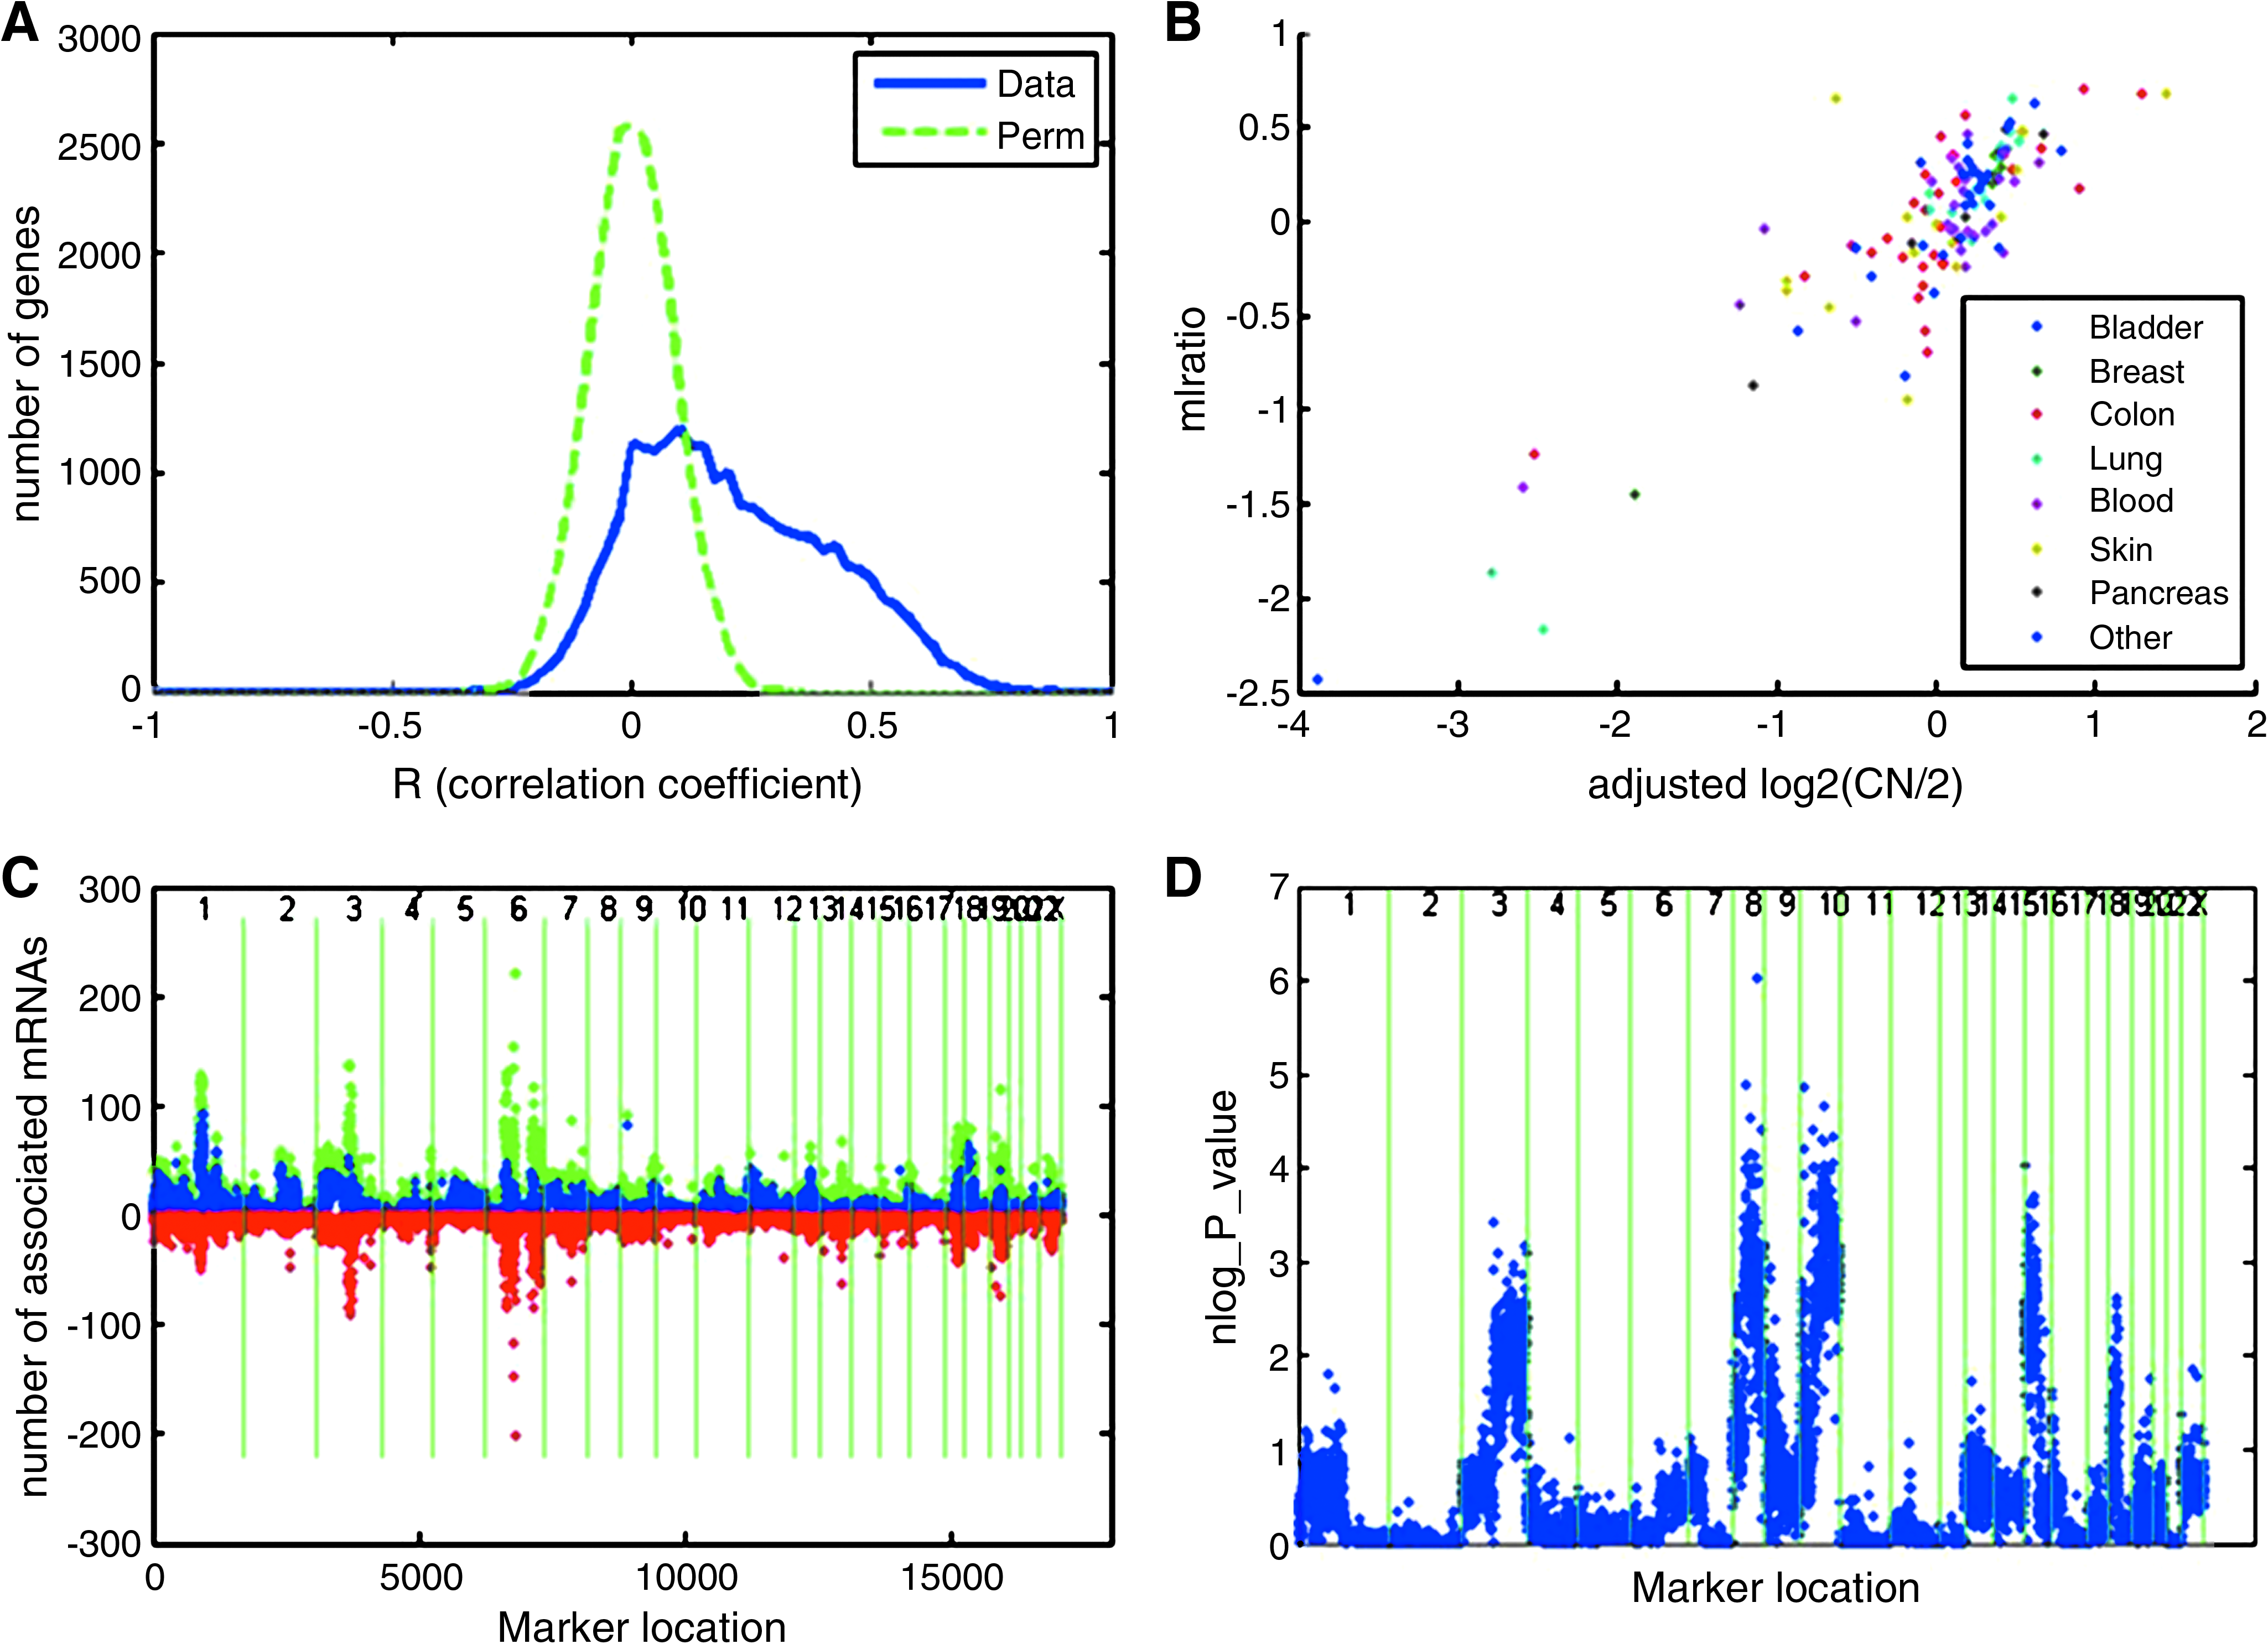
CNV/mRNA association. (
Although strong cis-acting effects are common, for most genomic regions (even those containing many strong cis-acting effects), the majority of mRNAs show only modest to insignificant correlation to their cognate DNA locations, which indicates that other transcriptional effects are important as well. In addition to cis regulatory effects, mRNA expression can be controlled by DNA variation at locations throughout the genome, that is, trans-acting control (Lee et al., 2008; Park et al., 2008). Therefore, we searched for significant associations between all mRNA and all CNV markers. Using the same significance cutoff for defining unlinked CNV/CNV correlations (p-value < 3.9e-5, |R| > 0.35, FDR < 0.1), we found a large number of both positive and negative CNV/mRNA associations. Many associations were found including a number of CNV regions associated with dozens to hundreds of trans-genes (Fig. 2C). Together with the cis-effect, there are many DNA loci showing that their CNV are associated to mRNA expression, which we call eCNV, similar to eSNP or eQTL (Schadt et al., 2005). For those with more than 40 trans-associated genes, which were very unlikely to have occurred by chance (FDR < 0.02), we call those eCNV as “hotspots” and found the mRNAs linked to them share some common functions related to cancer biology (see the top host spots in Supplementary Table 5, and network/function analysis in Supplementary Fig. 1 and Supplementary Fig. 2). “Hotspots” that control the expression of many mRNAs have been noted before in noncancer data sets, but in those cases their presence has generally not been significantly different than permuted data unlike here (Emilsson et al., 2008; Schadt et al., 2005). To further determine if mRNAs linked to the same locus have anything in common in terms of cancer biological function, we performed an enrichment test for a prognostic gene sets (541 genes in total) from a breast cancer cohort (van't Veer et al., 2002) onto this data and found that they were preferentially controlled by certain loci on chromosomes 3, 8, 10, and 16 (p-value < 1e-4, with FDR < 0.1, see detailed gene list in Supplementary Table 6), indicating consistency of coregulation between in vitro and in vivo (Fig. 2D). The 541 gene set is enriched for the “cell cycle” GO term (p-value = 3.9e-14), which have been shown in multiple circumstances to be relevant to tumorgenesis.
Highly structured and hierarchical relationships within and between DNA and mRNA
To further investigate the relationships within the between DNA and mRNA, we plotted the distribution of significant CNV/CNV correlations between unlinked DNA loci in a log/log scale (Fig. 3A). Besides the distinction between the observed data and permutations (systematically more connections among unlinked loci in observed data), the plot shows a clear scale-free feature that has been observed in many other biological settings (Almaas, 2007). With more stringent cutoffs for correlation, we found more extreme effects on both ends of the distribution. For the log/log plot, we can see that whereas most loci are correlated to a small number of other loci, there exists a fraction of loci correlated to many others that is exemplified by markers on chromosome 20, which correlated to markers on a number of other chromosomes (Fig. 1). The hierarchical distribution of unlinked DNA/DNA correlations suggests that these observations cannot only be explained by translocations per se, in that some loci are correlated to many others and only pairwise correlations could be explained by chromosome rearrangements. Besides, if translocation is the major reason for the significant correlations between unlinked loci, we would expect to see most of the correlations to be positive, which is not the case because there are about 43% of the unlinked CNV/CNV correlations (|R| > 0.35) are negative.

Log/log plots for significant (|R| ≥ 0.35) DNA/DNA associations (
Similar to the CNV/CNV plot, the log/log graph (Fig. 3B
We also see that the previously described CNV/CNV correlations coincide with some of the eCNV hotspots, indicating the potential for independent loci coordinately affecting the expression of common sets of mRNAs (see Fig. 1 above the diagonal). Given the common effect of these loci (regulation of the same sets of mRNAs), we further assessed whether these correlated but unlinked DNA/DNA loci significantly contribute independently to the mRNA variance by using the stepwise regression procedure described in Materials and Methods. By comparing to permutations, the observed data shows an enrichment of significant p-values for the second locus when the two loci are correlated (Fig. 4). This indicates that in the majority of cases two strongly correlated unlinked DNA loci both contribute significantly to the gene expression variation within those DNA/DNA/mRNA trios. Therefore, this could be an explanation of at least some correlations of unlinked loci, that is, that the combinations were selected because of they coregulate the expression of the same gene(s). Overall, the nonrandom CNV correlation between unlinked loci and their association to mRNA variation reveals a hierarchical structure where a few DNA loci account for a large part of the observed mRNA expression variation.

Coregulation in CNV/CNV/mRNA trios. This shows, in 1,000 permutated data sets, distribution of portions of number of observed significant second regressions in a stepwise regression procedure involved correlated but unlinked CNV and mRNA associated to at lease one of two loci (called CNV/CNV/mRNA trios). None of 1,000 permutations gave greater values than the real data (marked in blue).
Discussion
In this study, we investigated the relationship among CNV from unlinked DNA loci and its contribution to mRNA expression in collection of 131 cancer-derived cell lines from a broad spectrum of tissue types. For normal cells the CNV pattern observed is thought to be affected by both mutational and selective effects (Cooper et al., 2007). A recent study (Emerson et al., 2008) suggested that the pattern of CNV in Drosophila melanogaster were shaped by natural selection. In cancer, variance is generated as a result of defects in DNA replication, recombination, repair, and/or chromosome segregation, in a largely undirected manner. The significant correlations among unlinked DNA loci observed here could therefore be the result of selection of advantageous combinations from the random mix that facilitate tumorigenesis. This statement is supported by three lines of evidence: (1) from the aspect of mRNA's function, we can see that the correlated loci control many of the same mRNAs; therefore, the result is a common biological effect; (2) a linked effect of interchromosomal loci on common mRNA suggests the co-occurrence of changes of certain CNV; (3) the scale-free feature of the distributions for both DNA/DNA and DNA/mRNA associations disclosed the highly nonrandom organization of these structures. These observations are consistent with correlated CNV loci arising because of selection for perturbations that combine to affect certain advantageous biological processes (altered expression of selected mRNAs) during tumorigenesis. In normal individuals from International HapMap project, Stranger et al. (2007) found that CNV captured “17.7% of the total detected genetic variation in gene expression.” Because tumors tend to accumulate a significant amount of CNV during their development, the potential exists for a far larger effect of CNV on mRNA variance. The eCNV discovered in this study can be used to revisit mRNA expression profiles (see, e.g., Troukhan et al., 2009) to further identity drivers underlie transcriptome.
To further validate our discoveries, we identified another set of cancer cell line DNA copy number data (GSK Cancer Cell Line Genomic Profiling Data, via the National Cancer Institute's cancer Bioinformatics Grid™ (caBIG®), available though caArray) released recently to the public on a much higher density platform (Affymetrix–GeneChip® Human Mapping 500K Array Set; see http://array.nci.nih.gov/caarray/project/woost-00035). Following the same analysis procedure, we also identified significant correlations among nonlinked DNA loci, which present a very similar scale-free feature in the log/log plot (Supplementary Fig. 3). The identification of correlations among unlinked DNA loci in the GSK data supports our finding in the MIP data. Although the MIP platform has a lower density of probes adjacent probes are highly correlated across the population. Higher density platforms may not gain an equivalent amount of information as they will measure increasingly redundant information.
In summary, in this study we have described the wide-spread unlinked DNA/DNA correlations and associated effects on global gene expression in a collection of cancer cell lines consisting of multiple tissue types. The hierarchical nature of the DNA/DNA correlation and the finding that correlated loci in many cases have coregulated a similar set of mRNAs are consistent with selection of advantageous combinations of CNV at unlinked loci. The complex hierarchal structure we present here suggests that this may, in fact, be the case, and that as a result of selection, from the random process of variance generation, a highly nonrandom hierarchical network of CNV and mRNA variance emerges. Additionally, because many tissues of origin are represented in this dataset the identification of a common hierarchical structure may suggest a limited repertoire of “successful” tumorgenesis paths (convergent evolution) across many cancer types.
How might these findings influence diagnosis and treatment of cancer? Associations between particular copy number changes and expression variation most likely represent tumor specific perturbations (CNV) and resulting advantageous changes (correlated mRNAs). These changes likely represent both elimination of undesirable functions and gain of desirable functions from the tumors perspective. If true, it should be possible in future work to relate coordinate CNV and mRNA variation to functional variation such as drug response and/or disease progression. In particular it will be interesting to test if the CNV hotspots described here capture such functional information. In such cases the implicit organization of the data suggests that CNV affects a cis-mRNA (or mRNAs), and that this results in a cascade of functionally relevant expression changes. As such, experimental perturbation of candidate cis-mRNAs should alter both the function (drug response, disease progression) and the expression of the linked trans genes. In this way the tumor specific CNV/mRNA structure could be used to define biomarkers (CNV/expression hotspots) and new targets (mRNAs linked to loci that drive disease). Much remains to be done, but the presence of this highly ordered structure in cancer may in its architecture be a guide to better diagnosis and treatment.
Footnotes
Acknowledgments
We thank Dr. John Storey offering his expertise regarding CGH data analysis. We also appreciate that GlaxoSmithKline (GSK) made the Cancer Cell Line Genomic Profiling Data public via caBIG®.
Author Disclosure Statement
The authors declare there are no conflicts of interest.
References
Supplementary Material
Please find the following supplemental material available below.
For Open Access articles published under a Creative Commons License, all supplemental material carries the same license as the article it is associated with.
For non-Open Access articles published, all supplemental material carries a non-exclusive license, and permission requests for re-use of supplemental material or any part of supplemental material shall be sent directly to the copyright owner as specified in the copyright notice associated with the article.
