




Abstract
Abstract
Peripheral blood mononuclear cells (PBMC) measurements have proved useful in recent studies to discern peripheral biomarkers for common complex diseases and for understanding host responses to drugs and nutrition in personalized medicine. Despite the initial promising data from PBMC, there is little information, however, on inflammatory and immune gene regulation in the context of body fat distribution and metabolic features in healthy adults. We investigated the putative association of body fat distribution and related-metabolic features with mRNA levels of proinflammatory markers in PBMC. This study enrolled 136 healthy subjects (85 females/51 males; age: 21.5 ± 2.5 years). Anthropometrical, clinical, metabolic, and proinflammatory variables were assessed with validated tools. Interestingly, in normal-weight subjects with lower truncal fat (TF) values, mRNA levels of ICAM1, IL1R1, IL6, and TNF-α in PBMC were lower (p < 0.05), compared to normal-weight individuals with higher TF (>58.5/50.2% for men/women, respectively) and overweight/obese subjects [body mass index (BMI) >25 kg/m2]. After regression analyses were performed, individuals with the highest tertiles of TF and waist circumference displayed higher mRNA gene expressions as well as circulating proinflammatory (C-reactive protein and IL6) and metabolic (blood pressure, HOMA-IR, and LDL-c:HDL-c ratio) variables values (p < 0.05), independent from gender. Our findings collectively suggest that the mRNA expression of certain proinflammatory markers in PBMC is associated with body fat distribution in healthy adult subjects, which in turn, was also related to metabolic features and plasma proinflammatory markers concentrations.
Introduction
Insofar as peripheral biomarkers of common complex diseases are concerned, peripheral blood mononuclear cells (PBMC) have been employed in gene expression studies due their accessibility, but also because they are metabolically active and can be easily and repeatedly collected in sufficient quantities in contrast to the obvious difficulties for obtaining biopsy samples from adipose, muscle, and liver tissues (Muller, 2002). Evidence from human subjects have indicated that excessive fat accumulation is associated with the activation of PBMC and an increased expression of a host of cytokines related to inflammation and immune response (Ghanim et al., 2004; O'Rourke et al., 2006). Similarly, nutritional intervention studies have demonstrated the pertinent effects of specific nutrients and calorie restriction on gene expression in PBMC (Crujeiras et al., 2008; Goyenechea et al., 2009).
Despite such initial promising data from PBMC, there is little information, however, on inflammatory and immune gene regulation in the context of body fat distribution and metabolic features in healthy young people. The study of gene regulation and its determinants in healthy subjects is important, as it can allow a deeper understanding of the constitutive architecture of genome responses to environmental exposures or endogenous pathophysiological perturbations. Recently, we have reported that the dimethylarginine dimethylaminohydrolase 2 (DDAH2) gene expression is related to anthropometrical and inflammatory indicators linked to cardiovascular risk in healthy young adults, suggesting a potential role as disease marker (Puchau et al., 2009a).
The present study aimed to investigate the putative association of messenger RNA (mRNA) levels of the genes encoding proinflammatory cytokines and adhesion molecule in PBMC with body fat distribution and metabolic features in healthy subjects. We assessed the mRNA gene expression of the two cytokines, interleukin-6 (IL6) and tumor necrosis factor-alpha (TNF-α), one cytokine receptor, interleukin-1 receptor-type 1 (IL1R1), and one adhesion molecule, intercellular adhesion molecule-1 (ICAM1). Prior data have associated an altered regulation of these markers with obesity and metabolic syndrome (Ghanim et al., 2004; Hsu et al., 2009; O'Rourke et al., 2006) as well as with nutritional interventions to obesity and cardiovascular disease treatments (de Mello et al., 2008, 2009; Mena et al., 2009) and may contribute to the application of -omics technologies or disease management and prognosis.
Subjects and Methods
Subjects
In this study, 136 subjects participated with a mean age of 21.5 ± 2.5 (range: 18–34 years) and a mean body mass index (BMI) of 22.1 ± 2.7 (range: 18–30.5 kg/m2, see BMI distribution by gender, Supplementary Fig. 1). Initial enrollment screening evaluations included a medical history, physical examination, and fasting blood biochemistry, to exclude subjects with evidence of any chronic inflammatory, heart, or respiratory diseases. Other exclusion criteria were hormonal treatment or drug use affecting glucose metabolism, alcohol, and drug dependence, history of recent diet for weight loss, or unstable weight in the last 6 months. Each participant signed a written informed consent, which was previously approved by the Investigation Ethics Committee of the Clínica Universidad de Navarra (79/2005), in accordance with the principles of the Helsinki Declaration.
Anthropometry and body fat distribution
Anthropometrical measurements were conducted according to previously described procedures (Hermsdorff et al., 2009; Pérez et al., 2005). Thus, BMI was calculated by the ratio between weight (kg) and the squared height (m2), which was applied to categorize normal-weight (18.5–24.9 kg/m2), overweight (25–29.9 kg/m2), and obese (BMI ≥30 kg/m2) subjects, according to the Spanish Society for Obesity Study criteria (Salas-Salvadó et al., 2007). Total body fat (%) was estimated by the equations of Durnin and Womersley (1974) and Siri (1956), using four skinfold thicknesses (STs: biceps, triceps, subscapular, and suprailiac). As indicators of total adiposity, we used BMI (kg/m2) and total body fat (%). As markers of central fat accumulation, we used measurements of waist circumference (cm) and ratio of truncal fat to STs, expressed in percentage through calculations as follows.
Truncal fat (%) = [Σ(subscapular and suprailiac skinfold thickness) (mm)]/[Σ(biceps, triceps, subscapular and suprailiac skinfold thickness) (mm)] × 100 were performed (see correlations between total and central fat indicators, Supplementary Table 1 and Supplementary Fig. 2).
Truncal skinfolds and related-ratios have been measured to assess central adiposity and body fat distribution (de Jongh et al., 2006; Ketel et al., 2007; Misra et al., 2005; Schousboe et al., 2004).
Blood pressure and biochemical assessments
Systolic and diastolic blood pressures were measured following World Health Organization criteria (Whitworth and Chalmers, 2004). Venous blood samples were drawn after a 12-h overnight fast by venipuncture. The EDTA–plasma and serum samples were separated from whole blood by centrifugation at 3,500 rpm, 5°C, 15 min (Model 5804R, Eppendorf, Germany), and were frozen immediately at −80°C until assay. Plasma concentrations of triglycerides, total cholesterol, and high density lipoprotein–cholesterol (HDL-c), (Wako Chemicals, GmbH, Nuiss, Germany) nonesterified fatty acid (NEFA) (Wako Chemicals, GmbH, Nuiss, Germany), glucose (Horiba ABX Diagnostics, Montpellier, France) and homocysteine (Demitec Diagnostic GmbH, Kiel-Wellsee, Germany) were measured by specific colorimetric assays, while ceruloplasmin and complement C3 levels (Horiba ABX Diagnostics) were assessed by turbidimetric assays, using an automated analyzer system (COBAS MIRA, Roche, Basel, Switzerland). The reported plasma low-density lipoprotein-cholesterol (LDL-c) data were calculated by the Friedewald equation (Friedewald et al., 1972). Serum fasting insulin was measured by an enzyme immunoassay kit (Mercodia, Sweden). Insulin resistance was estimated by the HOMA-IR, through calculations as follows.
HOMA-IR = [fasting glucose (mmol/L) × fasting insulin (μ/L)]/22.5 as described elsewhere (Matthews et al., 1985).
Plasma concentrations of CRP, high-sensitive IL6 (hs-IL6), and TNF-α (hs-TNF-α) were measured using enzyme immunoassay based kits by means of an automated analyzer system (Triturus, Grifols, Barcelona, Spain). Values of CRP were measured by using an Immundiagnostik AG kit (Bensheim, Germany) and the cytokine concentrations through Quantikine immunoassay kits (hs-IL6 and hs-TNF-α) from R&D Systems (Minneapolis, MN, USA). In our laboratory, the inter- and intraassay were <10% for all analytical determinations.
Gene expression analyses
PBMC were isolated by differential centrifugation (450 × g, 30 min, at 20°C) by using PMN medium (Robbins Scientific Corporation, Sunnyvale, CA, USA). The PBMC band was harvested with a Pasteur pipette and the cells were repeatedly washed with phosphate-buffered saline (PBS). The cell pellet was resuspended in Trizol reagent (Invitrogen Corporation, Carlsbad, CA, USA) and immediately frozen to −80°C until the RNA was extracted. The extraction of total RNA from PBMC was based on the Trizol reagent method according to manufacturer's instructions (Invitrogen Corporation). Concentration of RNA and purity were assessed with a NanoDrop ND-1000 spectrophotometer (Nanodrop, Wilmington, DE, USA) by absorbance at UV260 and UV260/280, respectively. Integrity of the RNA was verified by agarose gel electrophoresis. Extracted total RNA was purified with DNase treatment by means of a DNA-free kit (Ambion/Applied Biosystems, Austin, TX, USA) and used as a template to generate first-strand cDNA synthesis with M-MLV reverse transcriptase (Invitrogen Corporation) as described by the supplier. Quantitative real-time polymerase chain reaction (PCR) was performed by using an ABI PRISM 7000 HT Sequence Detection System as described by the manufacturer (Applied Biosystems, Foster City, CA, USA). Taqman probes for genes (ICAM1, IL1R1, IL6, TNF-α) were also supplied by Applied Biosystems. Gene expression levels were assessed and normalized by using 18s rRNA as internal control following previously described protocols (Livak and Schmittgen, 2001; Milagro et al., 2007). The fold change (2−ΔΔCt) in the target genes once, normalized to 18S and relative to the lowest expression profile, was calculated for each sample according to the manufacturer's guidelines (Applied Biosystems).
Lifestyle assessments
The questionnaire from the Seguimiento Universidad de Navarra (SUN) Study was used for collecting the information about lifestyle determined by smoking status (never, former, or current smokers), smoking time, number of cigarettes/day, physical activity (yes/no or volume of activity) as described previously (Sánchez-Villegas et al., 2003). To quantify the volume of activity, a metabolic equivalent (MET) index was computed by assigning a multiple of resting metabolic rate (MET score) to each activity (Ching et al., 1996), followed by the sum over all activities to obtain a value of overall weekly MET/h (Martínez-González et al., 2005).
Statistical analysis
Results are shown as mean ± SD or median (interquartile range), according to variable distribution, which was determined by the Shapiro-Wilk test. Nonnormally distributed variables were log-transformed prior to inclusion in the statistical analyses. To analyze proinflammatory mRNA expression in PBMC as well as inflammatory marker concentrations with respect to body fat distribution in normal-weight, truncal fat (%) was taken as suitable variable considering its median as cutoff values (58.5 and 50.2%, for men and women, respectively) and distributing the subsequent population group in “lower” and “higher” truncal fat (%) according to these median values. The median cutoff criteria have been previously applied (Hermsdorff et al., 2009; Puchau et al., 2009a) and it is based on a valid and reliable method to assign two groups of risk in epidemiological studies (Martínez-González et al., 2001). Thus, the study participants were categorized in three groups as normal-weight subjects with lower truncal fat; normal-weight subjects with higher truncal fat and overweight/obese subjects. A chi-square (χ2) test was performed to evaluate gender distribution between groups and two-way analysis of variance (ANOVA) test was performed to detect differences between groups as well as the effect of gender and a possible interaction. Importantly, all p-values were adjusted by Tukey post hoc test to correct for multiple comparisons.
To evaluate the association of central fat indicators with metabolic features as well as with plasma concentration and mRNA expression of proinflammatory markers, waist circumference and truncal fat were distributed into tertiles. Multiple linear regression models were performed, adjusted by gender, absence/occurrence of overweight/obesity (according BMI values: < or ≥25 kg/m2), smoking status (never, former, and current smokers), and self-reported physical activity (Yes OR No). Partial correlations were performed between mRNA expression and metabolic variables and plasma concentrations of proinflammatory markers, adjusted by gender BMI (kg/m2) and truncal fat (%) values. Due to the fact that multiple comparisons were performed, p-values from linear regressions and partial correlations were adjusted by Hochberg's Step-up method (Hochberg and Benjamini, 1990) to each domain of variables (metabolic and proinflammatory variables). Statistical analysis was performed with SPSS 15.0 software (SPSS Inc., Chicago, IL, USA) for Windows XP (Microsoft, Redmkond, WA, USA). A p-value <0.05 was considered as statistically significant (see statistical power calculations in the Supplementary Tables 2 and 3).
Results
Anthropometrical, lifestyle and clinical data of the participants, categorized by gender are reported in Table 1. Anthropometrical variables were statistically different due to gender (p < 0.05). In addition, a higher percentage of men self-reported to practice physical activity (p = 0.001), also displaying higher physical activity level than women (p < 0.001). Also, some metabolic features were significantly (p < 0.05) higher in men (p < 0.05) (Table 1).
p-Value from chi-square test to dichotomous variables and, p-value from Student t-test or Mann-Whitney U-tests, when gender was compared.
Data are mean ± SD or median (interquatile range) for continuos variables, according to variable normality distribution. Data are n—number of participants (% sample by gender) for dichotomous variables.
Truncal fat (%) = [Σ(subscapular and suprailiac skinfold thickness) (mm)]/[Σ(biceps, triceps, subscapular, and suprailiac skinfold thickness) (mm)] × 100.
PA, physical activity; MET, metabolic equivalent index; BP, blood pressure; HOMA-IR, insulin resistance index; TC, total cholesterol; HDL-c, high-density lipoprotein–cholesterol; LDL-c, low-density lipoprotein–cholesterol; NEFA, nonesterified fatty acids.
We evaluated the effect of gender as well as of adiposity (by BMI and truncal fat distribution) on proinflammatory marker concentrations. In this context, there was an influence of gender on homocysteine and ceruloplasmin values (p < 0.001). Interestingly, the BMI and truncal fat (%) distribution between participants had a significant effect on complement C3, CRP, and IL6 concentrations, irrespective of gender (Table 2). Thus, plasma concentrations of CRP and IL6 were significantly lower (p < 0.05) in normal-weight individuals with lower truncal fat compared to normal-weight with higher truncal fat and to overweight and obese subjects (Table 2). Furthermore, plasma complement C3 concentrations were markedly lower (p < 0.05) in normal-weight subjects, compared to overweight/obese subjects, independently of truncal fat values (Table 2).
Truncal fat (%) = [Σ(subscapular and, suprailiac skinfold thickness) (mm)]/[Σ(biceps, triceps, subscapular, and suprailiac skinfold thickness) (mm)] × 100.
Normal-weight subjects were segregated in lower and higher truncal fat (%), considering median values as cutoff (58.5 and 50.2% for men and women, respectively).
Gender distribution (n men/n women) was 20/36; 16/35; 12/9 (n = 128) and 21/38; 18/36; 12/9 (n = 134) to IL6 and TNF-α mRNA expression. No significant difference in gender proportion among three groups, by chi-square test.
Data are mean ± SD or median (interquartile range), according to variable normally distribution (all such values).
Significant difference between normal-weight subjects with lower truncal fat versus overweight/obese subjects, irrespective of gender, by pos hoc Tukey's test to correct for multiple comparisons. p < 0.05 on log-transformed values.
Significant difference between normal-weight subjects with higher truncal fat versus overweight/obese subjects, irrespective of gender, by post hoc Tukey's test to correct for multiple comparisons. p < 0.05 on log-transformed values.
Significant difference between normal-weight subjects with lower truncal fat versus normal-weight subjects with higher truncal fat, irrespective of gender, by post hoc Tukey's test to correct for multiple comparisons. p < 0.05 on log-transformed values.
CRP, C-reactive protein; IL6, interleukin-6; TNF-α, tumor necrosis factor-alpha.
Proinflammatory mRNA gene expressions in PBMC were significantly lower (p < 0.05) in normal-weight with lower truncal fat, compared to normal-weight with higher truncal fat and to overweight/obese subjects—independent from gender—which did not present any effect on these variables (Table 3). However, nonobese individuals with higher truncal fat showed no appreciable statistical significant differences (p > 0.05) in the proinflammatory mRNA expression, compared to overweight/obese subjects (Table 3). Moreover, we categorized the sample across tertiles of truncal fat as well as by waist circumference, to evaluate the association of central fat accumulation with metabolic and proinflammatory characteristics of the recruited population. In this regard, systolic blood pressure, HOMA-IR, and LDL-c:HDL-c ratio values were higher in the third tertile of truncal fat and waist circumference, independent of confounding factors (Table 4). Also, plasma concentrations of CRP and IL6 concentrations were significantly increased in the highest tertiles of truncal fat and of waist circumference (Table 4). CRP and IL6 concentrations also were significantly different across tertiles of truncal fat and waist circumference values, independent from the effect of gender and interaction, when we performed a two-way ANOVA and post hoc Tukey's tests (complete data in Supplementary Table 4). These results follows the same trend observed in the Table 2. Interestingly, mRNA expression values of all investigated genes were significantly higher in the highest tertile of truncal fat (Fig. 1), whereas ICAM1, IL1R1, and IL6 mRNA expression were also elevated in the highest tertile of waist circumference (Fig. 2), independent from gender, occurrence of overweight/obese and other confounding factors. In addition, we also used BMI (kg/m2) as continuous variable to adjusting multiple regression models and, the results followed the same trends and remained statistically significant.
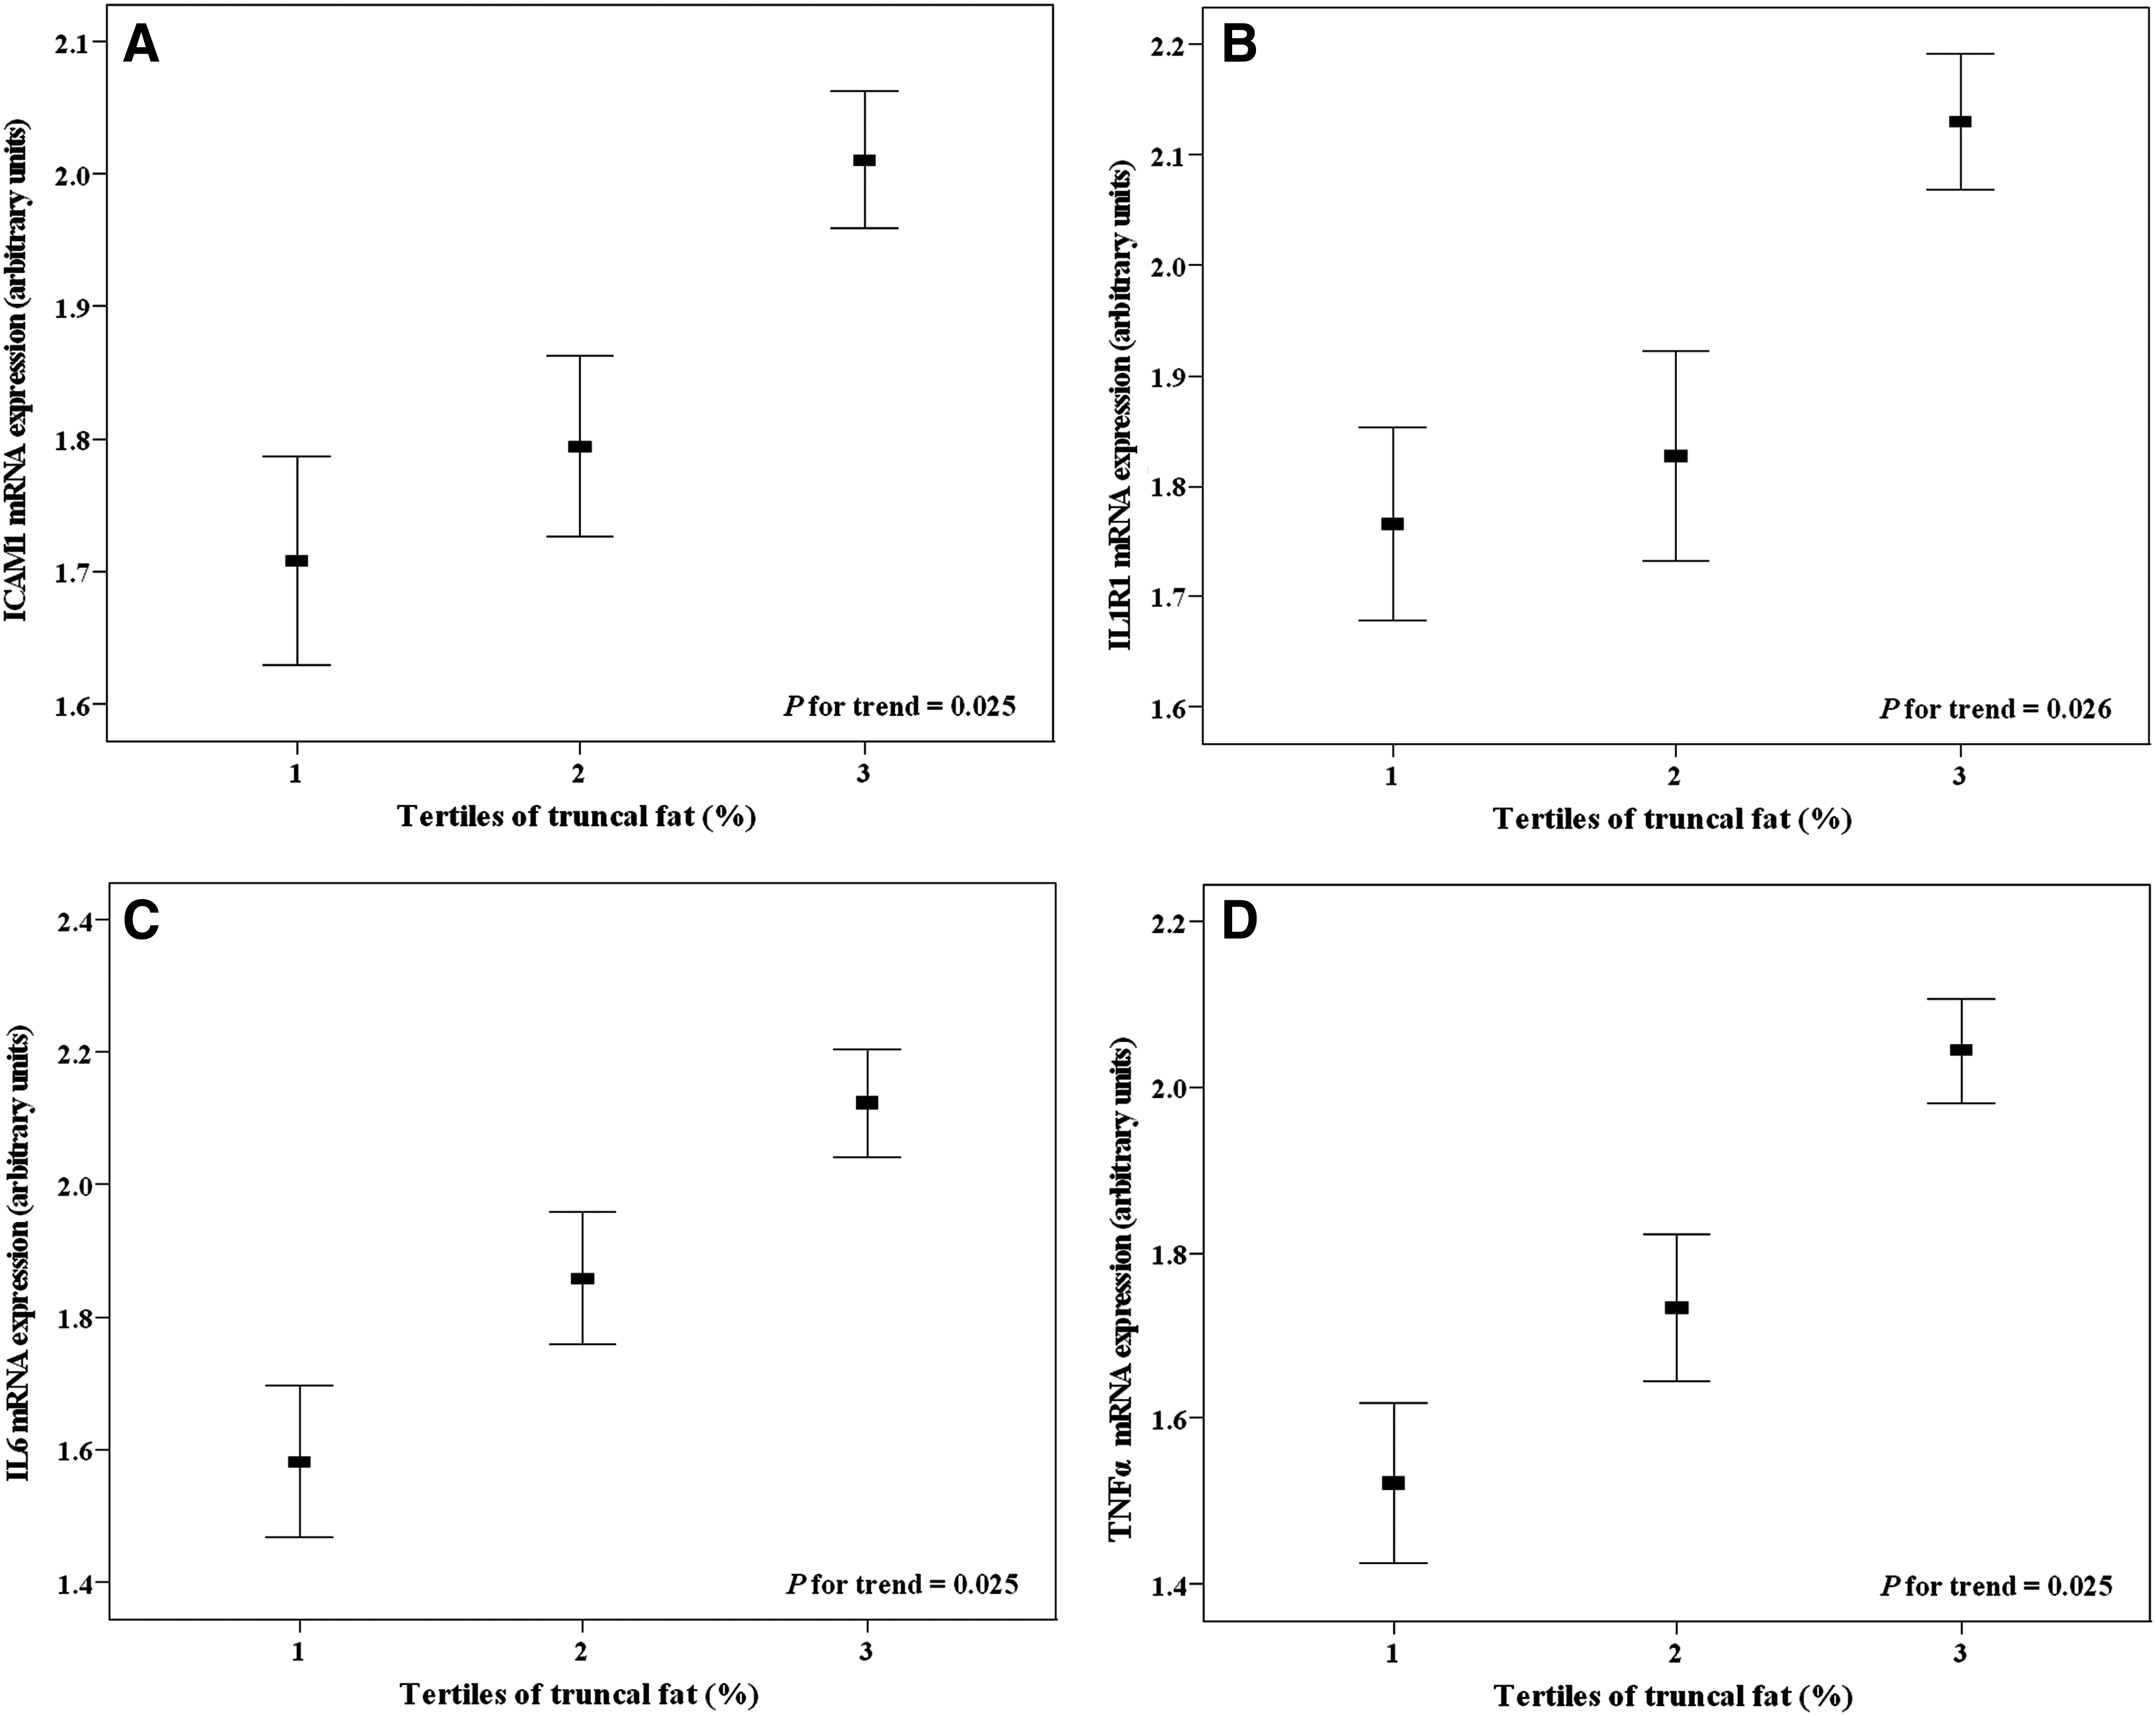
mRNA expression levels of ICAM1 (

mRNA expression levels of ICAM1 (
Truncal fat (%) = [Σ(subscapular and suprailiac skinfold thickness) (mm)]/[Σ(biceps, triceps, subscapular, and suprailiac skinfold thickness) (mm)] × 100.
Normal-weight subjects were segregated in lower and higher truncal fat (%), considering median values as cut-off (58.5 and 50.2% for men and women, respectively).
Gender distribution (n men/n women) was 20/36; 16/35; 12/9 (n = 128) and 21/38; 18/36; 12/9 (n = 134) to IL6 and TNF-α mRNA expression. No significant difference in gender proportion among three groups, by chi-square test.
Data are mean ± SD or median (interquartile range), according to variable normally distribution (all such values).
Significant difference between normal-weight subjects with lower truncal fat versus overweight/obese subjects, irrespective of gender, by post hoc Tukey's test to correct for multiple comparisons. p < 0.05 on log-transformed values. Significant difference between normal-weight subjects with lower truncal fat versus normal-weight subjects with higher truncal fat, irrespective of gender, by post hoc Tukey's test to correct for multiple comparisons. p < 0.05 on log-transformed values.
PBMC, peripheral blood mononuclear cells; ICAM1, intercellular adhesion molecule-1; IL1R1, interleukin-1 receptor-1; IL6, interleukin-6; TNF-α, tumor necrosis factor-alpha.
Truncal fat (%) = [Σ(subscapular and suprailiac skinfold thickness) (mm)]/[Σ(biceps, triceps, subscapular, and suprailiac skinfold thickness) (mm)] × 100.
Truncal fat values into tertiles are first: <53.0 and <46.2; second: 53.0–59.3 and 46.2–51.9; third: >59.3 and >51.9%, for men and women, respectively). Waist circumference values into tertiles (first: <67.6 and <66.7; second: 67.6–80.0 and 66.7–78.9; third: >80.0 and >78.9 cm, for men and women, respectively).
Gender distributions (n men/n women) across tertiles of truncal fat and waist circumference were 16/27; 16/26; 16/27 (n = 128) and 17/28; 17/27; 17/28 (n = 134) to IL6 and TNF-α mRNA expression, respectively. No significant difference in gender proportion among three groups, by chi-square test.
Distribution of subjects with lower truncal, with higher truncal fat (median values as cutoff: 58.5 and 50.2% for men and women, respectively) and overweight/obesity, across tertiles of truncal fat and waist circumference, with statistically significant difference among three groups, by chi-square test.
Data are mean ± SD or median (interquartile range), according to variable normally distribution (all such values).
p for trend, from linear regression models adjusted for gender, absence/occurrence of overweight and obesity (according BMI values: < or ≥25 kg/m2), smoking (never, former, and current) and self-reported physical activity (yes or no). Nonnormally variables were log-transformed prior to inclusion in the regression analyses. All p-values are adjusted by Hochberg's step-up method for each domain (metabolic and inflammatory).
LTF, normal-weight subjects with lower truncal-fat; HTF, normal-weight subjects with higher truncal-fat; BP, blood pressure; LDL-c, low-density lipoprotein cholesterol; HDL-c, high-density lipoprotein cholesterol; CRP, C-reactive protein; IL6, interleukin-6; TNF-α, tumor necrosis factor-alpha.
Furthermore, to evaluate potential associations between mRNA expression in PBMC with metabolic features and plasma concentrations of proinflammatory markers, partial correlations were performed (Supplementary Table 5). In this sense, systolic blood pressure was positively associated with ICAM1 (r = 0.47, p = 0.015) and IL1R1 (r = 0.45, p = 0.005) mRNA expressions. NEFA concentrations also were significantly and positively associated with mRNA expression of ICAM1 (r = 0.40, p = 0.010) and IL1R1 ((r = 0.33, p = 0.005) genes, independent from gender, body mass index (kg/m2), and truncal fat (%). In turn, the LDL-c:HDL-c ratio was significantly associated with mRNA expression IL6 (r = 0.26, p = 0.024) and TNF-α (r = 0.43, p = 0.045). Unexpectedly, plasma IL6 concentrations was significantly and inversely associated with IL6 (r = −0.24, p = 0.042) mRNA expression in PBMC.
Discussion
Proinflammatory mRNA gene expression in PBMC and body fat distribution
The present study reports two new observations pertinent for gene regulation in PBMC in healthy subjects in relation to the body fat distribution. First, there was a lower ICAM1, IL1R1, IL6, and TNF-α mRNA expression in PBMC in nonobese individuals (BMI <25 kg/m2) with lower truncal fat (<58.5 and <50.2% for men and women, respectively), compared to those with higher truncal fat, who in turn, had no difference in mRNA expression values than overweight/obese subjects (BMI >25 kg/m2). Second, there was a higher mRNA expression of the proinflammatory genes in PBMC were found in highest tertiles of truncal fat and waist circumference, independent of gender and occurrence of overweight/obesity. Thus, these observations indicate that the body fat distribution is associated with the expression of proinflammatory genes in PBMC from young adult people, independent from gender and BMI.
Cytokines, such ILs and TNF-α with proinflammatory properties are overproduced with increasing adiposity, which are in part released by monocytes infiltrated in the visceral fat depot (Hotamisligil, 2006; Van Gaal et al., 2006). Indeed, angiogenesis and adipogenesis are functionally linked, because an upregulation of ICAM1 expression has been associated with increased diapedesis of blood monocytes in adipose tissue (Curat et al., 2004; Weisberg et al., 2003). In addition to migration and infiltration ability, PBMC can cross through to the adipose, hepatic, and muscle tissues (Muller, 2002); cytokines and adhesion molecules expression in PBMC has been investigated as indicators of metabolic and immune responses of these tissues (Hotamisligil, 2006). Overall, the body fat distribution could be involved with the production of these proinflammatory molecules directly at immune cells and indirectly at other involved tissues, reflecting its proinflammatory activities.
Proinflammatory mRNA gene expression in PBMC and metabolic features relationships
In our healthy subjects, we found a positive association between mRNA expressions of selected genes with metabolic variables. ICAM1 and IL1α and β have been involved in atherosclerosis process in previous reports (Bo et al., 2009; Hajer et al., 2008). We found that the mRNA expression of ICAM1 as well as the receptor IL1R1 were positively associated with systolic blood pressure, a risk factor for cardiovascular disease, suggesting a link between gene expression in PMBC and systemic blood pressure homeostasis.
Additionally, increased levels of NEFA and atherogenic lipid profile, especially with a HDL-c reduction and LDL-c and triglycerides rises, have been associated with proinflammatory mediators (e.g., cytokines and adhesion molecules), oxidative stress and atherogenesis (Hajer et al., 2008; Hotamisligil, 2006; Rana et al., 2007; Van Gaal et al., 2006). In this context, positive associations of NEFA concentration with ICAM1 and IL1R1 expression as well as of the LDL-c:HDL-c ratio with IL6 and TNF-α mRNA levels, independent from gender and adiposity indicators, were evidenced, suggesting another link between metabolic features and proinflammatory cytokines expression in PBMC of healthy young adults. Furthermore, statistically positive correlations of total cholesterol and LDL-c concentrations with mRNA expression of p50 and p65 subunits of nuclear factor-kappa B (NF-κB) from PBMC have been found in overweight subjects (Puchau et al., 2009b). Indeed, NF-κB is a transcriptional factor with relevant role in the proinflammatory status and oxidative stress in obesity and metabolic syndrome conditions, which might be implicated in the relationship between lipid profile and inflammation (Ghanim et al., 2004; Hotamisligil, 2006).
Body fat distribution and circulating proinflammatory markers
In the present study, we also found that normal-weight individuals with higher truncal fat showed higher CRP and IL6 concentrations than those with lower truncal fat values, irrespective of gender. In the same way, CRP and IL6 concentrations were higher in those individuals who were included in the highest tertiles of truncal fat and waist circumference values, independent of the analyzed confounding factors. These results are in accordance with previous studies, in which abdominal fat has been evaluated by computed tomography or anthropometrical measurements (e.g., waist circumference and BMI) and positively associated with proinflammatory markers (Nishida et al., 2007; Pou et al., 2007; Warnberg et al., 2006). However, we found no significant differences concerning plasma ceruloplasmin, homocysteine, and TNF-α concentrations between groups, when they were distributed according to truncal fat and waist circumference values. These findings contrast with other previous studies in which it has been demonstrated a positive association between levels of these biomarkers and adiposity indicators (Bastard et al., 2000; Engstrom et al., 2003; Konukoglu et al., 2003; Park et al., 2005), although other authors have not shown increases in such markers (O'Rourke et al., 2006; Pincelli et al., 2001; Uysal et al., 2005). The discrepancies among results could be attributed to differences in the phenotypical characteristics of the study population, such as age, presence or not of insulin resistance/metabolic syndrome, body fat distribution, and obesity degree.
IL6: circulating and mRNA gene expression in PBMC
Although the circulating IL6 concentrations should present in the same direction as gene expression, there was a discrepancy in the present study between plasma concentration and mRNA expression of this cytokine, which showed a negative association. This observation could be related to pleiotropic and cell specific actions of IL6, which act in a paracrine manner, upregulating hepatic CRP production and release (Bastard et al., 2006). In fact, in this study CRP and IL6 concentrations were positively associated (r = 0.42, p = 0.001), independent from potential confounding factors (BMI, gender, physical activity, and smoking status). Also, IL6 mRNA expression may not alternatively be translated to protein, because posttranscription of the interleukins genes (e.g., ILs 1α, 6, 10, 12β, 13, 16) depend the activity of MicroRNAs, which can directly interfere in the translation as well as destabilize mRNA by regulating of Adenylate Uridylate-rich elements (Asirvatham et al., 2009). Thus, circulating IL6 concentrations could reflect primarily the secretion related to adiposity and body fat distribution.
Limitations
We note to the reader that the present study has a number of limitations. We used indirect measurements as indicators of total (BMI) and central adiposity (truncal fat by the ratio between skinfold thickness and waist circumference), which would have less accuracy than a direct measurement methods (such as computed tomography, densitometry, or magnetic resonance imaging). In addition, it is difficult to discern the relative contributions of subcutaneous versus visceral fat in proinflammatory marker concentrations/mRNA expressions, basing on anthropometric indicators used in the present study. However, our results are in accordance with several previous studies using adiposity measurements (De Lorenzo et al., 2007; Festa et al., 2001) as well as anthropometry determinations (Nishida et al., 2007; Puchau et al., 2009c; Warnberg et al., 2006). Although the sample size is adequate from the standpoint of initial biomarker discovery, further replication in independent and larger samples will be essential for future translational research at a population level. Finally, gender effect on proinflammatory markers have been discussed highlighting the need for performing separate analyses in men and women. However, our findings are supported despite these caveats for the following reasons. First, we did not find significant difference in gender distribution among the groups (normal-weight with lower truncal fat vs. normal weight with higher truncal fat vs. overweight/obese subjects) as well as in tertiles of truncal fat and waist circumference. Second, we used different cutoff to anthropometrical variables for men and women. Third, we performed adequate statistical analysis and p-values adjustments to evaluate the effect of gender and its possible interaction with central fat indicators.
Conclusions
This report provides initial evidence, apparently for first time, on the association of the mRNA expression of certain proinflammatory markers in PBMC with body fat distribution in healthy adult subjects, which in turn, was also related to metabolic features (blood pressure, HOMA-IR, and LDL-c:HDL-c ratio) and plasma proinflammatory markers concentrations. These observations contribute to our understanding of gene regulation in PBMC in healthy subjects. This may inform the design of future investigations for peripheral biomarkers of common diseases and host responses to environmental exposures such as drugs and nutrition as well as a future application in obesity diagnosis and prognosis.
Footnotes
Acknowledgments
This work was supported by Health Department of the Government of Navarra (22/2007) and by Línea Especial about Nutrition, Obesity and Health (University of Navarra LE/97). The Capes Foundation, Ministry of Education of Brazil as well as IBERCAJA and ADA fellowships scheme of the University of Navarra also provided research grants to H.H.M. Hermsdorff (no. 375605-0) and B. Puchau, respectively. We also wish to thank our physician Blanca E. Martínez de Morentin, our nurse Salomé Pérez, and our technician Verónica Ciaurriz, for excellent technical assistance.
Contributors
H.H.M.H.: design, field work, data collection, analysis, and writing of the manuscript. BP: design, field work, data collection, and editing of the manuscript. MZ: project coleader, design, financial management, and editing of the manuscript. JAM: project leader, design, general coordination, financial management, and editing of the manuscript. None of the contributing authors had any financial or personal interests in any of the bodies sponsoring this research.
Author Disclosure Statement
The author declares there are no conflicts of interest.
References
Supplementary Material
Please find the following supplemental material available below.
For Open Access articles published under a Creative Commons License, all supplemental material carries the same license as the article it is associated with.
For non-Open Access articles published, all supplemental material carries a non-exclusive license, and permission requests for re-use of supplemental material or any part of supplemental material shall be sent directly to the copyright owner as specified in the copyright notice associated with the article.
