




Abstract
Abstract
Glycomics is the study of comprehensive structural elucidation and characterization of all glycoforms found in nature and their dynamic spatiotemporal changes that are associated with biological processes. Glycocalyx of mammalian cells actively participate in cell–cell, cell–matrix, and cell–pathogen interactions, which impact embryogenesis, growth and development, homeostasis, infection and immunity, signaling, malignancy, and metabolic disorders. Relative to genomics and proteomics, glycomics is just growing out of infancy with great potential in biomedicine for biomarker discovery, diagnosis, and treatment. However, the immense diversity and complexity of glycan structures and their multiple modes of interactions with proteins pose great challenges for development of analytical tools for delineating structure function relationships and understanding glyco-code. Several tools are being developed for glycan profiling based on chromatography, mass spectrometry, glycan microarrays, and glyco-informatics. Lectins, which have long been used in glyco-immunology, printed on a microarray provide a versatile platform for rapid high throughput analysis of glycoforms of biological samples. Herein, we summarize technological advances in lectin microarrays and critically review their impact on glycomics analysis. Challenges remain in terms of expansion to include nonplant derived lectins, standardization for routine clinical use, development of recombinant lectins, and exploration of plant kingdom for discovery of novel lectins.
Introduction
Mammalian glycan chains are made up of monosaccharide building blocks, namely, hexoses (glucose, galactose, and mannose), N-acetyl-hexosamines (glucosamine, mannosamine, and galactosamine), deoxyhexoses (fucose), hexuronic acids (glucuronic acid, iduronic acid), pentoses (xylose), and nonuloses (sialic acids). The monosaccharides are found in the dextro-(
Both prokaryotes and plants—owing to their diverse, versatile, and easily adaptable biosynthetic machinery—exhibit a large repertoire of monosaccharide building blocks (e.g.,
Advances in genomics have already reached a level of commercial viability as evidenced by extensive use of genome-wide and focussed DNA microarrays in research and clinic. A logical follow-up was the study of proteomics, which has reached a level of sophistication and automation sufficient to be translated to the end user for biomarker discovery. However, proteomics relies for a large part on differential isotopic labeling, enzymatic digestion, resulting in a mixture of peptides followed by mass spectrometry rather than analysis of whole proteins (Blackstock and Weir, 1999; Zaia, 2008). Both genomics and proteomics are made “relatively” simple thanks to their template-driven nature arising out of base-pair complementarity and tri-nucleotide codon-driven transcriptional and translational processes. The fruits of more than half a century of research efforts in automated chemical synthesis of peptides and nucleic acid primers, cloning, and expression of proteins, gene silencing technology, epigenetics, and transcriptome studies have greatly enabled the current level of sophistication in genomics and proteomics. The past decade has seen a growing realization of the importance of glycomics perspective to immunology and biomedical challenges (Baum and Crocker, 2009; Sharon and Lis, 1993).
In comparison to genomics and proteomics—where automated synthesis, amplification, expression, and characterization have become routine—the tools available for study of glycomics are few. This necessitated the development of unique tools that are currently reaching a reasonable level of sophistication for use by nonspecialists (Bertozzi and Kiessling, 2001; Pilobello and Mahal, 2007; Prescher and Bertozzi, 2006). The enormous diversity of structures that can be created using a limited number of monosaccharides building blocks coupled with its non template-driven nature has made the task of system-wide glycan profiling a challenging task (Fig. 1) (Cummings, 2009; Gabius et al., 2004). A major obstacle for the advancement of glycomics has been the lack of sensitive and easy-to-use high-throughput analytical tools.
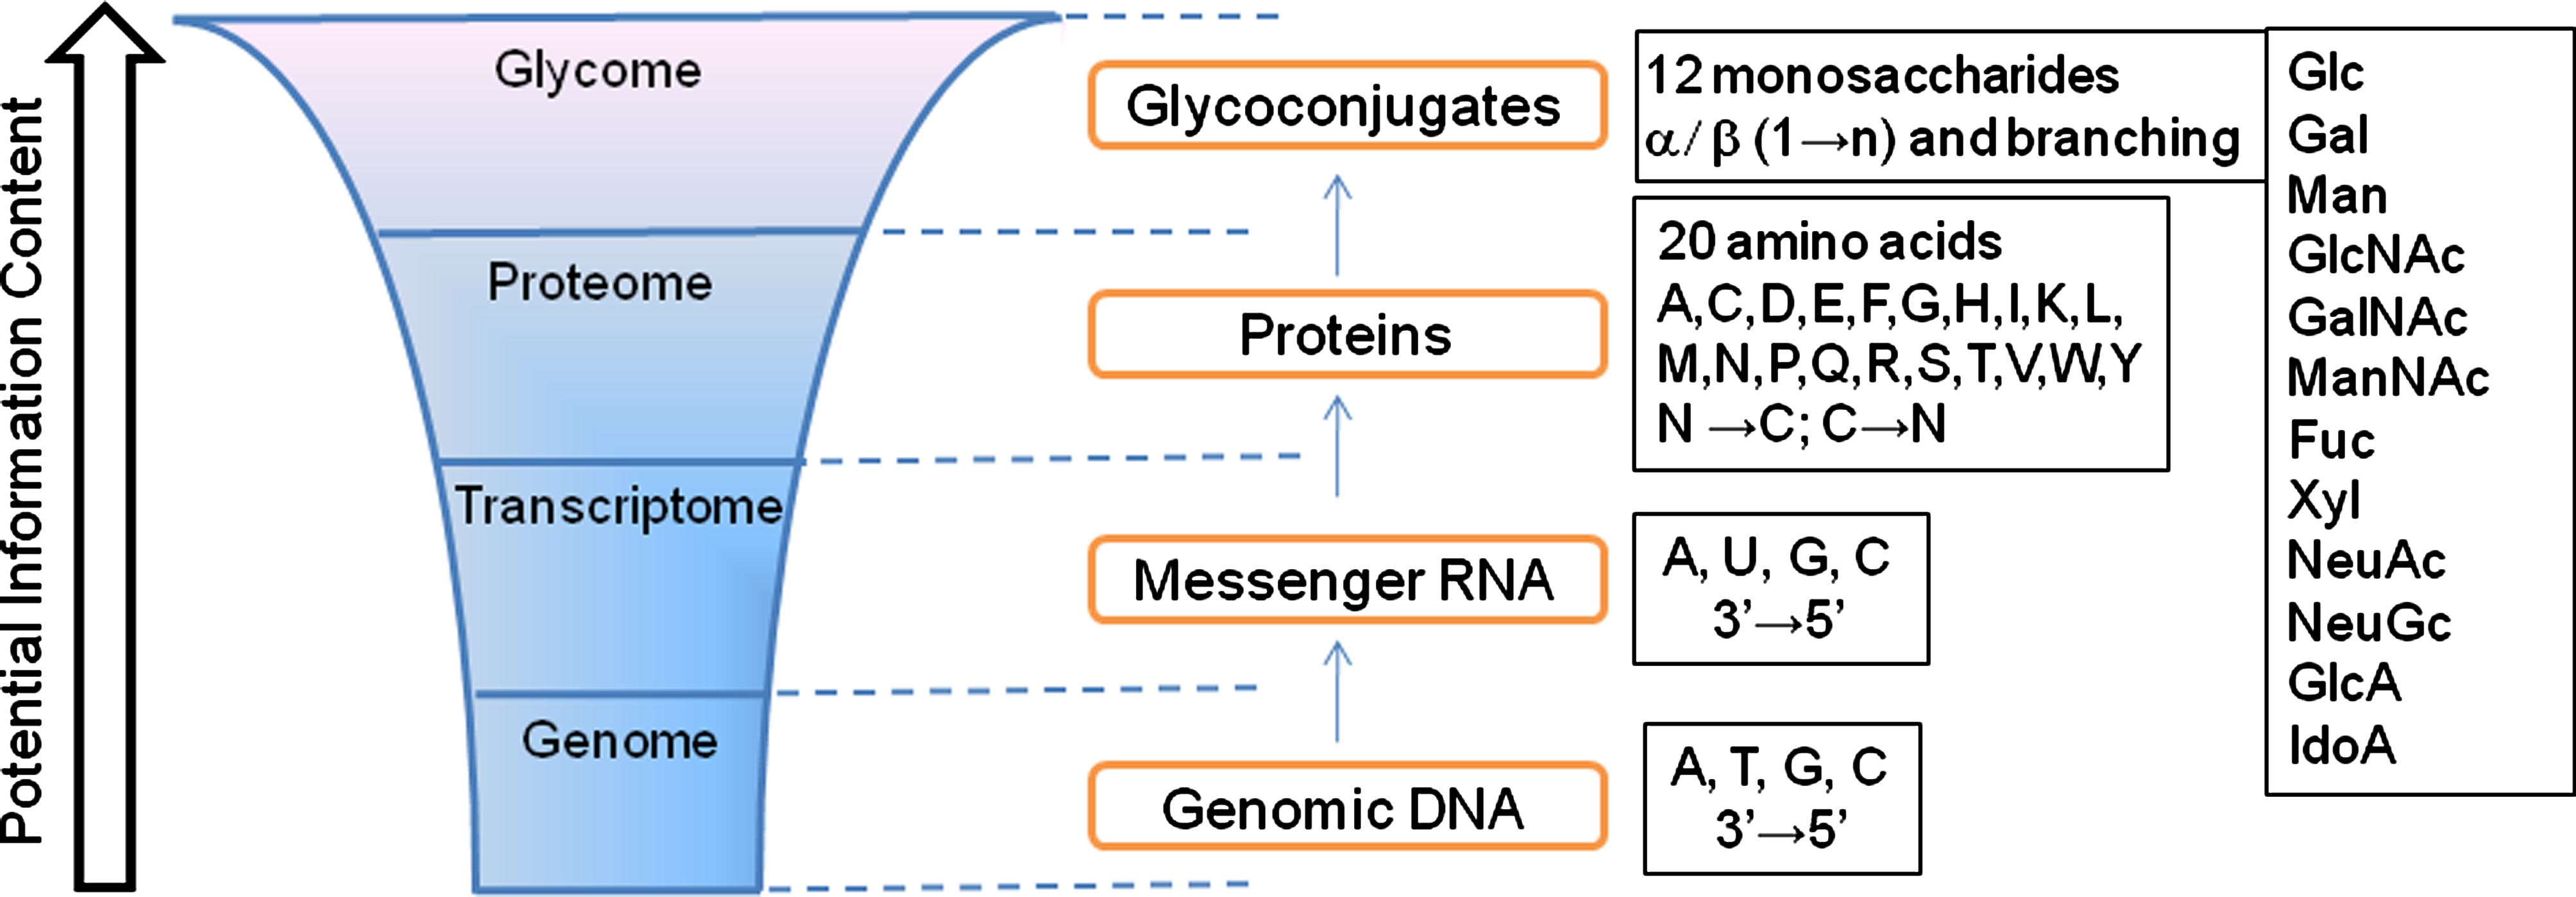
Complexity and diversity of mammalian glycome. The glycome represents the largest class of posttranslationally modified molecules. The information flow from genome to glycome increases exponentially (diagram not drawn to scale). Glycans amplify the genomic information content of cells providing functional diversity originating from only a single gene. Genome, transcriptome, and proteome are governed by template-driven processes using unidirectional (nucleotide base pairs indicated using single letter codes) or bidirectional building blocks (amino acids indicated by standard single-letter codes). In contrast, glycome is generated by complex biosynthetic glycosylation pathways in a non template-driven manner, governed by availability of carbohydrate substrates, expression and activity levels of enzymes and sugar–nucleotide transporters. The monosaccharide building blocks (shown using standard abbreviations) of mammalian glycans are combined in a multidirectional manner and exhibit linkage and stereo isomerism and frequent branching.
The availability of well-characterized enzymes with known substrate specificities, such as PNGase-F (useful for cleaving the intact N-linked glycans out of the asparagine (Asn) side chain), endo-H (useful for cleaving the internal β-(1 → 4)-GlcNAc residue of N-linked glycans leaving one GlcNAc attached to peptide backbone) and several plant and bacterial glycosidases (useful for distinguishing specific anomeric linkages), and analytical chromatographic methods, based on electrochemical detection and fluorophore derivatization of the reducing end anomeric carbon (Domann et al., 2007), enabled detailed and thorough characterization of the total oligosaccharide structures and linkages (Ghesquiere et al., 2006; Ramachandran et al., 2006). Parallel advances in stereochemically controlled synthesis and purification of oligosaccharides produced homogenous glycans that served as reference standards for biological specimen-derived glycans, haptens for conjugation, production of monoclonal antibodies, and vaccine development (Buskas et al., 2006; Seeberger and Werz, 2007; Wang et al., 2007). However, the characterization of a complete structure of a glycan using enzymes and chromatography involves tedious and time-consuming efforts (Ding et al., 2009; Patwa et al., 2009; Zhang, 2007).
The advent of proteomics and evolution of powerful yet user-friendly mass spectrometry technologies, including methodologies coupled to chromatography (known as hyphenated techniques) and bioinformatics, stimulated the rapid analysis of glycans (Bielik and Zaia, 2010; von der Lieth et al., 2006; Werz et al., 2007; Zaia, 2008). Mass spectrometry has the advantage to rapidly scan and analyze samples in a high throughput manner, once the glycans or glycopeptides have been isolated, with or without permethylation, or enriched using lectin-based affinity chromatography. However, unlike peptides, which are made of amino acid as building blocks with distinct molecular mass enabling easy identification of unique peptide sequences, the isobaric nature of various monosaccharide components of glycans complicates the assignment. So, although one could easily predict the size of the oligosaccharides and general components such as number of hexosamines, hexoses, sialic acids, etc., using mass spectrometry, the specific monosaccharides and their stereochemical linkages have to be deduced based on known biochemical pathways (North et al., 2009; von der Lieth et al., 2006). High-end techniques such as tandem mass spectrometry [MS]n, which study fragmentation of a given molecular ion peak and generation of fingerprint-like patterns, are being currently developed to identify the component monosaccharides, their linkage positions, and anomeric orientations. The inherently charged high-energy nature of molecular ions in mass spectrometry leads to loss of posttranslational modifications (such as O-acetylation of sialic acids) and loss of sensitive terminal sialic acid residues. To simplify the vast number of structures possible for a given oligosaccharide purely based on mathematical permutations and for matching of a given mass spectrometry ion peak to relate to a minimal set of glycans, qualified databases were developed using known mammalian biosynthetic glycosylation pathways as limiting parameters (Cooper et al., 2001; Goldberg et al., 2005; McDonald et al., 2009). Rigorous mathematical models correlating expression levels and activities of enzymes involved in N-glycan biosynthetic pathways to the overall mass spectrometry profile of glycans have been developed to analyze differential glycosylation patterns (Krambeck et al., 2009). Notwithstanding intense efforts by multiple research groups, the use of mass spectrometry as a stand-alone technique for complete characterization of glycans is still far from complete.
To evaluate and validate the best possible combination of techniques for glycome profiling as part of Human Proteome Organization (HUPO) and Human Disease Glycomics/Proteome Initiative (HGPI), a highly coordinated multi-institutional study of analysis of N-linked glycans was conducted recently in 20 different labs using identical samples of human IgG and transferrin. The study found that although there were differences in sensitivities [limit of detection (LoD)] and the derived glycoform profiles between various chromatographic (trypsin or PNGase-F digestion, fluorophore derivatization, electrochemical detection, and permethylation using LC or GC) and mass spectrometric techniques (MALDI or ESI of free or permethylated glycans or glycopeptides); the outcome was strikingly comparable considering the microheterogeneity of glycans (Wada et al., 2007). Although MALDI-MS of permethylated glycans was found to be as good as chromatographic techniques, it suffered from frequent loss of terminal sialic acid residues. On the other hand, LC/ESI-MS was found to retain sialic acids intact. The masses have to be mapped with an online MALDI-MS glycomics database. In another inter-laboratory study for structural analysis of N-linked glycans, wide variations were found for levels of sialylation, fucosylation, and antennary branching, highlighting method variability and the need for well-characterized reference standards (Thobhani et al., 2009).
Clearly, a comprehensive elucidation of intact glycoform structures and their biological significance requires the involvement of application of several complementary technologies. Although chromatography and mass spectrometry are the mainstays for glycomics research, alternate technologies suitable for rapid, high-throughput user-friendly analysis at the “point-of-care” need to be developed. Toward this end microarray-based technologies have come to the rescue. Microarrays based on immobilized glycan ligands, either synthetic, isolated from biological samples, or neoglycoconjugates have been developed and shown to be useful for the detection and characterization of human lectins and bacteria (Hsu and Mahal, 2009; Ito et al., 2009; Song et al., 2009). The developments and achievements of carbohydrate–ligand-based microarrays have been reviewed regularly and extensively (Feizi and Chai, 2004; Hirabayashi, 2003; Horlacher and Seeberger, 2006, 2008; Krishnamoorthy and Mahal, 2009; Liang et al., 2008; Oyelaran and Gildersleeve, 2009; Paulson et al., 2006). Microarrays wherein immobilized antibodies (including anti-carbohydrate antibodies) were used to capture a targeted set of glycoproteins and subsequent detection with labeled lectins have been valuable in studying cancer-associated glycan alterations (Chen et al., 2007a). However, in the case of anti-carbohydrate antibodies in particular, the reported supplier-dependent variations and crossreactivity must be taken in to account (Manimala et al., 2007). A complementary approach is the design and development of microarray techniques using immobilized lectins, which is the topic of this review. The analysis of glycans seems to have taken a full circle with the advent of lectin-based microarrays (Sharon, 1998).
Lectin and Carbohydrate Recognition
Early analysis of glycoforms relied heavily on screening of biological samples using a wide variety of plant lectins. Lectins, derived from Latin legere to pick out or choose, are defined as proteins—that bind carbohydrates present on glycoconjugates as ligands—that are neither enzymes (carbohydrate processing), antibodies (anticarbohydrate antibodies), nor proteins that bind small carbohydrate molecules (energy metabolism) (Goldstein et al., 1980). Lectins, which are available in plenty in plant seeds and could be isolated in enriched forms relatively easily, induced agglutination in blood cells and were instrumental in the study of blood group classification and as affinity matrices for purification of glycoproteins and cell separations (Rudiger and Gabius, 2001). It was known as early as in the 1950s that the ligands to which lectins bind on the mammalian cell surface were composed of carbohydrate, as shown by competitive inhibition using specific monosaccharides (Morgan, 1970; Morgan and Watkins, 2000; Watkins and Morgan, 1957). Two classic examples are the characterization of blood group antigens and the demonstration of leukocyte homing based on glycan-derived receptors (Gesner and Ginsburg, 1964; Rosen, 2004). Pioneering work on lectins and their carbohydrate binding specificities by Sharon, Goldstein, Kornfeld, Brewer, Surolia, and several others have set a strong biochemical foundation (Brewer et al., 2002; Dam and Brewer, 2002, 2010; Lis and Sharon, 1986; Sacchettini et al., 2001; Sharon, 2007, 2008; Sharon and Lis, 2004). In mammalian physiology, endogenous lectins (e.g., galectins, siglecs, calreticulin, calnexin, etc.) regulate key processes such as pattern recognition of pathogens, cell–cell communications, correct folding of glycoproteins and quality control (Caramelo and Parodi, 2007; Gabius et al., 2002; Shanmugham et al., 2006). Lectins are known to play vital roles in plant physiology, development, and stress response. As part of the innate immune system, sometimes coupled with ribosome inactivating proteins, for example, ricin, lectins ward off attacks by pathogens, parasites, and predators (De Hoff et al., 2009). On the other hand, lectins act as tools for screening and agglutination, via interaction with bacterial polysaccharides including Nod factors, for attachment of symbiotic bacteria (e.g., rhizobia) and fungi, which help in nitrogen fixation and facilitate mutualism.
Origin of Studies on Microheterogeneity, Structure of Glycans, and Lectins
The classic works of Sharon and coworkers (Lis and Sharon, 1986; Sharon, 2008; Sharon and Lis, 2004), Goldstein and coworkers (Goldstein, 2009; Shibuya et al., 1988), Cummings and Kornfeld (1982), Debray and coworkers (1981), Baenziger and Fiete (1979a, 1979b, 1982), and Surolia and coworkers (Mitra et al., 2003; Surolia et al., 1974, 1980) with lectins set the pace for defining glycan structures and heterogeneities involved therein. Sharon (2007) has pioneered the structure and carbohydrate specificities of lectins particularly soy bean agglutinin (SBA) and Erythrina corallodendron lectin (ECorL) and the importance of their glycosylation. Goldstein and coworkers have studied the interactions of Conconavalin A (Con A) with several simple and complex carbohydrates. In their classic article they demonstrate that Con A precipitates with purified monoclonal IgM and also binds the various carbohydrate moieties present on the surface of lectins from waxbean and soybean, which contain terminal nonreducing α-
Lectin Microarrays—Evolution of a Platform Technology
In tune and keeping pace with the dawn of 21st century and development of high-throughput technologies in genomics and proteomics, it was logical for glycomics analysis to quickly follow suit. The time was opportune to put the large amount of knowledge accumulated in lectin biochemistry over four decades to fruitful applications. Toward this end, lectin microarrays were developed wherein several lectins were immobilized to a suitable solid phase (microscopic slide) optimized using multiple chemical methodologies, conditions (humidity, buffer, and temperature), spot size and spot morphology. Table 1 illustrates the number of studies performed to date along with total number of lectins per array, method of detection, and the nature of analyte (ranging from mono- and oligo-saccharides, neo-glycoconjugates, purified glycans, glycoproteins, crude lysates, membrane preparation, whole-cell bacteria, and intact mammalian cells). Methods for lectin immobilization rely on various methods such as (1) carbene insertion, (2) biotin–avidin bridge, (3) attachment of amine functional group of lysine side chains of protein-backbone of lectins for immobilization to solid surface through epoxy-functionalized (glycidyl derivative) or N-hydroxysuccinimidyl (NHS)-derived esters, (4) exploitation of self-assembled monolayers of thiols on gold-coated surfaces, and (5) 3D hydrogel surfaces (Fig. 2). In all methods there is a lack of absolute control in guaranteeing the optimal orientation, native multimeric quarternary structure, optimal multivalent clustering of carbohydrate recognition domains (CRD) of lectins and their metal ion requirements, such as Ca+2, Mg+2, etc. Curiously, the carbohydrate portion of lectins (except WGA, Con A, PNA, which are not glycosylated) has not been exploited as an anchor point. A mild periodate-based oxidation of glycan chains of lectin, as employed for glycosylated antibody microarrays (Chen et al., 2007a), followed by anchoring to hydroxylamine or hydrazine containing solid surfaces should be a useful approach. This method would leave the CRD of lectins intact, tuck away the crossreacting glycan portions of lectin, and might greatly improve optimal orientation of lectins in their native multimeric forms. Such hydrazide or hydroxylamine based methodologies have been used to capture glycans from glycoproteins and mammalian cells (Wollscheid et al., 2009).

Summary of lectin microarray technologies. Lectin microarrays have been fabricated using various immobilization technologies (1) using lectins derived from multiple sources (2). The binding of glycoconjugates from a diverse set of analytes of biological samples (3) have been detected using multiple detection approaches (4). Lectin microarrays provide a rapid, sensitive, and high-throughput screening tools for glyco-profiling resulting in important biomedical applications (5). Simultaneous application of lectin microarrays with complementary glycomics technologies holds potential for decoding the “glycocode” and development of new and effective diagnostics and therapeutics. SAM, self-assembled monolayers; SELDI, surface enhanced laser desorption ionization; NHS, N-hydroxysuccinimide esters; Au, gold-coated surfaces.
Detection and differentiation of glycoforms on proteins
In a first proof-of-concept demonstration of feasibility of lectin arrays for distinct detection of terminal carbohydrate moieties on glycoproteins Angeloni and coworkers (2005) designed a miniarray. Employing a set of four lectins, namely, peanut agglutinin (PNA), Sambucus nigra lectin (SNA), Dantura stramonia lectin (DSA), and Ulex europaeus lectin (UEA), it was shown that the differences in terminal sugar epitopes could be detected with good sensitivity. Biotinylated lectins were immobilized on Opto-Dex–biotin plates using neutravidin as a bridge. A selected set of purified glycoproteins labeled either with Cy3 or Cy5 were used as analytes. The fluorescent labeling of glycoproteins was performed with an excess of the dye and purified by size exclusion chromatography. For quantitative studies, it will be important to know the exact stoichiometry of number of fluorophores covalently linked for each molecule of glycoprotein, as the fluorescence emission and quantum efficiency may be a function of number of fluorophores per molecule. A number of fluorophores in close proximity may lead either to mutual enhancement of emission signal intensity or internal quenching depending on the microenvironment of the glycoprotein under consideration (Yamaguchi et al., 2008). It is not clear if these glycoproteins [excluding neoglycoconjugates of bovine serum albumin (BSA) and dextrose] consisted of multiple glycoforms. If so, it was at least not detected in this array with limited number of lectins or there was selective capturing of some glycoforms, whereas others were lost due to washing. Notably, in an alternative methodology, when photochemical activation of diazirine moieties on modified dextran was employed for covalent crosslinking of lectins, the carbohydrate binding activity of lectins was found to be lost. In addition to structural rearrangement of CRD upon carbene insertion reaction, the carbohydrate binding by lectin may have been compromised by the multiple points of attachment of a lectin on dextran. The aspect regarding the correct, if not, at least flexible or adaptable orientation of the carbohydrate-binding moiety on the surface of immobilization cannot be overemphasized for routine use of lectin microarray technologies. In comparison to cDNA microarray employed for genomics where true sequence-dependent and strong binding or “hybridization” occurs owing to complementary base pairs and hydrogen bonds, the interactions between glycan epitopes and lectins depend heavily on weak, albeit selective, complementarity of three-dimensional binding spaces through hydrogen bonds and van der Waals forces.
In another effort for rapid analysis of glycopatterns of proteins, Pilobello and coworkers reported a lectin array consisting of nine commonly available lectins. The lectins were covalently immobilized directly on to aldehyde or epoxide-derivatized glass slides. The array was probed using Cy3-conjugated chicken ovalbumin and found to exhibit selective binding consistent with earlier reports of N-linked glycans present on ovalbumin. The sample of ovalbumin contained many accessible terminal GlcNAc glycans predominantly as shown by their exclusive binding to Con A, Griffonia simplifolica lectin (GSL-II) and wheat germ agglutinin (WGA) (Pilobello et al., 2005). Although the lectins were selected to cover a wide range of substrate specificities, the above-mentioned three lectins possess overlapping selectivity for GlcNAc. The epoxy-derivatized slides seem to be somewhat better than aldehyde derivatized slides in terms of spot morphology and homogeneity; both the array substrates provided qualitatively similar results. To establish selective binding with terminal GlcNAc competitive inhibition studies were conducted using free GlcNAc and Gal. In all the three lectins, Con A, GSL-II, and WGA, the binding, and hence fluorescence, was abolished by GlcNAc but not Gal, which was as expected. It is not clear if other monosaccharides were studied for competitive inhibition. For example, use of mannose (Man) as a competing monosaccharide control, in addition to Gal, might have shown a higher differential affinity for Con A binding of Cy3-ovalbumin. Additional studies using Cy-3 labeled porcine gastric mucin and bovine salivary mucin exhibited qualitative differences in lectin binding indicating the feasibility of microarrays. The sensitivity of detection and pattern was found to be conserved when the spot size was reduced to ∼80 microns using automated arrayer from ∼750 microns with manual arrayer. However, the lack of efficient binding of mucins to SNA was attributed to conflicting reports of selective substrates for SNA and supplier dependent variations. It is not clear if the sample of Cy-3-conjugated ovalbumin (analyte) used, which could exhibit batch-to-batch variations in microheterogeneity of glycoforms, was independently tested for presence of sialic acid containing N-glycans using routine periodate-resorcinol, thiobarbituric acid or other assays. It is possible the Cy-3 (a fluorophore with a positive charge) derivatization of ovalbumin sterically and electrostatically prohibited the interaction of sialoglycans with SNA. Importantly, the stoichiometry of number of fluorophore molecules per molecule of albumin may be crucial in achieving consistent results. Chicken ovalbumin has 20 lysine residues, although not all are equally accessible to Cy-3-NHS ester, and an N-terminal amino group. The average pattern of Cy-3 derivatization could alter the selective binding characteristics to lectins. The aspect of weak and overlapping binding affinities among the lectins selected restricted use of other glycoproteins with heterogeneous glycoforms. Also, the efficiency of interaction of solid surface anchored lectins with soluble fluorescence-labeled ligands may have been compromised due to lack of control over optimal orientations of carbohydrate binding regions for productive binding, which would directly affect sensitivity and LoD. In addition to monosaccharide competition assays, a key negative control using completely de-glycosylated Cy-3-conjugated ovalbumin would have been more useful in authenticating specificity of lectin binding and eliminating possible binding contributions from protein–protein affinities and fluorophore–protein interactions (Podder et al., 1974).
Analysis of intact mammalian cells
In a first example of proof-of-principle application of lectin arrays for the distinction of cell types based on accessible glyco-epitopes on cell surface, Zheng and coworkers (Chen et al., 2007b; Zheng et al. 2005, 2007) exploited self-assembled monolayers of N-hydroxysuccinimidyl (NHS)-activated long chain hydrocarbon thiols on gold surfaces. A set of commonly available lectins were hand spotted using 500 nL of lectin solutions. Binding studies using fluorescein-tagged (a fluorophore with a negative charge) chicken ovalbumin gave results as anticipated by binding to Con A, GSL-II, SNA, WGA, and RCA120, but not to UEA. Unlike the earlier study using Cy-3-ovalbumin, which did not show any binding to SNA, the fluorescein isothiocyanate (FITC)-labeled ovalbumin here did exhibit binding to SNA. Such discrepancies could arise due to multiple factors including (1) spot size and morphology, (2) orientation of lectin binding site, (3) batch-to-batch variation of ovalbumin glycoforms, and (4) chemical nature, charge, and loading density of the fluorophore on the glycoprotein. These factors highlight the importance of developing uniform standardization and validation protocols before lectin microarrays could become a routine diagnostic device at the clinics.
A comparison of binding affinities of BHK-21 (Syrian hamster kidney fibroblasts) and Caco-2 (human colorectal adenocarcinoma) cell lines revealed differential binding patterns on a six-lectin array (Zheng et al., 2005, 2007). BHK-21 cells bound to three out of six lectins—Con A, WGA, and RCA—indicating accessible epitopes of mannose, GlcNAc, and Gal, respectively. On the other hand, Caco-2 cells bound to two additional lectins—SNA and UEA—indicating additionally accessible sialic acid and fucosyl moieties. Both BHK-21 and Caco-2 did not bind to GSL-II, indicating absence of accessible terminal GlcNAc epitopes. No additional proof of absence or presence of sialic acid and fucosyl moieties on BHK-21 and relative sialic acid content between the two cell lines was provided. It is interesting to note that the comparisons were made between a hamster and a human cell line, resulting in sharp contrast highlighting the species dependent variations. Also, that lack of binding of BHK-21 cells to SNA might be due to the abundance of N-glycolyl-neuraminic acid epitopes, instead of N-acetyl-neuraminic acid moieties, which may not be bound as tightly by SNA (Knibbs et al., 1991; Taatjes et al., 1988).
Detection of pathogens
In an elegant application for the detection, differential characterization of both pathogenic and nonpathogenic bacteria (applicable for Gram-negative strains that express distinct carbohydrate derived O-antigens attached to LPS on their surface) and monitoring of dynamic changes during bacterial growth, Hsu and coworkers (2006) have designed microarrays with 21-lectins. Importantly, it was noted that use of minimum amount of glycerol and a 1.0-mM solution of respective ligand for each lectin significantly improved the spot morphology and accessibility of CRD of lectin (Hsu and Mahal, 2006). Differential lectin binding patterns could be obtained for SYTO 85 fluorescent dye-labeled nonpathogenic Escherichia coli K12 strains JM101 and HB101, pathogenic E. coli RS218, and Salmonella typhimurium LT2, with RS218 binding to maximum number of lectins. The lectin binding could be selectively abrogated by coincubation with competitive ligands such as lactose, and the intensity of fluorescence was shown to decrease as the bacteria changed from logarithmic growth phase to stationary phase. Binding to sialic acid and fucose specific lectins [Maackia amurensis agglutinin (MAA), SNA, and UEA-I] was observed for RS218, which is known to aid in evasion of host cell immune response. It would be interesting to apply this lectin microarray approach to other bacteria such as M. tuberculosis and parasitic pathogens that cause tropical disease such as malaria and leishmaniasis. The studies on dynamic changes to their accessible cell surface glycoforms could provide valuable insight in the mechanisms of immune evasion and switching between active and dormant phase, particularly in the context of latency of tuberculosis (Hirsch et al., 1997).
Analysis of glycosylation status of biopharmaceuticals
Soluble antibodies and proteins in body fluids play vital roles in regulating homeostasis, development, and pathogen detection through immune surveillance. The changes in glycoform expressed by antibodies are known to have differential downstream effects. On the other hand, the recent clinical success of biopharmaceuticals consisting of glycoproteins, such as therapeutic monoclonal antibodies and erythropoietin (EPO), has raised many challenges for definition of homogeneity, quality control, and batch-to-batch consistency (Sinclair and Elliott, 2005). Lectin microarrays provide a convenient, simple, and rapid means of comparing patterns generated by various glycoforms of a given protein produced under different expression systems, fermentation, and mammalian bioreactor conditions. For this purpose, Rosenfeld and coworkers (2007) successfully applied a commercially available glycoarrays kit called QproteomeTM consisting of 24 plant-derived lectins for the analysis of various glycoproteins including RNase B, prostate-specific antigen (PSA), porcine thyroglobulin, Tamm Horsfall glycoprotein, and recombinant human EPO. The analysis involved simplified algorithms that categorize binding according to the type of glycan present on the analyte and a relative grading system. Such ready-to-use kits are valuable to nonspecialists as a rapid quality control assay, and to specialists for preliminary screening of biological samples.
Detection in solution—evanescent field fluorescence
To generate unique patterns and to overcome promiscuity of lectin/carbohydrate interactions it was imperative that repertoire of lectins be increased on the microarray. Unlike antigen–antibody interactions that exhibit dissociation constant (Kd) in the nano- to femto molar range, lectin–carbohydrate or lectin–glycan interactions exhibit only moderate binding affinities, with Kd in micromolar range. Considering the number of washing steps involved in microarray methodologies and weak-to-moderate binding affinities, it is possible that majority of lectin interactions could be lost. To overcome this drawback and to be able to study glycan binding to lectin array in solution, Kuno and coworkers (2005) elegantly applied the evanescent field fluorescence-based detection. This methodology, also known as total internal reflection fluorescence (TIRF) microscopy, has been used to study interactions of basal membrane of cells with substrates (extracellular matrix and biomaterials) (Fish, 2009). The application of evanescent field fluorescence-based detection eliminated the need for washings of substrate solutions as only a very thin surface (<100 nm) from the solid surface is scanned, and thus, only true equilibrium events are detected. Also, real-time monitoring of binding events could be measured enabling the determination of optimal time of incubation for various lectins. Using a microarray containing 39 lectins, it was shown that status of glycosylation and glycoforms of proteins such as RNase A (nonglycosylated control), RNase B, asialofetuin, fetuin, and bovine serum albumins could be analyzed. Distinct patterns were obtained for glycoproteins such as asialofetuin, mouse laminin, bovine transferrin, and horse radish peroxidise (HRP) (a plant glycoprotein) reflecting variations in their glycoforms in both N-linked and O-linked glycan structures. The potential of microarray for fine glycan structure determination was shown by enzymatic cleavage of tetramethylrhodamine (TMR)- labeled Asn-containing oligosaccharide using a panel of enzymes specific for glycan linkages. The evanescent field fluorescence detection is very powerful, convenient, and capable of high throughput (Hirabayashi, 2008). However, for studies of mixture of glycoproteins from biological samples, multiple real-time images should be acquired and kinetics of equilibrium followed to find optimal time points necessary to achieve differential patterns (Ebe et al., 2006).
Further improvement in sensitivity and limit of detection has been achieved by systematic optimization of critical parameters such as lectin spotting, chemistry of immobilization, nature of the solid surface, temperature, humidity, blocking agent, and buffer conditions. Thus, Uchiyama and coworkers were able to detect even monovalent oligosaccharides that exhibit low affinity towards lectins (Uchiyama et al., 2008). The binding of asialofetuin and an N-glycan oligosaccharide probe carrying asialo-biantennary glycans to RCA120 could be detected at concentrations as low as 100 pg/mL and 100 pM, respectively. Also, with optimized spotting conditions the reproducibility was improved. Closely related glycan structures for which no specific lectins exist, such as Lewis A [Gal-β-(1 → 3)-(Fuc-α-(1 → 4)-GlcNAc] and Lewis X [Gal-β-(1 → 4)-(Fuc-α-(1 → 3))-GlcNAc] that are positional isomers, could be distinguished clearly based on the overall binding pattern on the 43-lectin microarray. The lectins UEA-I and Bauhinia purpuria alba lectin (BPL) showed opposite affinities for the isomers and a ratio of intensities of BPL/UEA-1 was taken to quantify binding. These results were in agreement with quantitative sugar-protein interaction affinity values measured using frontal affinity chromatography (FAC) (Hirabayashi, 2004; Tateno et al., 2007a).
Expanding the repertoire of lectin arrays
The ability of lectins to selectively recognize and bind carbohydrate ligands of glycoconjugates and its potential application to glycomic profiling in the form of lectin microarray was soon realized. Many carbohydrate ligands are bound by several lectins with varying affinities. Conversely, several lectins are available that bind to the same carbohydrate epitope. This results in overlapping affinities and recognition for both lectins and ligands. Therefore, to achieve unique and specific patterns for a given glycoconjugate or cell surface glycome microarrays a larger set of lectins should be more useful. Toward this end, Tateno and coworkers (2007b) developed a microarray containing 43 lectins, and showed that it can be used to obtain unique and distinct signature patterns for Chinese hamster ovary (CHO) cells and its specific mutants Lec2 (deficient in CMP-sialic acid transporter), Lec8 (deficient in UDP-Gal transporter), and Lec1 [deficient in β-(1 → 2)-N-acetylglucosaminyltransferase I (GnT-1)], which are known to exhibit major changes in their cell surface glycoforms. The lectin binding data compared mostly well with the literature data obtained by flow cytometry and other techniques and based on predicted defects in glycosylation. However, anomalous binding of cells to unexpected lectins were found in some cases, such as Trichosanthes japonica lectin (TJA-I) [α-(2 → 6)-NeuAc binder] for Lec2 (defective in sialylation), SNA [α-(2 → 6)-NeuAc binder] for Lec8 (defective in both sialylation and galactosylation), and little differential binding to Con A (mannose binder) for Lec1 (defective in GlcNAc-ylation). These discrepancies were explained by promiscuous binding to other less preferred ligands and to the availability of unique multivalent formations available on intact mammalian cell surface. This highlights an inherent disadvantage of lectin array, that several lectins bind a given carbohydrate epitope and that several carbohydrate epitopes bind a given lectin albeit with varying quantitative affinities, which precludes creation of a mutually exclusive orthogonal set of lectin and ligands. The 43-lectin array has been shown to generate differential patterns for murine splenocytes from WT and β-(1 → 3)-N-acetylglucosaminyl transferase II (β3GnT2) (defective in biosynthesis of poly-N-acetyl lactosamine) knockout mice consistent with the predicted changes in glycosylation. As an evidence to the long-believed hypothesis that cell surface glycoforms are characteristically different before and after differentiation, K562 (human erythroleukemia) cells were differentiated using sodium butyrate and studied by the 43-lectin array. As expected, major changes were found in lectins that recognize mucin-type oligosaccharides such as core 1, Tn (GalNAc) and sialo mucin, which were consistent with reported literature. Earlier biochemical studies have shown enhanced O-glycosylation of K562 cells upon differentiation (Gahmberg et al., 1984) as well as enhanced O-GalNAc expression on CD43 (leukosialin) upon activation (Maemura and Fukuda, 1992; Piller et al., 1989). Additionally, the 43-lectin array provided distinct and unique binding patterns for a panel of 10 cell lines, including Jurkat, HEK293, and THP-1.
In an attempt to increase the repertoire of lectins on microarray Tao et al. (2008) have reported a 94-lectin microarray for generation of signature patterns for 24 mammalian cell lines including breast cancer cells, identification of changes in glycoforms between naive and activated B cells and T cells and thymocytes, demonstration of carbohydrate-dependent differential bacterial tropism among related cell types, and identification of potential biomarkers for cancer stem-like cells. Herein, a simplistic binary scoring approach (as in bound or nonbound) was used to generate the patterns. Based on the results of cell binding, lectins were classified in to four categories namely, nonbinders, low, medium, and high binders. Of the 94 lectins, 17 lectins did not bind any of 24 cell types under study, which was attributed to low affinity and low quality (crude preparations of lectins), and two lectins were of unknown saccharide specificities. The binding of intact cells to remaining 75 lectins displayed distinct patterns. Some cell lines such as hESC, Caco-2, D407, and U937 were found to bind only to 20 lectins on the array, whereas cell lines such as Tag, 293, K1106, and MCF7 bound to more than 50 lectins. Also, the clustering of similar cell types was unpredictable indicating that accessible glycoforms could be widely different even among related cell types. Although the retina-derived cell-lines clustered tightly, the related breast cancer cell lines exhibited wide pattern variations. The binding pattern found on the microarray was validated by flow cytometry using selected lectins. Significant changes were found in glycoforms of lymphocytes before and after activation in both T and B cells. The array could distinguish the glycoforms in T cells that were activated by two different agents [phorbol myristyl acetate (PMA)/ionomycin and mixed lymphocyte reaction (MLR)].
Pathogenic bacteria such as E. coli K12 exhibit cellular tropism, that is, differential affinity to related cell types, and invade selected cell populations in a host through its fimbriae protein, which is a mannose binding lectin. Lectin array signature patterns of three related breast cancer cell lines indicated that SkBr3 has higher cell surface mannose content compared to MCF7 and MDA-MB-231, and hence, could be used to predict bacterial tropism and pathogen-host cell interactions. Experiments using WT E. coli K12 and FimH mutant on the three cell lines confirmed the higher affinity of E. coli to SkBr3 cell line, relative to MCF7 and MDA-MB-231.
To find unique biomarkers for identification and characterization of cancer stem cell-like cells, differential lectin signature pattern was studied using MCF7 cells cultured either as a monolayer (normal culturing) or as spehroidal bodies (similar to embryonic stem cell culturing). Depending on the nature of culturing, the lectin patterns were different, particularly for GlcNAc binding lectins such as Lycopersicon esculentum lectin (LEL), Aleuria aurantia lectin (AAL), and WGA. Based on this data, the MCF7 cells were depleted to remove LEL-binding breast cancer cells to obtain a side population enriched in cancer stem-like cells. These cells when injected in mouse were found to result in higher tumor volume compared to the nonenriched whole cell populations (Tao et al., 2008). Thus, the changes in glycoforms, gleaned from lectin microarray analysis, could result in biomarkers that can either identify side populations or can be used to separate major populations.
Lectin coupled to mass spectrometry
Recently, using a set of two selected lectins, namely, Jacalin and SNA, Ueda and coworkers (2009) have shown the application of ProteinChip arrays and SELDI-TOF for discovery of glycosylation disorders and disease specific alterations in glycan structure in sera of lung cancer patients using a targeted serum glycoproteomics approach. The two lectins were covalently immobilized on the commercially available ProteinChip array that carry carbonyldiimidazole moieties via free amine groups present on lectins. The serum samples, after depletion of 14 most abundant proteins, were captured on lectins through their glycoforms and studies by mass spectrometry. Clear-cut and significant differences were found between serum samples of healthy volunteers and lung cancer patients, captured by Jacalin and SNA. Through extensive MS/MS analysis for protein identification, glycosylation site mapping, and glycan structure analysis, apolipoprotein C-III (apoC-III) was found to be differentially glycosylated at Thr74 between the two groups. A major feature is the higher abundance of linear sialyl core 1 structures [NeuAc-α-(2 → 3)-Gal-β-(1 → 3)-GalNAc; sialyl-T-antigen] in lung cancer patients with a characteristic absence of the branching α-(2 → 6) sialic acid on the core GalNAc [NeuAc-α-(2 → 3)-Gal-β-(1 → 3)-(NeuAc-α-(2 → 6))-GalNAc; di-sialyl-T-antigen], which was found in higher abundance in healthy volunteers. The absence of di-sialyl moieties is attributed to epigenetic silencing of α-(2 → 6)-sialyltransferase gene as corroborated by other studies. Clearly, inclusion of additional lectins, optimization of immobilization on ProteinChip arrays, and holding capacities of lectins on SELDI-MS should be performed to verify these findings in a larger set of clinical sample (Chen et al., 2008).
Ratiometric detection
The first-generation lectin arrays used purified or enriched glycoproteins samples with single-color fluorescent dye, which led to lack of consistency and reproducibility due to variations in labeling conditions. Also, the glycolipids were not studied as they were lost in the sample preparation protocol and are difficult to label directly due lack of dye-reactive functional groups (e.g., free amine groups similar to lysine side chain of proteins). To develop semiquantitative and reliable analysis using internal biological reference standards the dual-color ratiometric approach, extensively used in gene microarrays, was successfully adapted to lectin microarrays along with compatibility to standard image, statistical clustering, and ratiometric heat map analysis (Pilobello et al., 2007). Here, isolated micellae of mammalian cell membranes were used, thus taking glycolipids into account, from two different cell types with each cell type being differentially labeled with yellow (Cy3) dye and red (Cy5) dye (Fig. 2). As an internal control, the dyes were swapped between the samples to nullify variations due to derivatization or dye-related background. Two well-characterized CHO cell lines (Pro-5, and a mutant Lec8 that is defective in UDP–Gal transport and resistant to agglutination by WGA) were used. The lectin binding pattern obtained from Pro-5 and Lec8, using independent single-color lectin array, was almost similar, which did not reflect the true variations in the glycome structure. Whereas a mixture of dual-color labeled (and dye-swapped) membrane micellae of both Pro-5 and Lec8 analyzed on the lectin array clearly highlighted the defects in glycan structures. Stark differences were seen in the binding to MAA (preferably bound by Pro-5 which contains α-(2 → 3) sialosides), Galanthus nivalis agglutinin (GNA) (preferably bound by Lec8, rich in N-linked mannose structures), Lens culinaris lectin (LcH) (preferably bound by Lec8, rich in fucosylated mannose core structures), and HPA and Artocarpus intergrifolia lectin (AIA, Jacalin) (preferably bound by Lec8 with exposed and truncated core O-linked mucin-type GalNAc residues). The ratiometric technique was employed to differentiate the glycome profile of naive HL-60 (human promyelocytic leukemia) and its dimethyl sulfoxide induced differentiation into neutrophils. HL-60 cells upon differentiation showed increased levels of N-linked high Man structures, increased β-(1 → 6)-GalNAc residues, and reduced levels of α-(2 → 6)-sialic acid epitopes. The binding data with SNA was ambiguous compared to Polyporus squamosus lectin (PSL) and Limulus polphemus agglutinin LPA, thus highlighting the need to have larger number of lectins to compensate for overlapping ligand selectivities and to obtain unique patterns.
The versatility and sensitivity of the dual color ratiometric approach was well illustrated by its application to the study of virions (virus particles) derived from HIV (human immunodeficiency virus), SIV (simian immunodeficiency virus), and host cell-derived microvescicles (Krishnamoorthy et al., 2009). Microvesicles are carved out of enriched raft-like microdomains by exocytosis and are critical part of normal development and homeostasis. Comparative analysis of glycome profiling using a 68-lectin array (which included galectin-1 in addition to plant-derived lectins) revealed that both HIV virions and host-derived microvesicles have strikingly similar glycosylation patterns and hence the ability to evade immune detection (Hirabayashi, 2009). Comparison of HIV and SIV indicated subtle differences in the levels of glycoforms of gp120, which was a major differential compared to host microvesicles. Novel anti-HIV therapy that seeks to exploit the binding of lectins, such as cyanovirin, to high-mannose structures of gp120 may have to tread cautiously as they may obstruct the native microvesicular pathway as well (Li et al., 2008).
Importance of multivalent interactions
Any technological advance in glycomics using lectins could not ignore two salient features of carbohydrate ligands, namely, multivalency and ligand-density effects (Brewer et al., 2002; Lee and Lee, 2000). A recent study highlights the importance of ligand density (available in natural form on the biological samples, lysates, membrane preparations, or whole cells) on the ability of lectins or antibodies for recognition and binding (Oyelaran et al., 2009). The antigen array used neoglycoconjugate containing varying amount of ligands [carbohydrate epitopes attached to bovine serum albumin (BSA)] immobilized on a solid support and probed with three lectins [Vicia villosa lectin B4 (VVL-B4), Helix pomatia agglutinin (HPA), Soy bean agglutinin (SBL)], three monoclonal antibodies and serum antibodies from patients. Study revealed the necessity to include a given antigen or given carbohydrate ligand in varying density both in terms of individual molecules and physical arraying in order to profile subpopulations of antibodies with variable affinities. For example, the binding (apparent Kd) of VVL-B4 to α-GalNAc derivatized BSA changed dramatically, by an order of magnitude, from >1,430 nM for 9 ligands per BSA to 129 nM for 13 ligands per BSA. These values and relative affinities are consistent with original studies establishing Tn-antigen (α-GalNAc-Ser) as a specific recognition epitope for VVL-B4 (Puri et al., 1992).
Recombinant lectins
Owing to their easy isolation and commercial availability, plant-derived lectins were a straightforward choice for the development of lectin microarray for glycomic analysis. However, plant-derived lectins do suffer from multiple disadvantages (Hsu et al., 2008). Excepting a few lectins such as Con A, WGA, and PNA, the majority of plant-derived lectins are inherently glycosylated. They are obtained in multiple isoforms, called iso-lectins, in the isolation and purification process due to genetic heterogeneity, variability in posttranslational processing by proteases, and subunit structure (De Hoff et al., 2009). The inherent glycoprotein nature of lectins could potentially lead to false positive binding, particularly with cell lysates and biological samples (e.g., binding of mannose binding lectins such as DC-SIGN present in mammalian cell lysates to high-mannose glycans present on the immobilized plant-derived lectins). There are multiple ways in which this problem could be addressed such as (1) completely de-glycosylate plant-derived lectins and ensure integrity of ligand selectivity and specificity, (2) to regenerate all existing plant lectins using bacterial recombinant technology, and (3) use a panel of bacterial lectins, most of which lack glycosylation. In all the above cases carbohydrate ligand selectivity, specificity, and affinity must be obtained on a case-by-case basis and specific mutants using recombinant technology that abrogate ligand binding could serve as valuable negative controls. The feasibility and utility of recombinant bacterial lectins and their mutants for lectin microarray was shown by Hsu and coworkers (2008) using a small set of seven lectins. The lectins consisted of GafD (specific for β-GlcNAc), GafD-m (a Asp88Leu mutant which does not bind β-GlcNAc), PapGII (specific for globoside GbO4), and PapGIII (specific for globoside GbO5) from E. coli and PA-IL (specific for Galactose), and PA-IIL (binds both fucose and mannose with higher affinity for fucose) from Pseudomonas aeruginosa, and RS-IIL (binds mannose and fucose with higher affinity for mannose) from Ralstonia solanocearum. All the recombinant lectins were expressed with GST-His6 fusion tags at the N-terminus using pET-41 LIC/Ek vector and found not to compromise carbohydrate–lectin interaction. The use of fusion-tags in recombinant lectins could aid greatly in controlled orientation of lectins during immobilization process, which might improve sensitivity. It was found that PA-IIL (fucose binder) bound strongly to gangliosides obtained from porcine brain extract indicating the presence of fucosylated gangliosides. Finally, the recombinant lectin array was used to obtain differential patterns for micellae prepared from renal carcinoma (ACHN and TK10) and melanoma (M14 and SK-MEL-5) cell lines. Although all four cell lines bound to PA-IIL (fucose/mannose binder), the binding to PA-IL (galactose binder) and GafD (GlcNAc binder) was selective for renal cell lines only.
Library of lectin mutants
At about the same time, Maenuma and coworkers (2008) reported the use of a library of 35 Maackia amurensis hemagglutinin (MAH) mutants with various point mutations at two amino acids, 131Gly and 133Ser, which are present in the key CRD of the lectin. The wild-type MAH is known to bind sialyl-T and disialyl-T antigens found on O-glycans and the MAH mutants were found to bind carbohydrates with wider specificities when probed with polyacrylamide conjugates containing various glyco-epitopes. All the recombinant mutants were expressed with FLAG fusion tag, which was used to capture on polystyrene surfaces coated with anti-FLAG antibody. This avoided the purification of bacterial lysates and provided optimal orientation of lectins for interaction with glycans on glycoproteins and mammalian cells. The bound cells were labeled with crystal violet, lysed, and quantified by colorimetry. Study of binding of various cancer cell lines using cluster analysis revealed that groups of cells of similar origin such as colon carcinoma, melanoma, and myeloid cell lines, tend to cluster together. The binding of intact cells exhibited wider differential patterns compared to polyacrylamide–glycoconjugates, which was attributed to additional cell surface glycan and mutant lectin protein backbone interactions. Although not in a microarray format, this study showed the ability to generate significant number of lectin mutants and their potential for rapid glyco-profiling of cells.
Challenges remain in terms of the quantities of biological samples needed for flooding the lectin microarray for glycomic analysis. To improve the sensitivity and to utilize very little biological samples without pooling of multiple patient samples, Nagaraj and coworkers (2008) have shown the utility of piezoelectric printing for lectin immobilization, using six common lectins, on nitrocellulose slides and piezoelectric liquid dispensing for analyte samples. This way glyco-profiling of pure glycoproteins such as asialofetuin (ASF) and 6-sialofetuin (6-SF) could be accomplished using as little as 1 μL of 1 nm or 15 fmol of ASF at 1 μg/mL, whereas a conventional lectin array would require about 450 μL for the same analysis. In another approach for label-free detection using electrochemical impedance spectroscopy (EIS), La Belle and coworkers (2007) have shown that carbohydrate epitope functionalized gold-nanoparticles and glycoproteins could be detected on Cu/Ni/Au printed circuit boards (PCBs) using two lectins, PNA, and SNA. The sensitivity for asialofetuin was found to be 10 pg/mL (150 fM), which was comparable to conventional fluorescence-based detection methods. Further development of such tools will involve expansion and multiplexing to include a large number of lectins, miniaturization, application of nano-particle-based application (Dai et al., 2006), integration of antibody assisted detection (Kuno et al., 2009), and optimization of measurement conditions (Gemeiner et al., 2008). An exhaustive list of lectins (including those that are currently not employed in microarrays) along with their source, ligand specificity, status of lectin glycosylation and oligomerization, and metal ion requirements for optimal activity are provided in Supplementary Table 1 along with references (supplementary information).
Finally, a comment on lectin spot size for glycomic analysis of intact mammalian cells deserves mention. Depending on the size and surface area of lectin spot and density of lectin available minor portions or side populations of mammalian cells could be selected, leading to batch to batch inconsistency. In other words, using simple calculations performed by us, when an asynchronous population of 5 × 10⁵ cells are used in the analyte, with a lectin array spot of 120 micron diameter, less than 10% of cells are captured leading to loss of 90% of cells in the washing. The cells are perhaps lost due to lack of availability of lectins rather than lack of specific affinity for a given lectin. Assuming a perfectly circular morphology, a lectin spot of 120-μm diameter will provide a surface area of 11,304 μm2. Taking Jurkat cells with a diameter of 10 μm as a model gives 78.5 μm2 for surface area of each cell. Taking a ratio would result in a maximum of 144 Jurkat cells per lectin spot with a diameter of 120 μm. For a total of 282 spots (triplicate spots for 94 lectins) this would result in the capture of 40,608 cells, which is less than 10% of total number of cells in the analyte. Mammalian cell populations, particularly cancer cell lines are known to exhibit side populations that have distinct glycoform patterns and metabolic rates (Wu and Alman, 2008; Yarema et al., 2001). Therefore, multiple technical replicates and standardization of lectin signature pattern as a function of lectin spot diameter would be required for analysis of whole mammalian cells. Additionally, the washed cells (∼ 90%) could be subject to repeated analysis on the lectin array to confirm if identical patterns are obtained.
Overview and Outlook
Advances in research over years have made it clear that with limited number of genes in mammalian genomes, transcriptome, and translated proteome, posttranslational modifications in proteins are important players in regulating their function. Glycosylation, the most abundant and complex form of posttranslational modification, is a key regulator of the properties of proteins and lipids that are present in abundance on the cell surface. Glycans at the extracellular interface mediate several interactions between or within the cells, which in turn, control several important biological events such as cell adhesion, cell signaling, cellular trafficking, and protein folding, stability, and transport. Moreover, glycosylation is important for regulation of many crucial cellular processes such as development, elicitation and homeostasis of activating and inhibitory immune responses. It is known that several diseases such as cancer exhibit improper glycosylation with striking differences from healthy tissues. Hundreds of glycogenes encode enzymes such as glycosyl transferases and sulfotransferases, which are essential for carrying out glycan biosynthesis. An intricate network of interactions among these enzymes and sugar–nucleotide transporters provides the cells with a rich and complex diversity of glycans. Minute changes in the entire system—be it glycogene alteration, enzyme deficit, or disease-related alteration in expression, or deficiency in the availability of raw materials (activated glycosyl donor and their metabolic precursors)—leads to modified glycan structures being presented within the cell and on the cell surface (Schachter and Freeze, 2009). A common example of such alterations can be observed in tumor cells that express an abnormally high degree of N-glycan branching, extension with polylactosamine chains, fucosylation, and sialylation, and altered degree of sulfation. Even the O-glycans found associated with tumors are altered with higher percentage of T antigens, sialyl-T antigens, and Tn- and sialyl Tn-antigens with truncated glycoforms. Slight and subtle changes in glycan structures can initiate a cascade of undesirable cellular events. Given equal levels of expression a protein from a gene, the probability of aberrations are much higher in the post translational glycosylation modifications, which profoundly affect the concerned biological events. Because aberrant glycosylation are frequently observed in disease conditions, they are well suited to be utilized as biomarkers for those diseases (Hanash et al., 2008). Several techniques including lectin-microarrays are now available that can be used to identify these altered structures and therefore put to diagnostic use.
Genome-wide studies were revolutionized with the advent of whole genome DNA microarray technology about a decade ago. Several transcription-level analyses have been successfully carried out for over 20,000 human genes (Young, 2000). Gene expression profiling has since become a widespread method for investigating biological and clinically relevant events. However, a major problem initially was the validation of preliminary results obtained during gene expression profiling to prevent errors due to low quantities used in DNA microarray. Most statistical methods and programs used were lengthy and slow, and therefore diminished the total accomplishments of the technique. With the introduction of real-time quantitative PCR (qPCR), which is highly sensitive and precise, the validation of DNA microarray data has become easy. It is now one of the most commonly used technique for microarray data analysis. With lectin microarray as the new upcoming glycotechnology with ultrasensitive glycan profiling ability, it will be advantageous to apply qPCR array analysis for expression profiling of glycogenes. The number of glycan biosynthetic enzymes identified has risen significantly and constantly since the identification of the first glycosyl transferase as early as in the 1980s. The human genome encompasses a number of glycogenes, which encode the enzymes involved in glycan biosynthesis (Narimatsu, 2006). Approximately 200 genes, about 1% of whole genome, are identified to date that encode for glycosyltransferases. Use of lectin microarray in combination with qPCR data abolishes the need of cumbersome protocols used for individual glycan analyses of glycoproteins and glycolipids from various sources and replaces it with a high-throughput method based on multiple lectin–sugar interactions (Narimatsu et al., 2009). A number of different protocols have been developed for detecting alterations to the glycosylation profile of cell surfaces. Recent advances using an ultrasensitive lectin microarray facilitates differential glycan analysis by targeting a restricted region of one-dot sections on a formalin-fixed tissue array (Matsuda et al., 2008).
Another method that has developed to be a powerful tool for structural analysis of glycans is mass spectrometry (MS). It has proved to be a fast and high-throughput method for glycan structure analysis. However, it does have the disadvantage of requiring extensive sample preparations prior to analysis if a detailed characterization of glycan structure is needed (Dell and Morris, 2001). Owing to immense heterogeneity present in glycans isolated from any natural source, there is always a trade-off between sensitivity of characterization and high-throughput results. Nuclear magnetic resonance (NMR) spectroscopy is a powerful technique for detailed linkage analysis of glycans, but is limited by the requirement of substantial quantities of homogeneous samples. On the other hand, high-performance liquid chromatography (HPLC) of fluorescently labeled glycans is another advanced technique to obtain glycan profiles on the basis of their abundance in isolated mixtures (Domann et al., 2007). Development of integrated user-friendly online databases for glycan structures analysis, lectin binding parameters, lectin folds, and mass spectrometry reference data for fingerprinting are critically essential (Damodaran et al., 2008; Haslam et al., 2008; von der Lieth et al., 2006).
Each of the techniques, microarrays (lectins, synthetic and natural carbohydrate ligands, neoglycoconjugates), qPCR, MS analyses, glyco-informatics, NMR and HPLC provide unique ability to identify novel alterations in glycosylation patterns. Although each method allows for a specific advantage and improvement in detection of altered glycan profile, it is not easy to obtain detailed information of glycosylation pattern by using any one of them in isolation. By using a combination of several analytical methods, however, it should be possible to determine the glycan structures and better understand glyco-alterations that occur on cell surfaces and/or on proteins. In summary, lectin microarrays with their simplicity, capacity for rapid high-throughput analysis at the “point-of-care,” availability of lectins, and affordable low-cost equipment requirements are well positioned for wide spread usage in biomedical research.
Expansion of existing lectin microarrays to include mammalian, bacterial, and fungal lectins would add to its versatility and clinical value. The existence of isolectins, multiple glycoforms, heterogeneous preparations, and batch-to-batch variations in plant-derived lectins are major challenges in obtaining consistent reproducible results. The problem of glycosylation of lectins could be overcome by recombinant production of plant lectins in bacterial systems with concomitant verification of carbohydrate binding specificities and affinities. Kulkarni and coworkers (2004; Shaaanan et al., 1991) have expressed recombinant EcorL and showed that absence of glycosylation on EcorL did not affect its carbohydrate specificity and exhibited similar quaternary structure. However, glycosylation does seem to affect the folding process (Mitra et al., 2003). Recombinant lectins do seem to be far less practical compared to the ease and abundance of natural plant lectins. It will be a demanding task to generate sufficient repertoire of recombinant lectins with defined ligand specificities to develop a microarray and for ready-to-use clinical applications. An ideal lectin microarray would consist of a set of lectins with mutually exclusive or orthogonal ligand specificities, but the variety of glycoforms and their unpredictable three-dimensional multivalent presentation on mammalian cell surface precludes the construction of such arrays (Gabius, 2008; Gilleron et al., 1998).
Alternatively, a practical approach would be to undertake large scale explorations of biodiversity with a focus on discovery of new lectins and their biochemical characterization and collect as many lectins as possible from lectin space or plant kingdom. With rapid advances and growing importance of food security and plant biotechnology (Goldstein, 2002; Pusztai et al., 2008; Vasil, 2008), it should be possible to identify novel lectins with specificities for complex glycoforms and their modifications such as phosphorylation, sulfation, acetylation, methylation, and attachment of lactic acid. Additionally, novel modes of attachment to solid support using the glycan residues of the lectin are anticipated to provide optimal orientation while hiding away the interfering glycan components.
In summary, the collective information obtained using diverse microarray technologies that employ immobilized synthetic and natural carbohydrate ligands, neo-glycoconjugates, antibodies, and lectins (natural and recombinant) would be valuable in developing glycomics-based diagnostics and therapeutic targets (Yue and Haab, 2009). The application of metabolic glycan engineering (MGE) using variants of natural monosaccharide analogs as precursors and their subsequent detection via orthogonal chemical reactions in vivo are opening up possibilities for glycan imaging (Laughlin and Bertozzi, 2009; Sletten and Bertozzi, 2009). Differential glycan profiling of glycan engineered cells (expressing azide, ketone, and thiol functionalities) using lectin microarrays might open up new possibilities for cell and tissue engineering including stem cell differentiation (Du and Yarema; Sampathkumar et al., 2006).
In view of the various biological processes and diseases in which glycans play a crucial role the potential for development of glycotherapeutics is immense. Understanding the role of glycan structure and function in fundamental biology and applications of high-throughput tools such as lectin microarray, reviewed here, will enable us to develop new-age diagnostics and therapeutics with higher efficacy.
Footnotes
Acknowledgments
Gupta thanks the Council of Scientific and Industrial Research (CSIR), India for the award of Senior Research Fellowship. Surolia is a J.C. Bose fellow of the Department of Science and Technology (DST) and thanks support for basic research by grants from Department of Biotechnology (DBT) and DST, Government of India. Sampathkumar is a Ramalingaswami fellow of the DBT and is grateful for generous start-up funding from NII and research grants from DST and DBT, Government of India.
Author Disclosure Statement
The authors declare that no conflicting financial interests exist.
References
Supplementary Material
Please find the following supplemental material available below.
For Open Access articles published under a Creative Commons License, all supplemental material carries the same license as the article it is associated with.
For non-Open Access articles published, all supplemental material carries a non-exclusive license, and permission requests for re-use of supplemental material or any part of supplemental material shall be sent directly to the copyright owner as specified in the copyright notice associated with the article.
