




Abstract
Abstract
To identify specific proteins associated with chemotherapeutic responses, we analyzed protein expression patterns in stage IIIc primary serous epithelial ovarian cancer tissues displaying differential responses to first-line postoperative adjuvant chemotherapy. The expression profiles of five chemoresistant tissues [progression-free survival (PFS) ≤12 months] and five chemosensitive tissues (PFS ≥48 months) were analyzed with 2D electrophoresis, and the spot intensities of differentially expressed proteins were quantified. To validate these proteins as markers for chemoresistant disease, we analyzed tissues from an additional 17 patients. All the patients were allocated to the over- or underexpressing group according to protein spot intensity, and survival analysis was performed. In chemoresistant tissues, four proteins (thioredoxin domain containing four, similar to RIKEN cDNA 1700016G05, tubulin α 1A chain, and the pyruvate dehydrogenase E1-β subunit precursor) were overexpressed, and seven proteins [keratin 1, vitamin D-binding protein, creatine kinase B, annexin V, SH3-containing guanine nucleotide exchange factor (SGEF), tryptophan-aspartate repeat protein-1 (WDR 1), and WDR 1 isoform 1] were underexpressed. The underexpression of keratin 1, creatine kinase B, annexin V, SGEF, WDR1, and WDR1 isoform 1 were significantly correlated with poor overall survival. A combination of keratin 1 and SGEF showed the highest sensitivity of 0.800, specificity of 0.917, PPV of 0.800, and NPV of 0.917 in predicting chemoresistant disease. These proteins may be useful as predictive markers of chemoresistant disease. However, further analyses in large-scale should be performed before they can be considered reliable predictive markers of chemoresistant disease.
Introduction
Despite efforts to reduce recurrent disease, platinum-based chemotherapy fails in the majority of patients, primarily due to drug resistance (Baek et al., 2008; Micha et al., 2005; Skinner et al., 2005). The mechanisms underlying drug resistance are multifactorial and include genetic changes, alterations in oncogene expression, and the modulation of signal transduction pathways (Cole et al., 1992; Gottesman et al., 2002; Kim et al., 2007; Partheen et al., 2006; Peters et al., 2005). Previous studies have attempted to identify changes in RNA and protein levels as biomarkers associated with chemoresistant disease (Bachvarov et al., 2006; Hartmann et al., 2005; Tetu et al., 2008). Tetu et al. (2008) evaluated the clinical significance of selected overexpressed genes in 158 women who had undergone surgery and chemotherapy for advanced serous papillary ovarian carcinoma (FIGO stages III and IV). After performing immunohistochemistry on microarray blocks containing samples from all 158 cases, the authors found that tumors overexpressing HSP10 had a lower risk of progression than those with low expression [hazard ratio (HR), 0.6; confidence interval (CI), 0.42 − 0.87; p = 0.007].
Although recent advances in proteomics have permitted proteomic analyses in ovarian cancers, these studies were primarily aimed at identifying useful biomarkers for early diagnosis (Gadducci et al., 2004; Gogoi et al., 2006). However, proteomic analysis may also aid in the identification of new biomarkers for chemoresistant disease. Although comparative proteomic analyses have been reported in chemoresistant ovarian carcinoma cell lines (Cicchillitti et al., 2009; Di Michele et al., 2009; Le Moguen et al., 2006; Yan et al., 2007), no information is available regarding advanced ovarian cancer tissues.
To identify specific proteins associated with chemoresistant disease, we analyzed protein expression patterns using two-dimensional polyacrylamide gel electrophoresis (2D PAGE) in primary advanced serous EOC tissues displaying differential responses to first-line postoperative adjuvant chemotherapy. Initially, 2D PAGE-based comparative proteomic analyses of five chemoresistant serous EOC tissues [progression-free survival (PFS) ≤12 months] and five chemosensitive tissues (PFS ≥48 months) from optimally debulked stage IIIc patients were performed. Quantitative analysis of digitized images was performed, and differentially expressed proteins were selected and then identified via matrix-assisted laser desorption ionization time-of-flight mass spectrometry (MALDI-TOF MS). To confirm these proteins as predictive markers of chemoresistant disease, receiver operating characteristics (ROC) curve analysis was performed, and a cutoff level for the intensity of each protein spot was selected. We then analyzed an additional 17 EOC tissues via 2D PAGE. Patients were allocated to over- or underexpressing groups according to protein spot intensity, and survival was compared between groups using the Kaplan−Meier method. Various combinations of proteins with different expression levels were assessed so they can be used for more accurate diagnosis of chemoresistant diseases. The overexpression of pyruvate dehydrogenase (PDH) E1-β subunit precursor and the underexpression of keratin 1, creatine kinase B (CKB), annexin V, SH3-containing guanine nucleotide exchange factor (SGEF), tryptophan-aspartate repeat protein-1 (WDR1), and WDR1 isoform 1 were correlated with poor PFS in stage IIIc serous EOC patients. These results indicate that differentially expressed proteins may be functionally implicated in the evolution of chemoresistant and chemosensitive phenotypes.
Materials and Methods
Patients and tumor tissues
All fresh tumor tissues, snap frozen in liquid nitrogen, were obtained from stage IIIc serous EOC patients according to the guidelines of the institutional review board of the Yonsei University College of Medicine, Seoul, Korea. All patients were staged according to the International Federation of Gynecology and Obstetrics criteria for ovarian cancer.
To identify differentially expressed proteins in chemoresistant tumors, we initially selected 10 patients (total) with chemoresistant and chemosensitive tumors. The available clinicopathological data of these patients are provided in Table 1. All patients had optimally debulked stage IIIc serous ovarian carcinoma and were initially treated with six cycles of platinum-based combination chemotherapy. Five patients whose cancer progressed within 12 months from the initiation of primary chemotherapy were deemed chemoresistant, whereas the remaining five patients whose cancer did not recur for more than 48 months were deemed chemosensitive. Progression was defined as the appearance of a new metastatic site that was not present upon the initiation of primary chemotherapy or an abnormal CA-125 value with an increase greater than 25% over the previous level. PFS was defined as the interval from date on which primary chemotherapy was initiated to the date that progression was noted. Overall survival (OS) was calculated based on the date on which primary chemotherapy was initiated until the date of death or the most recent follow-up visit.
S: chemosensitive disease group.
R: chemoresistant disease group.
POAC: postoperative adjuvant chemotherapy.
LN: lymph node.
PFS: progression-free survival (the interval from the date of initiation of primary chemotherapy to the date of progression).
CaP: carboplatin/paclitaxel.
CaT: carboplatin/taxotere.
NED: no evidence of disease.
DOD: dead of disease.
To verify selected proteins as prognostic markers, we analyzed an additional 17 patients with stage IIIc serous ovarian carcinoma. In these patients, the PFS and OS rates were analyzed with respect to the expression levels of selected proteins.
Protein sample preparation
Tumor tissues (1 g) were homogenized directly using a motor-driven homogenizer (PowerGen125, Fisher Scientific, Pittsburgh, PA) in sample lysis solution consisting of 7 M urea, 2 M thiourea containing 4% (w/v) 3-[(3-cholamidopropy)dimethylammonio]-1-propanesulfonate (CHAPS), 1% (w/v) dithiothreitol (DTT), 2% (v/v) pharmalyte, and 1 mM benzamidine. Proteins were extracted for 1 h at room temperature with vortexing. After centrifugation at 15,000 × g for 1 h at 15°C, the insoluble material was discarded and the soluble fraction was subjected to 2D PAGE. The average protein concentration of tissue extract from each sample was 4.5–5.5 mg/mL. Protein loading was normalized using the Bradford assay (Bradford, 1976).
2D PAGE
IPG dry strips (4–10 NL, 24 cm, Genomine, Korea) were equilibrated for 12 − 16 h in 7 M urea, 2 M thiourea containing 2% CHAPS, 1% DTT, and 1% pharmalyte, and loaded with 200 μg of sample. Isoelectric focusing (IEF) was performed at 20°C using a Multiphor II electrophoresis unit and an EPS 3500 XL power supply (Amersham Biosciences, Piscataway, NJ), according to the manufacturer's instructions. For IEF, the voltage was linearly increased from 150 to 3,500 V over 3 h for sample entry and then maintained at 3,500 V; focusing was complete after 96 kVh. Prior to the second dimension, strips were incubated twice for 10 min each in equilibration buffer (50 mM Tris-HCl, pH 6.8, containing 6 M urea, 2% SDS, and 30% glycerol), first with 1% DTT and then with 2.5% iodoacetamide. Equilibrated strips were inserted onto SDS-PAGE gels (20 × 24 cm, 10 − 16%). SDS-PAGE was performed using a Hoefer DALT 2D system (Amersham Biosciences), according to the manufacturer's instructions. The 2D gels were run at 20°C for 1,700 Vh and then silver stained as described by Oakley et al. (1980).
Image analysis
Quantitative analysis of digitized images was carried out using PDQuest software (version 7.0; BioRad, Hercules, CA), according to the manufacturer's instructions. To digitalize the spot volume of 2D gels, we used the Dyversity (Syngene, Cambridge, UK) imaging system and digitalized the 2D image into 16 bit TIFF format. The intensity of each spot was normalized against the total valid spot intensity. Spots that showed significant variation in expression were identified through comparison of chemoresistant and chemosensitive tumor samples using the Mann−Whitney U-test. Spots with p-values <0.05 were selected.
Enzymatic in-gel protein digestion
Protein spots were enzymatically digested in-gel in a manner similar to that previously described by Shevchenko et al. (1996) and using modified porcine trypsin. Three to four regulated spots matched as the same protein were excised for protein identification. Gel pieces were washed with 50% acetonitrile to remove SDS, salt, and stain, and then dried to remove the solvent and then rehydrated with 3 μL trypsin (8–10 ng/μL; Promega, Madison, WI) and incubated for 8–10 h at 37°C. The proteolytic reaction was terminated by the addition of 5 μL of 0.5% trifluoroacetic acid. Tryptic peptides were recovered by combining the aqueous phase from several gel extractions with 50% aqueous acetonitrile. After concentration, the peptide mixture was desalted using C18ZipTips (Millipore, Billerica, MA) and the peptides were eluted in 1 − 5 μL of acetonitrile. An aliquot of this solution was mixed with an equal volume of a saturated solution of α-cyano-4-hydroxycinnamic acid in 50% aqueous acetonitrile, and 1 μL of this mixture was spotted onto a target plate.
MALDI-TOF analysis and database search
Protein analysis was performed using an Ettan MALDI-TOF system (Amersham Biosciences). Peptides were evaporated with an N2 laser at 337 nm using a delayed extraction approach. They were then accelerated with a 20-kV injection pulse for time-of-flight analysis. Each spectrum was the cumulative average of 300 laser shots. The search program ProFound, developed by Rockefeller University (http://prowl.rockefeller.edu/prowl-cgi/profound.exe) was used for protein identification by peptide mass fingerprinting. Calibration and processing of Spectra were performed using internal program (Evaluation module, version 2.0.16) provided by Ettan MALDI-TOF and spectra were calibrated using trypsin autodigestion ion peaks (m/z, 842.510 and 2,211.1046) as internal standards. The following parameters were used for the database search: trypsin as cleaving enzyme; a maximum of one missed cleavage; iodoacetamide (Cys) as a complete modification; methionine as a partial modification; monoisotopic masses; and a mass tolerance of 0.1 Da. Z estimation was then applied, which is a method used to measure the identification confidence level by evaluating the Z-scores of various candidate groups. The Z-score is a measurement of the distance from the mean value in standard deviation units and is obtained using the formula Z = (x − y)/σ, where x is a Gaussian random variable, y is the mean value of x, and σ is the standard deviation of x. In this study, Z-scores of 1.645, 2.326, and 3.090 represent confidence levels of 95, 99, and 99.9%, respectively.
Immunohistochemistry
Among the differently expressed proteins identified in our proteomic study, α- tubulin, keratin 1, creatine kinase B, annexin V, and WDR 1 were further validated by immunohistochemistry. Paraffin-embedded tissues were available only in 9 of initially selected 10 patients. Tumor tissues were processed for antigen retrieval using heating in citrate buffer, and immunohistochemically stained with the antibodies α-tubulin (Abcam Inc., Cambridge, MA; at 1:200 dilutions), keratin 1 (Abcam Inc.; at 1:200 dilutions), creatine kinase B (Abcam Inc.; at 1:100 dilutions), annexin A5 (Abcam Inc.; at 1:100 dilutions), and WDR1 (Abcam, Inc.; at 1:100 dilutions). The staining was evaluated by multiplication product (0–9) of immunostaining intensity (0–3) and percentage of immunopositive cells (0–3), which were classified into four groups: 0, + (1–3), 2+ (4–6), and 3+ (7–9).
Statistical analysis
The data were analyzed using parametric and nonparametric statistics, with SPSS 11.0 (SPSS, Inc., Chicago, IL). Descriptive statistics were used for quantitative experimental data. Mann−Whitney U-tests were performed to compare spot intensities between groups, and spots with a p value <0.05 were selected. ROC curves were constructed to determine the spot intensities that provided the highest sensitivity and specificity in predicting chemoresistant tumors (i.e., the optimal values). All 27 patients were divided into two groups according to spot intensity. Patients with spot intensities higher or lower than the optimal value were assigned to the overexpressing or underexpressing group, respectively. Over- and underexpressing patients were subjected to survival analysis to compare PFS and OS. The Kaplan−Meier method was used to estimate survival curves, and the log-rank statistic was used to test the equality of survival functions between patients showing over- or underexpression of each protein. These differentially expressed proteins were then combined in the hope of increasing their diagnostic accuracy for chemoresistant disease. To identify the combination(s) that most accurately detected chemoresistant disease, each pair was compared via ROC curve analysis in the initial 10 patients. The combinations with the fewest variables and greatest area under the curve (AUC) values were selected. Then sensitivity, specificity, positive predictive value (PPV), and negative predictive value (NPV) of these combinations were analyzed in the additional 17 patients.
Results
Initially, total proteins from 10 serous EOC tumors (five chemoresistant tumors and five chemosensitive tumors) were analyzed using 2D PAGE-based comparative proteomics. The clinical characteristics of these patients are summarized in Table 1. The median follow-up period was 48 months (range: 11 − 81 months). About 1,400 spots that were detected in all 10 2D PAGE were selected for analysis (Fig. 1). The differentially expressed proteins were identified using MALDI-TOF MS. In total, 11 differentially expressed proteins were detected between chemoresistant and chemosensitive tumors (Supplementary Fig. 1), including four overexpressed proteins (thioredoxin domain containing four, similar to RIKEN cDNA 1700016G05, tubulin α 1A chain, and the PDH E1-β subunit precursor) and seven underexpressed proteins (keratin 1, vitamin D-binding protein, CKB, annexin V, SGEF, WDR1 protein, and WDR1 isoform 1) in chemoresistant tumors (Table 2). The results of ROC curve analysis for the selected proteins are shown in Table 3. To confirm these proteins as predictive markers for chemoresistant disease, we analyzed an additional 17 patients (Supplementary Table 1). All patients had undergone platinum-based postoperative adjuvant chemotherapy for stage IIIc serous EOC. Survival analysis with respect to differential protein expression revealed that the overexpression of the PDH E1-β subunit precursor (p = 0.0025) and the underexpression of keratin 1 (p = 0.0080), CKB (p = 0.0357), annexin V (p = 0.0008), SGEF (p < 0.0001), WDR1 (p = 0.0489), and WDR1 isoform 1 (p = 0.0010) were significantly correlated with poor PFS (Table 4). In addition, the underexpression of keratin 1 (p = 0.0454), CKB (p = 0.0136), annexin V (p = 0.0007), SGEF (p = 0.0002), WDR1 (p = 0.0065), and WDR1 isoform 1 (p = 0.0001) were significantly correlated with poor OS (Fig. 2). We then used ROC curve analysis to examine how combinations of differentially expressed proteins affect the prediction of chemoresistant disease. Nine combinations that showed the fewest variables and large AUC values were selected from the initial 10 serous EOC tumors (Supplementary Table 2). The sensitivity, specificity, PPV, and NPV of these combinations for the detection of chemoresistant disease were analyzed in additional 17 patients. Five patients who had progressive disease within 12 months were assigned to a chemoresistant disease group and the other 12 patients were assigned to a chemosensitive disease group. The combination of keratin 1 and SGEF showed the highest sensitivity of 0.800, specificity of 0.917, PPV of 0.800, and NPV of 0.917 in predicting chemoresistant disease (Table 5).
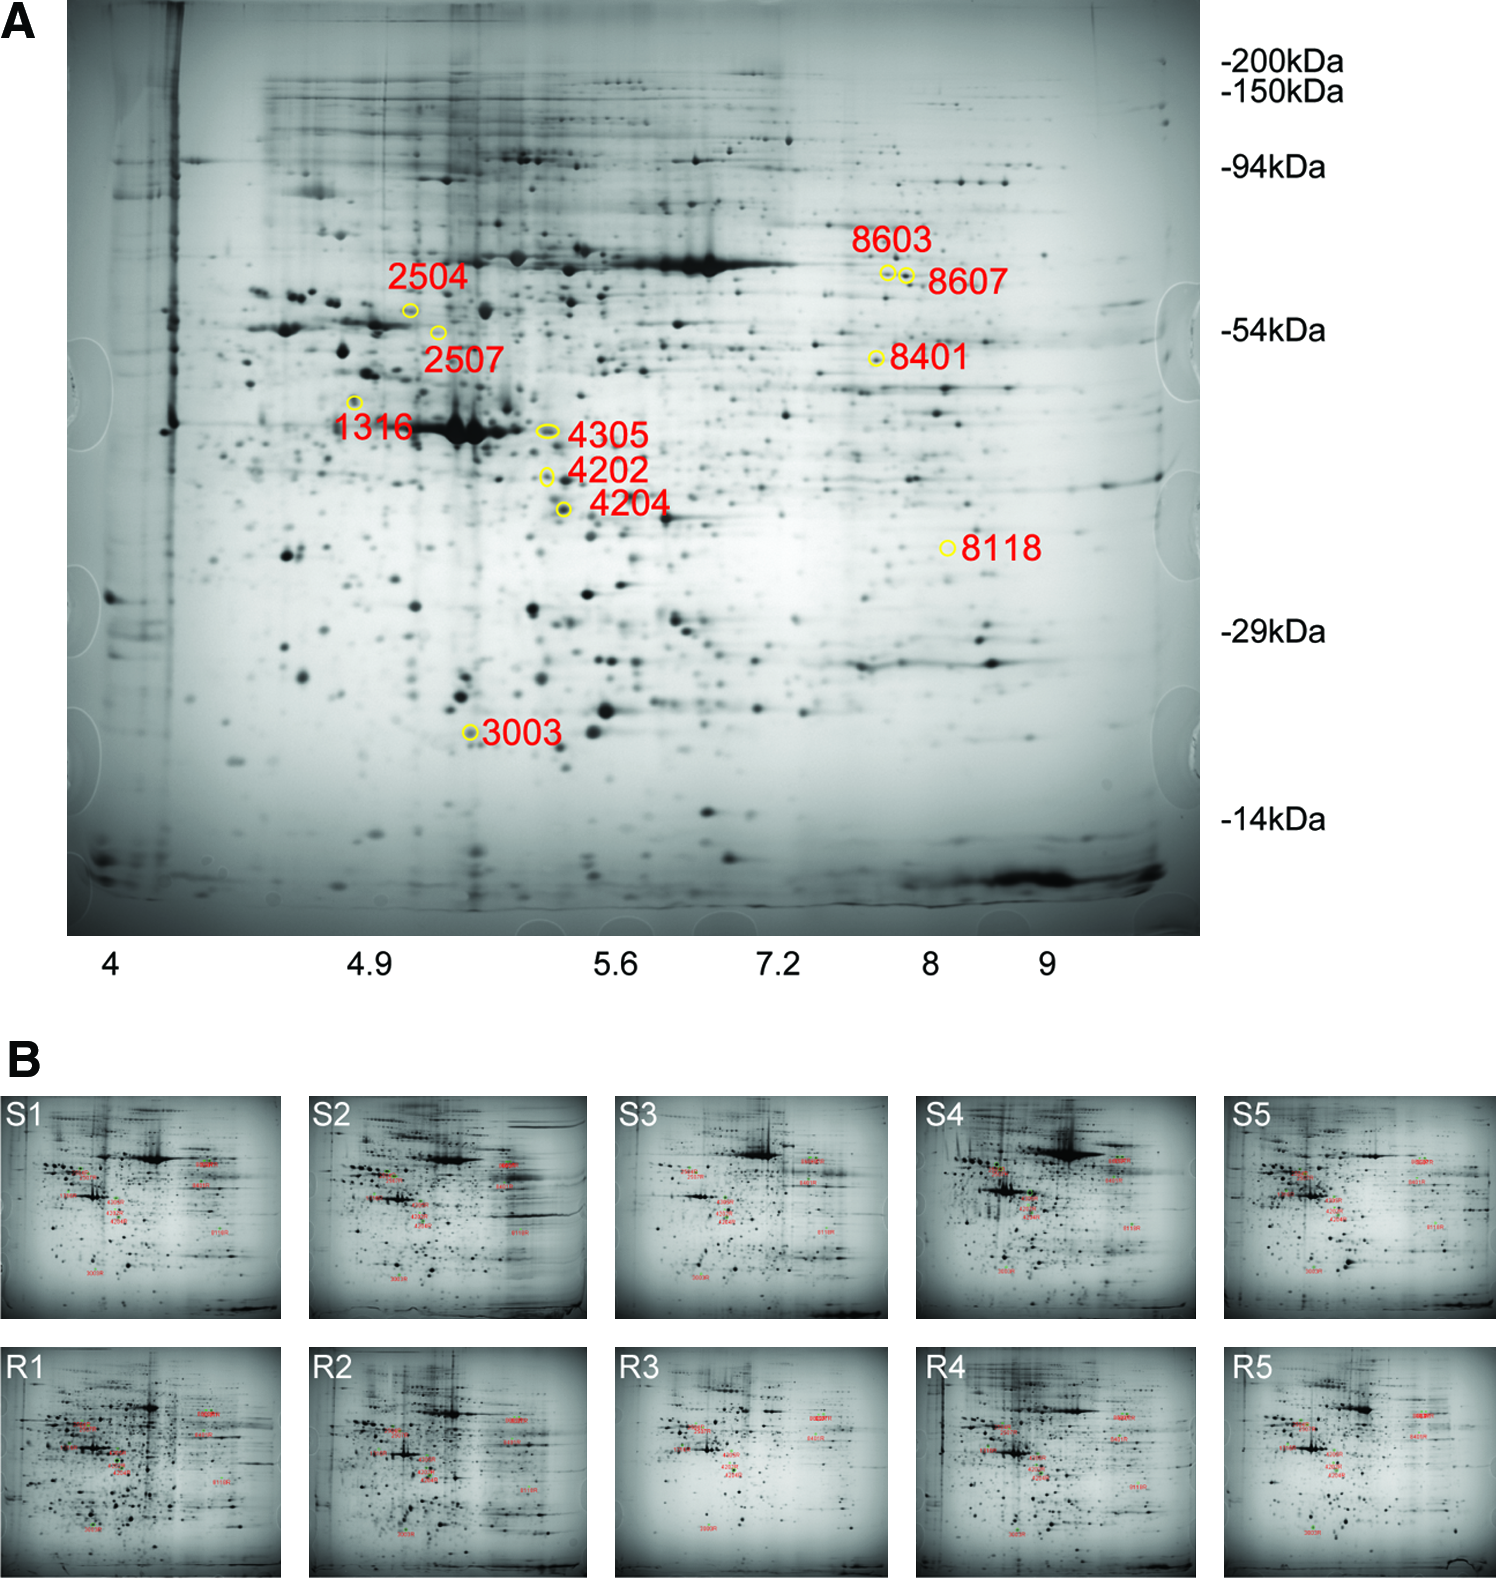
Representative 2D PAGE image (
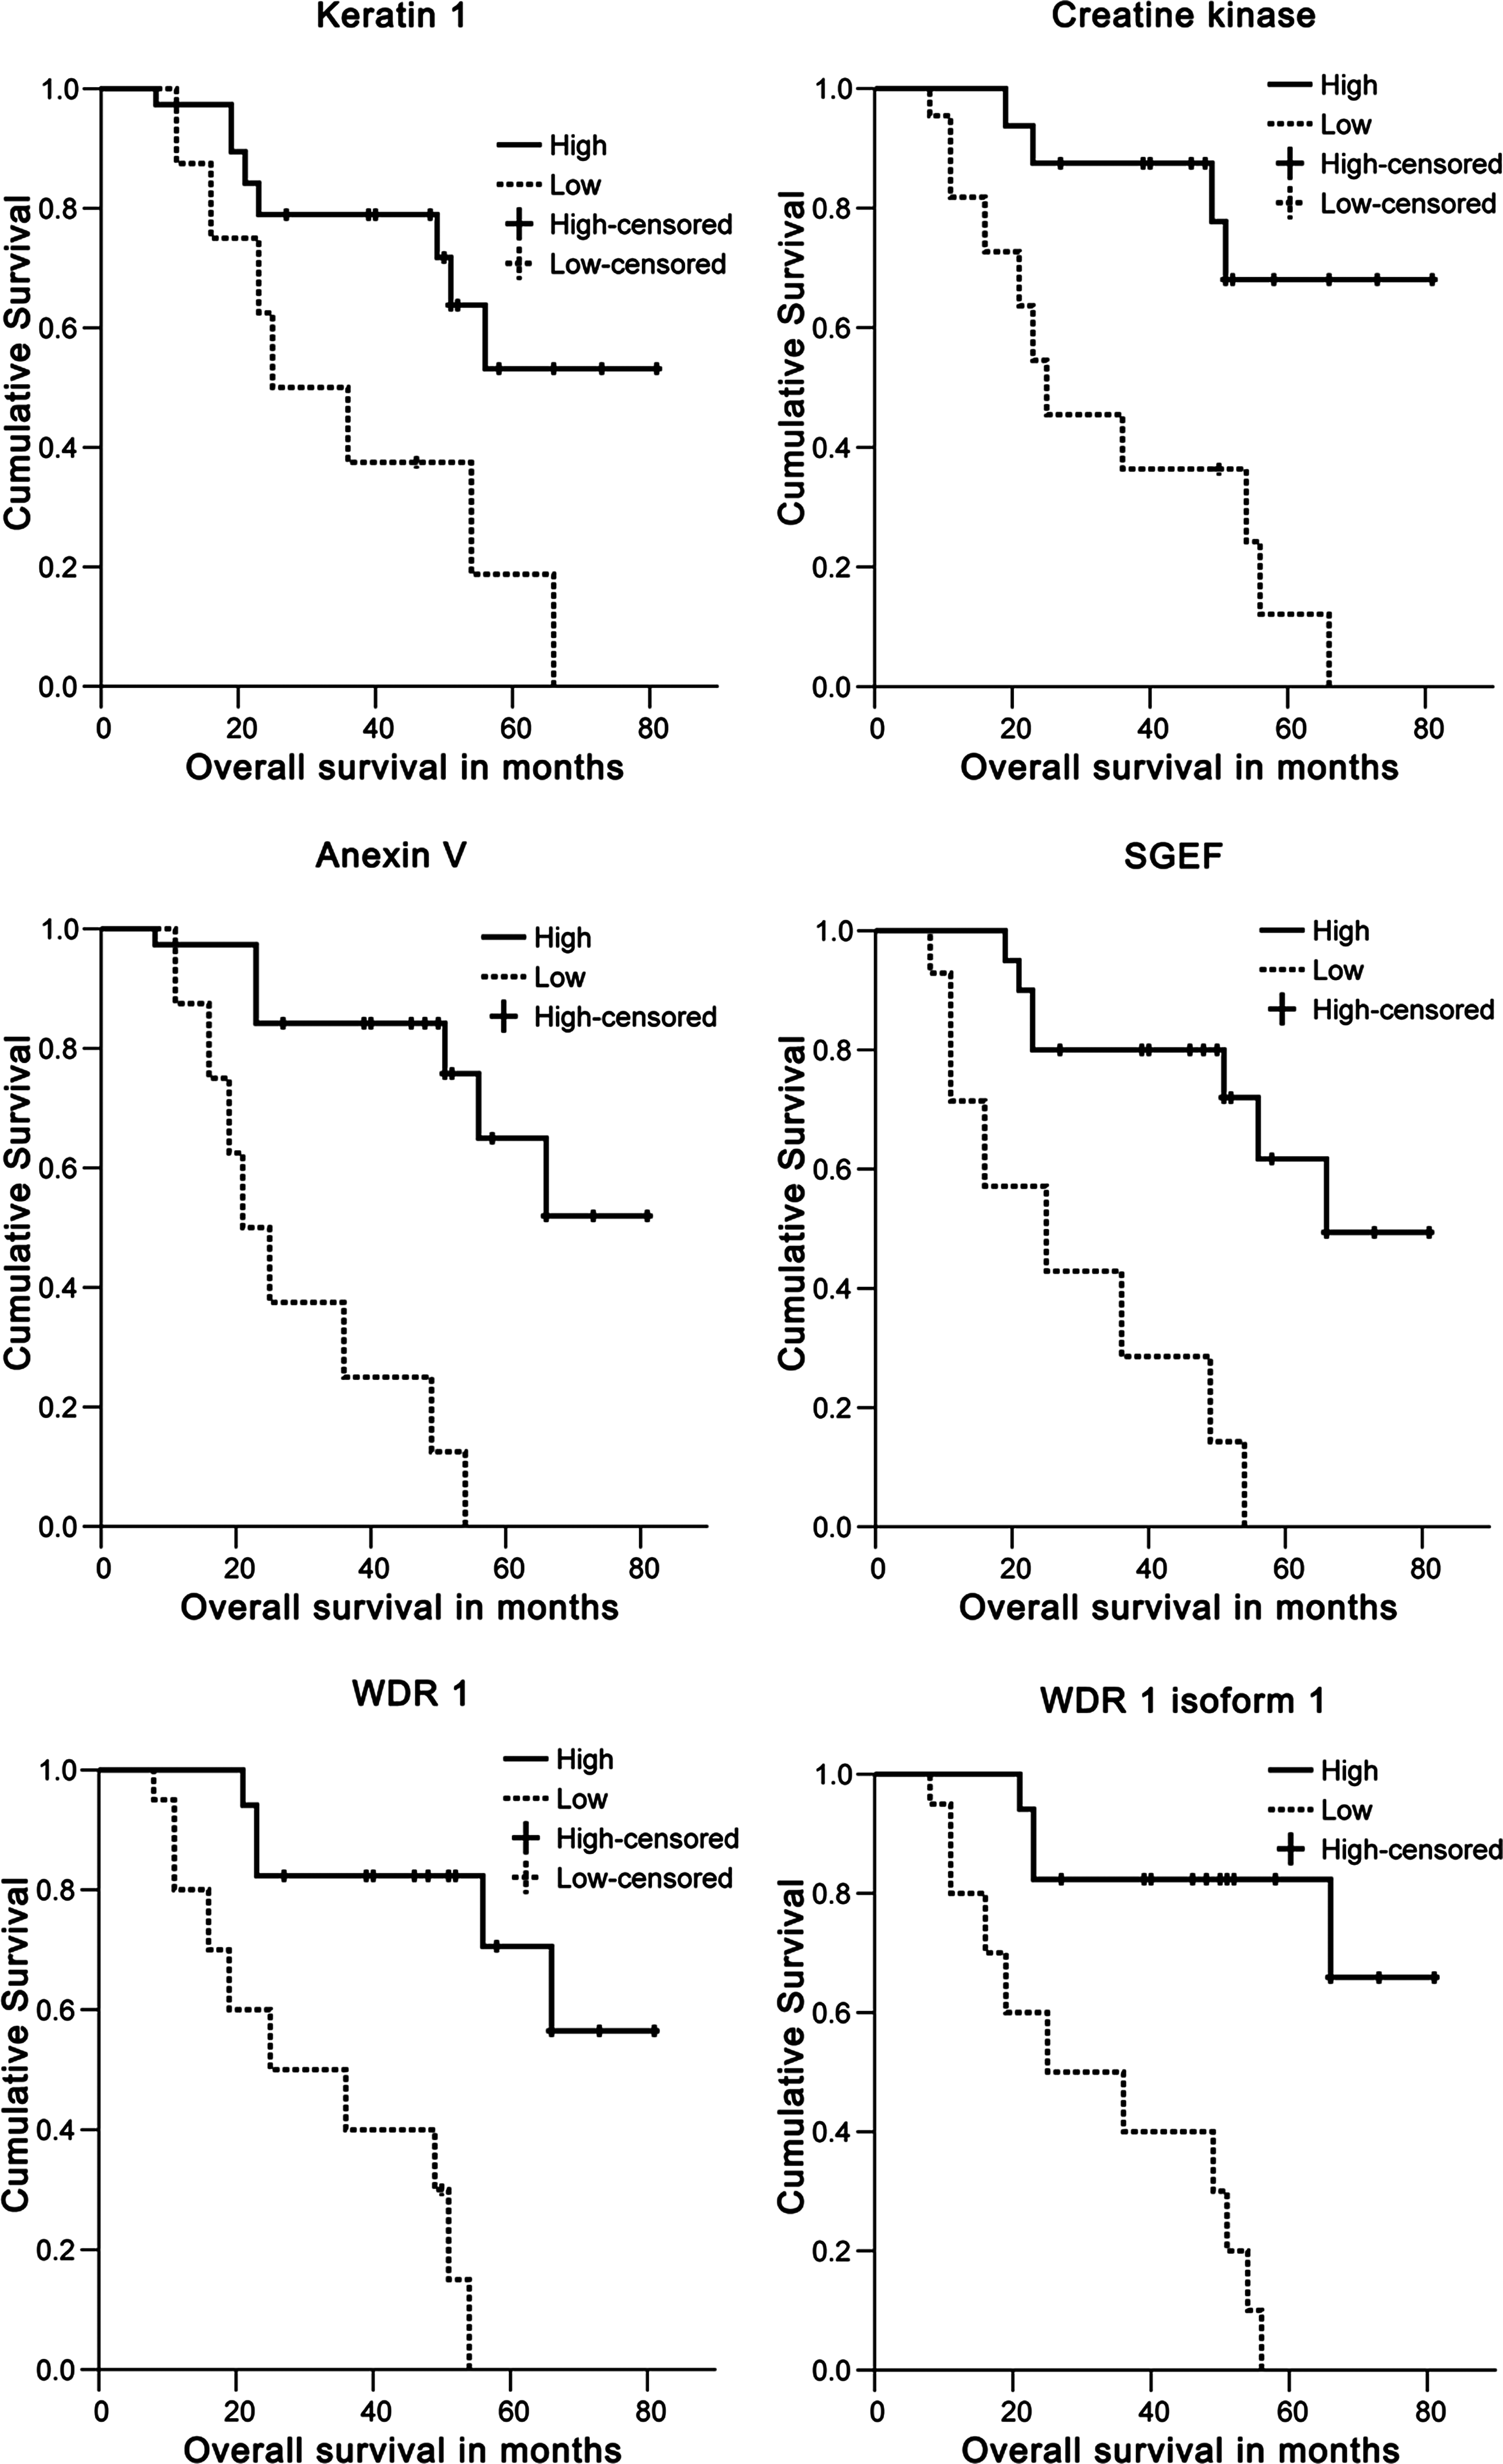
Kaplan-Meier survival curves of patients with stage IIIc primary serous epithelial ovarian cancer according to the positivity of combination of the overexpression of PDH E1-β subunit precursor and the underexpression of SGEF protein (
The peptide profiles of the protein spots treated with trypsin were analyzed by MALDI-TOF MS. The ProFound (http://129.85.19.192/profound_bin/WebProFound.exe) was used to search protein database for protein identification using peptide mass fingerprinting (PMF). Database: Swiss-Prot (10.30.200) and NCBI (nr) (10.21.2003).
Probability: the normalized probability that a protein in a database is the protein being analyzed based on data, experimental conditions and other background information.
Estimated Z is the probability that a candidate in a database search is the protein being analyzed. Z-score is the distance to the population mean in unit of standard deviation. It also corresponds to the percentile of the search in the random match population.
No. of peptides: the number of measured peptides followed by the total number of peptide matches found for the given protein.
Seq. Cov.: percent of identified sequence to the complete sequence of the known protein.
The mass and pI values specified are theoretically matched by database search.
The experimental MW and pI.
R/S: The ratio of average intensity of chemoresistant serous ovarian cancer tissues over chemosensitive serous ovarian cancer tissues.
The protein spot intensities of chemoresistant and chemosensitive serous epithelial ovarian cancer tissues were compared by Mann–Whitney U-test.
AUC: area under the ROC curve.
PPV: positive predictive value.
NPV: negative predictive value.
PFS, progression-free survival (the interval from the date of initiation of primary chemotherapy to the date of progression).
AUC: area under the ROC curve.
PDH E1bP: PDH E1-β subunit precursor.
The expression of α-tubulin, keratin 1, creatine kinase B, annexin V, and WDR1 were confirmed by immunohistochemistry (Table 6 and Fig. 3). α-Tubulin was relatively overexpressed in chemoresistant EOC tissues compared to chemosensitive tissues. Keratin 1 and creatine kinase B, and annexin V were underexpressed in chemoresistant tissues compared to chemosensitive tissues. Annexin V was mainly expressed in stromal cells of chemosensitive EOC tissues. WDR1 was strongly expressed in the cytosol of cancer cells of chemosensitive and chemoresistant EOC tissues. However, expression of WDR 1 in the nucleus was relatively low in chemoresistant EOC tissues (1+) compared to chemosensitive EOC tissues (3+).

Immunohistochemistry for annexin V (
Discussion
The OS of patients with advanced EOC remains poor because most patients show persistent disease or develop recurrent, chemoresistant disease. To avoid unnecessarily subjecting a patient to the adverse effects of anticancer drugs, it is important to understand the molecular mechanisms of anticancer-drug resistance and to identify markers capable of predicting sensitivity to chemotherapy in patients with advanced ovarian cancer.
Several studies have reported differentially expressed proteins in chemosensitive and chemoresistant ovarian cancer cells. Le Moguen et al. (2006) compared the 2D proteomic pattern of the cisplatin-sensitive ovarian cancer cell line, IGROV1, with its cisplatin-resistant counterpart, IGROV1-R10. They reported that cytokeratins 8 and 18 and aldehyde dehydrogenase 1 were overexpressed in IGROV1-R10, whereas annexin IV was downregulated. Stewart et al. (2006) reported that the expression profiles of certain proteins were correlated with cisplatin resistance in ovarian cancer cells. In this previous study, 63 proteins, including hepatocyte growth factor inhibitor 1B (13.3-fold) and programmed cell death 6-interacting protein (12.7-fold), were overexpressed in cisplatin-sensitive cells; 58 proteins, including the cell recognition molecule CASPR3 (13.3-fold), S100 protein family members (8.7-fold), the junction adhesion molecule claudin 4 (7.2-fold), and CDC42-binding protein kinase beta (5.4-fold), were overexpressed in cisplatin-resistant cells. Yan et al.(2007) compared total protein expressed in two sensitive (SKOV3 and A2780) and four resistant (SKOV3/CDDP, SKOV3/CBP, A2780/CDDP, and A2780/CBP) human ovarian cancer cell lines and reported that five overexpressed proteins, including annexin A3, destrin, cofilin 1, glutathione-S-transferase omega 1 (GSTO1-1), and cytosolic NADP+-dependent isocitrate dehydrogenase (IDHc), were coinstantaneously significant compared to parental cells.
In our study, we directly compared proteomic expression patterns via 2D gel electrophoresis in ovarian cancer tissues. It is very important to study tumor tissue itself and not cancer cells alone because the tumor's stromal microenvironment influences not only tumor progression, but also response to chemotherapy. In measuring the spot intensity, there was the possibility that a single spot had multiple proteins present in it and that the multiple proteins in a spot had caused some errors. However, there were only a few unmatched peptides in most of the protein identification in this study and these results demonstrated that there was little probability that each spot was mixed with multiple proteins. To our knowledge, this is the first report using ovarian cancer tissues that showed a differential response to postoperative adjuvant chemotherapy. Furthermore, we examined only stage IIIc serous EOC tissues treated via primary cytoreductive surgery and platinum-based postoperative adjuvant chemotherapy. We discovered that the overexpression of the PDH E1-β subunit precursor and the underexpression of keratin 1, CKB, annexin V, SGEF, WDR1, and WDR1 isoform 1 could be related to the drug-resistant phenotype in advanced serous ovarian carcinoma.
PDH catalyzes the conversion of pyruvate to acetyl-coenzyme A, which enters into the Krebs cycle and ultimately leads to the production of adenosine triphosphate. Koukourakis et al. (2005) reported that nonsmall-cell lung cancer patients with simultaneous defects in both aerobic (low PDH expression) and anaerobic (low hypoxia-inducible factor-1α or low lactate dehydrogenase 5) metabolism showed favorable outcomes.
Keratin 1 is a specific marker for terminal differentiation in the mammalian epidermis (Lessin et al., 1988). In our study, keratin 1 was downregulated in chemoresistant ovarian cancer tissues, suggesting that chemoresistant ovarian cancers are less differentiated compared to chemosensitive ovarian cancers.
The underexpression of creatine kinase (CK), which is involved in the regeneration of ATP, was also correlated with poor clinical outcomes in this study. Huddleston et al. (2005) reported that CKB gene expression was upregulated in ovarian cancer cells both in vitro and in vivo, and that CKB enzyme activity was significantly elevated in sera from ovarian cancer patients, including those with stage I disease. The authors suggested a potential role for CKB as a marker for early diagnosis. In 1995, Zarghami et al. (1995) examined the prognostic value of the CK-BB isoenzyme in epithelial ovarian carcinoma; the authors reported that CK-BB levels were higher in endometrioid cell carcinomas, but that CK-BB was not associated significantly with either disease-free sruvival (DFS) or OS. They concluded that CK-BB levels had no prognostic value in ovarian cancer. However, in our study, CKB was downregulated in chemoresistant ovarian serous adenocarcinoma tissues. In general, CK is found in high concentrations in cells with high energy requirements. Actively proliferating cancer cells usually require high energy and are more sensitive to antineoplastic drugs than are quiescent (G0) cells. CKB underexpressing cancer tissues may thus be in a more quiescent state and subsequently are more resistant to antineoplastic drugs.
Annexin V belongs to a family of Ca2+-dependent phospholipid binding proteins, known as annexins, which bind to phospholipids that are preferentially located on the cytosolic face of the plasma membrane. Annexins have diverse functions, including cell division, apoptosis, Ca2+ signaling, growth regulation, and secretory functions involving the exocytotic and endocytotic pathways (Monastyrskaya et al., 2007; Yeatman et al., 1993). Previously, annexin IV and XI were reported to be associated with acquired cisplatin resistance in ovarian cancer and were proposed as predictive markers of chemoresistance to platinum-based chemotherapy (Le Moguen et al., 2006; Song et al., 2007). In our study, annexin V was downregulated in chemoresistant serous EOC tissues and may represent a useful biomarker of chemoresistant disease.
Leukocyte transendothelial migration (TEM) is a key event in host defense. During TEM, leukocytes use adhesion receptors, such as intercellular adhesion molecule-1 (ICAM1), to adhere to the endothelium (Barreiro et al., 2002). Van Bull et al. (2007) reported that ICAM1 colocalizes with RhoG and binds to the RhoG-specific SGEF. Silencing SGEF also resulted in a substantial reduction in RhoG activity, cup formation, and TEM. In our study, SGEF was downregulated in chemoresistant serous EOC tissues, suggesting that SGEF underexpression results in reduced leukocyte TEM and perhaps a subsequent reduction in the immune response to cancer cells. This may then result in a reduced response to antineoplastic drugs and poor OS.
Tryptophan-aspartate (WD) repeat proteins are found in all eukaryotes and play an important role in the regulation of a wide variety of cellular functions, such as signal transduction, transcription, and proliferation (Adam-Klages et al., 1996; Liliental and Chang, 1998). WD repeat-containing proteins interact with histone deacetylases (HDACs) and function as transcriptional repressors to regulate the expression of genes involved in the cell cycle and chromatin assembly (Mitsuzawa et al., 2001; Yoon et al., 2004). For instance, the WD repeat-containing mitotic checkpoint proteins Bub3 and Cdc20 act as transcriptional repressors during interphase (Yoon et al., 2004). Adler et al. (1999) reported that the WDR1 gene was expressed at high levels in the acoustically damaged chick basilar papilla. They identified a chicken gene encoding a protein composed almost entirely of nine WD repeats, which they named WDR1. However, because little is known regarding the function of the WDR1 protein, further studies are required to elucidate its role in the cell cycle.
The proteins identified in this study have potential as markers of chemoresistant disease in patients with advanced serous EOC. In serous EOC patients without these over- or underexpressed proteins, six cycles of platinum-based combination chemotherapy may be sufficient, and further consolidation therapy could be avoided. Conversely, patients exhibiting over- or underexpression of these proteins may require additional treatment modalities to improve patient survival rate. However, these data are the result of a preliminary investigation into differential protein expression in serous ovarian cancer tissues. Before they can be considered reliable predictive markers of chemoresistant disease, further analyses in large-scale studies are required.
In conclusion, 2D PAGE-based comparative proteomic analysis of chemoresistant or chemosensitive serous EOC tissues revealed several proteins that are differentially expressed in chemoresistant serous ovarian carcinomas. This study provides further insight into chemoresistant serous EOC and suggests that differentially expressed proteins may be useful as predictive markers of chemoresistant disease.
Footnotes
Acknowledgments
This study was supported by a faculty research grant from the Yonsei University College of Medicine (6-2007-0130).
Author Disclosure Statement
The authors declare there are no conflicts of interest.
References
Supplementary Material
Please find the following supplemental material available below.
For Open Access articles published under a Creative Commons License, all supplemental material carries the same license as the article it is associated with.
For non-Open Access articles published, all supplemental material carries a non-exclusive license, and permission requests for re-use of supplemental material or any part of supplemental material shall be sent directly to the copyright owner as specified in the copyright notice associated with the article.
