




Abstract
Abstract
Metabolomic analysis was carried out to investigate the metabolic differences of diploid (α/a) and homogenous haploid (α,a) yeasts, and further assess their response to ethanol stress. The dynamic metabolic variations of diploid and haploid caused by 3 and 7% (v/v) ethanol stress were evaluated by gas chromatography coupled to time-of-flight mass spectrometry combined with statistical analysis. Metabolite profiles originating from three strains in presence/absence of ethanol stress were distinctive and could be distinguished by principal components analysis. Results showed that the divergence among the strains with ethanol stress was smaller than without it. Furthermore, the levels of most glycolytic intermediates and amino acids in haploid were lower than these in diploid with/without ethanol stress, which was considered as species-specific behaviors. The increases of protective metabolites including polyols, amino acids, precursors of phospholipids, and unsaturated fatty acids under ethanol stress in three strains revealed the ethanol stress-specific responses. Higher fold change in most of these protectants in haploid indicated that haploid was more susceptible to ethanol stress than diploid. These findings provided underlying basis for better understanding diploid and haploid yeasts, and further breeding tolerant strains for efficient ethanol fermentation.
Introduction
Accumulation of target product ethanol in the medium is toxic to cells during ethanol fermentation by yeast. The adverse effects include the seriously damage of cellular proteins and nucleic acids, modification of membrane lipid composition and fluidity, stimulation of the ATPase activity, therefore inhibiting growth, viability, glucose uptake, amino acid metabolism, and target product formation (Aguilera et al., 2006; Ding et al., 2009a; Ingram and Buttke, 1984; Trabalzini et al., 2003). Yeast cells exhibit complex responses for counteracting ethanol stress, for example, activation of signal transduction pathways, induction of stress proteins, increase of energy metabolism, accumulation of effectively protective molecules, and change of membrane composition (Estruch, 2000; Piper, 1995; Snowdon et al., 2009). Rapid accumulation of compatible solutes including sugars (e.g., trehalose), polyols (e.g., glycerol), and amino acids (e.g., proline) was often regarded as a basic strategy for yeast to survive stress conditions (Attfield, 1997; Vriesekoop et al., 2009). Because the ethanol-tolerant and robust yeast strains are highly desired in the industrial process, understanding the metabolic regulation of diploid and haploid yeast in response to ethanol stress will contribute to breeding robust strains for efficient ethanol fermentation, which is of particular importance for fuel ethanol production.
As an important part of systems biology, metabolomics has been proved to have special advantages for understanding what has happened and is happening inside a cell in biological process (Weckwerth, 2003). The genotype and environmental factors are therefore translated into the phenotype, reflecting the cellular metabolic state more realistic at a functional level (Fiehn, 2002). So far, the metabolic difference between diploid and haploid yeast and their ethanol stress response remain obscure. Consequently, it is necessary to gain insights into diploid and haploid yeast by metabolomics.
In our previous works, metabolomics technology has been applied to study the responses of S. cerevisiae (Ding et al., 2009b, 2009c, 2010) and Taxus cuspidata cells (Han and Yuan, 2009a, 2009b) to stress conditions. In this study, we will investigate haploid and diploid S. cerevisiae in the presence of 3 and 7% (v/v) ethanol to focus on a quantitative characterization and comparison of their metabolic responses. Taking advantage of the metabolomic strategy, the different molecular events underlying the response of diploid and haploid yeast to ethanol stress are revealed.
Materials and Methods
Strains
The diploid yeast strain (MAT α/a) used in this study was an ethanol-tolerant S. cerevisiae (CGMCC 2758), which was domesticated evolutionary engineering. Two different haploids, MAT a (CGMCC 2758-1) and MAT α (CGMCC 2758-2), were obtained by sporulation from the ethanol-tolerant diploid yeast.
Fermentation conditions
A single colony of each strain was picked from a YEPD agar plate (10 g/L yeast extract, 20 g/L peptone, 20 g/L glucose, and 20 g/L agar). Each colony was inoculated into a 250-mL flask that contained 50 mL of preculture medium (10 g/L yeast extract, 20 g/L peptone, and 50 g/L glucose), incubating overnight at 150 rpm and 30°C as the fermenting seed for the following culture.
For metabolomic analysis, fermentations were performed in 5-liter fermentors (1.5BG-4-3000, BXBIO, Shanghai, China) with added ethanol of 0, 3, and 7% (v/v, final concentration) at 30 ± 0.5°C, with a stirring rate of 300 rpm. The initial optical density at 600 nm (OD600) of yeast cells in the medium was equaled to 0.5. The experiment under each condition was done twice. Comparative metabolomic study was carried out for diploid versus haploid, with and without added ethanol in the medium.
Glucose concentration in fermentation medium was analyzed by HPLC (Waters Corp., Grand Rapids, MI), using a Bio-Rad Aminex HPX-87H organic acid column fitted with an RI detector at 45
Sample extraction
For metabolic profiling, both diploid and haploid cells were harvested at exponential phase (OD600 was about 2.5) to investigate the response to ethanol stress. Cells were quenched and extracted as described previously (Ding et al., 2009b). Briefly, fresh cells (50 mg) were prepared by grinding in liquid nitrogen. Subsequent extraction was carried out twice using methanol/water (1:1, v/v) at −40°C. The mixture was subjected to freeze and thaw in liquid nitrogen for three cycles. After centrifugation for 5 min at 5,000 × g, the supernatant was collected combined with the former one. The internal standard (IS) solution (0.14 mg/mL succinic d4 acid, 50 μL) was added to 150 μL aliquots before lyophilization.
GC-TOF/MS analysis
Samples were derivatized and analyzed by gas chromatography coupled to time-of-flight mass spectrometry (GC-TOF/MS) as previously published (Ding et al., 2009b). The derivatized solution was injected into Agilent 6890 GC using Agilent 7683 autosampler under split mode. A fused silica capillary column of 30 m length, 0.25 mm inner diameter, and 0.25-μm film thickness (J&W Scientific, Folsom, CA) was used for separation. The temperature program started at 70°C for 2 min, which was followed by a temperature ramp of 8°C/min to 290°C, and then equilibrated to 70°C prior to next injection. The detection limit for the TOF/MS (Waters Corp.) was 5 ppm. Mass spectra were acquired for a scanning range of 50−800 m/z. The temperature for the ion source was set to 250°C.
Automated peak detection, deconvolution and library searches were performed with Masslynx software (Version 4.1, Waters Corp.) as described previously (Ding et al., 2010). Mass spectra were identified by comparing the mass fragmentation patterns of individual component with commercially available NIST mass spectral library. Additionally, the on-line Golm Metabolome Database (http://csbdb.mpimp-golm.mpg.de/index.html) was also used for mass spectra searches. Metabolites were identified based on the spectrum similarity. Within each chromatogram, the acquired peak areas of each analyzed compound were normalized with that of IS for further data analysis.
Statistical analysis
Principal components analysis (PCA) was carried out after preprocessed by mean-centering and scaling to analyze the dataset with Matlab software (MathWorks, R2008a). In the PCA score plot, each data point represented a linear combination of all the metabolites from each sample. This analysis allowed the clustering of biological samples based on their similarities and differences in metabolites dataset. Distances between the groups of samples gave a measure of the overall difference among the metabolite profiles of different strains with different treatments. Five replicate values were used to perform multivariate statistical analysis for each sample. Significance level of metabolites abundance influenced by ethanol stress relative to the data without ethanol was identified by a two-tailed Student's t-test performed with Microsoft Excel. Significance levels: *p < 0.05, **p < 0.01, ***p < 0.001.
Results
Metabolic profiling and multivariate statistical analysis
This work investigated the metabolic differences between diploid and haploid S. cerevisiae, with an emphasis on assessing the metabolic response to ethanol stress. Because of unsurpassed separation power, sensitivity, and reproducibility, the high-throughput GC-TOF/MS was applied here for metabolic profiling. From the total ion current (TIC) chromatograms of diploid and haploid yeasts as shown in Figure 1, more than 130 intracellular metabolites were detected. Within the detected compounds that belonged to certain chemical classes (amino acids, organic acids, polyols, phosphorylated compounds, and saccharides), some metabolites changed a lot, indicating a significant difference between the metabolome of diploid and haploid. It was shown in Figure 1 that the highest peak intensity of intracellular metabolites in a-type haploid yeast (Fig. 1A) were 4.57e5, which was significantly lower than that in α-type haploid (7.49e5, Fig. 1B) and diploid (7.86e5, Fig. 1C), suggesting that the metabolic profiling of diploid yeast was more similar with that of α-type haploid. This result was in agreement with the growth and fermentation characteristics that the growth and glucose consumption rate were slower in a-type haploid than α-type haploid and diploid; particularly, diploid was the fastest in presence/absence of ethanol stress (Supplementary Fig. 1A and B).
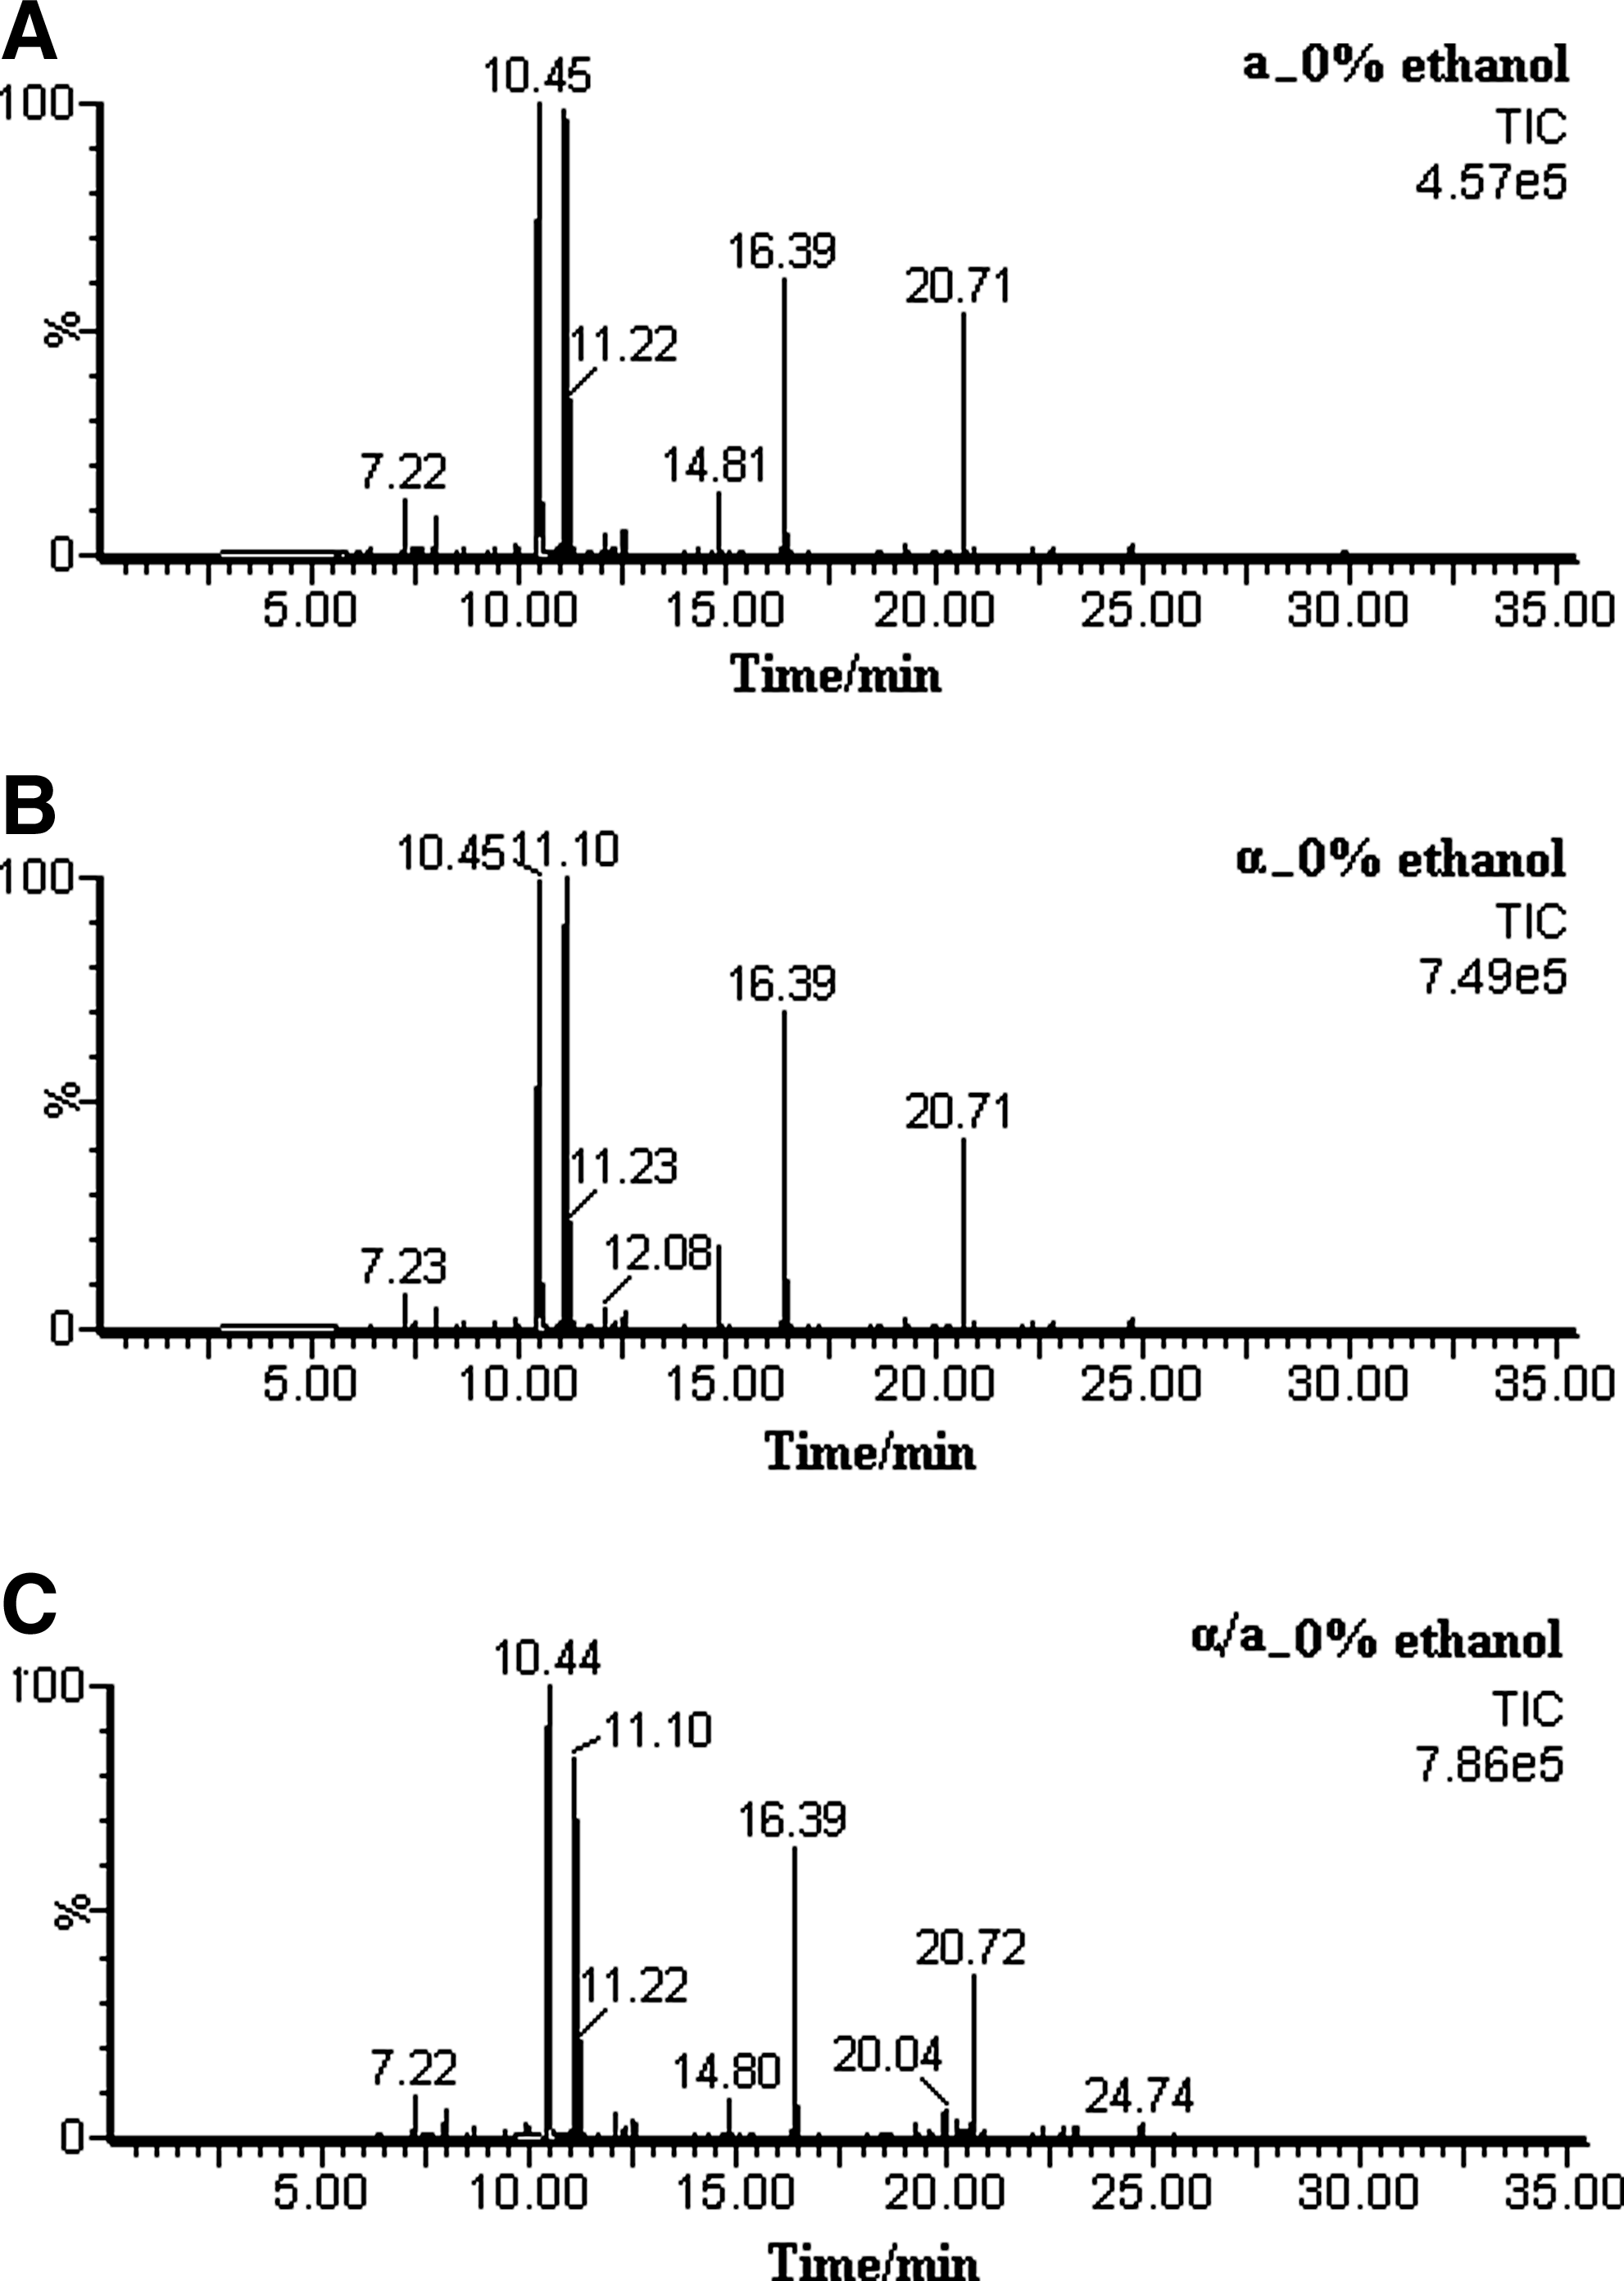
Total ion current (TIC) chromatograms of
To investigate the basic metabolic states in diploid and haploid as well as their distinction in response to ethanol stress, we used unsupervised clustering methods to observe global trends that were remarkably different between them. The metabolic profile dataset was statistically analyzed by PCA to gain insight into the nature of the multivariate data and evaluate biological alteration. The resulting PCA score plot for the first three principal components accounted for 81.5% of the total sample variance (Fig. 2). It was apparent that the replicate analysis of samples under each individual condition grouped together, which validated high reproducibility of the experimental procedure from cell harvest to data analysis. The nine experimental groups of diploid and haploid cells with 0, 3, and 7% ethanol stress were clearly distinguished (Fig. 2) for their significant metabolic differences. Particularly, the distinction of each strain with different ethanol stress was more dramatic than that of three strains under the same condition, indicating that the influence of ethanol stress on each strain was more significant than the difference among three strains. Interestingly, the samples of diploid and α-type haploid without ethanol stress were closer to each other, and the a-type haploid was far from them. However, the samples of three yeast strains clustered together under 3 or 7% ethanol stress. These results suggested that the metabolic difference between diploid and haploid became smaller under ethanol stress. Moreover, when diploid and haploid samples were analyzed under each concentration of ethanol stress, the clustering pattern of three strains was formed (Supplementary Fig. 2A, B, and C). Similar results were observed by further analysis on samples of each strain in response to different ethanol concentrations (Supplementary Fig. 2D, E, and F). Results indicated that diploid and haploid displayed distinctively metabolic characteristics with/without ethanol stress.
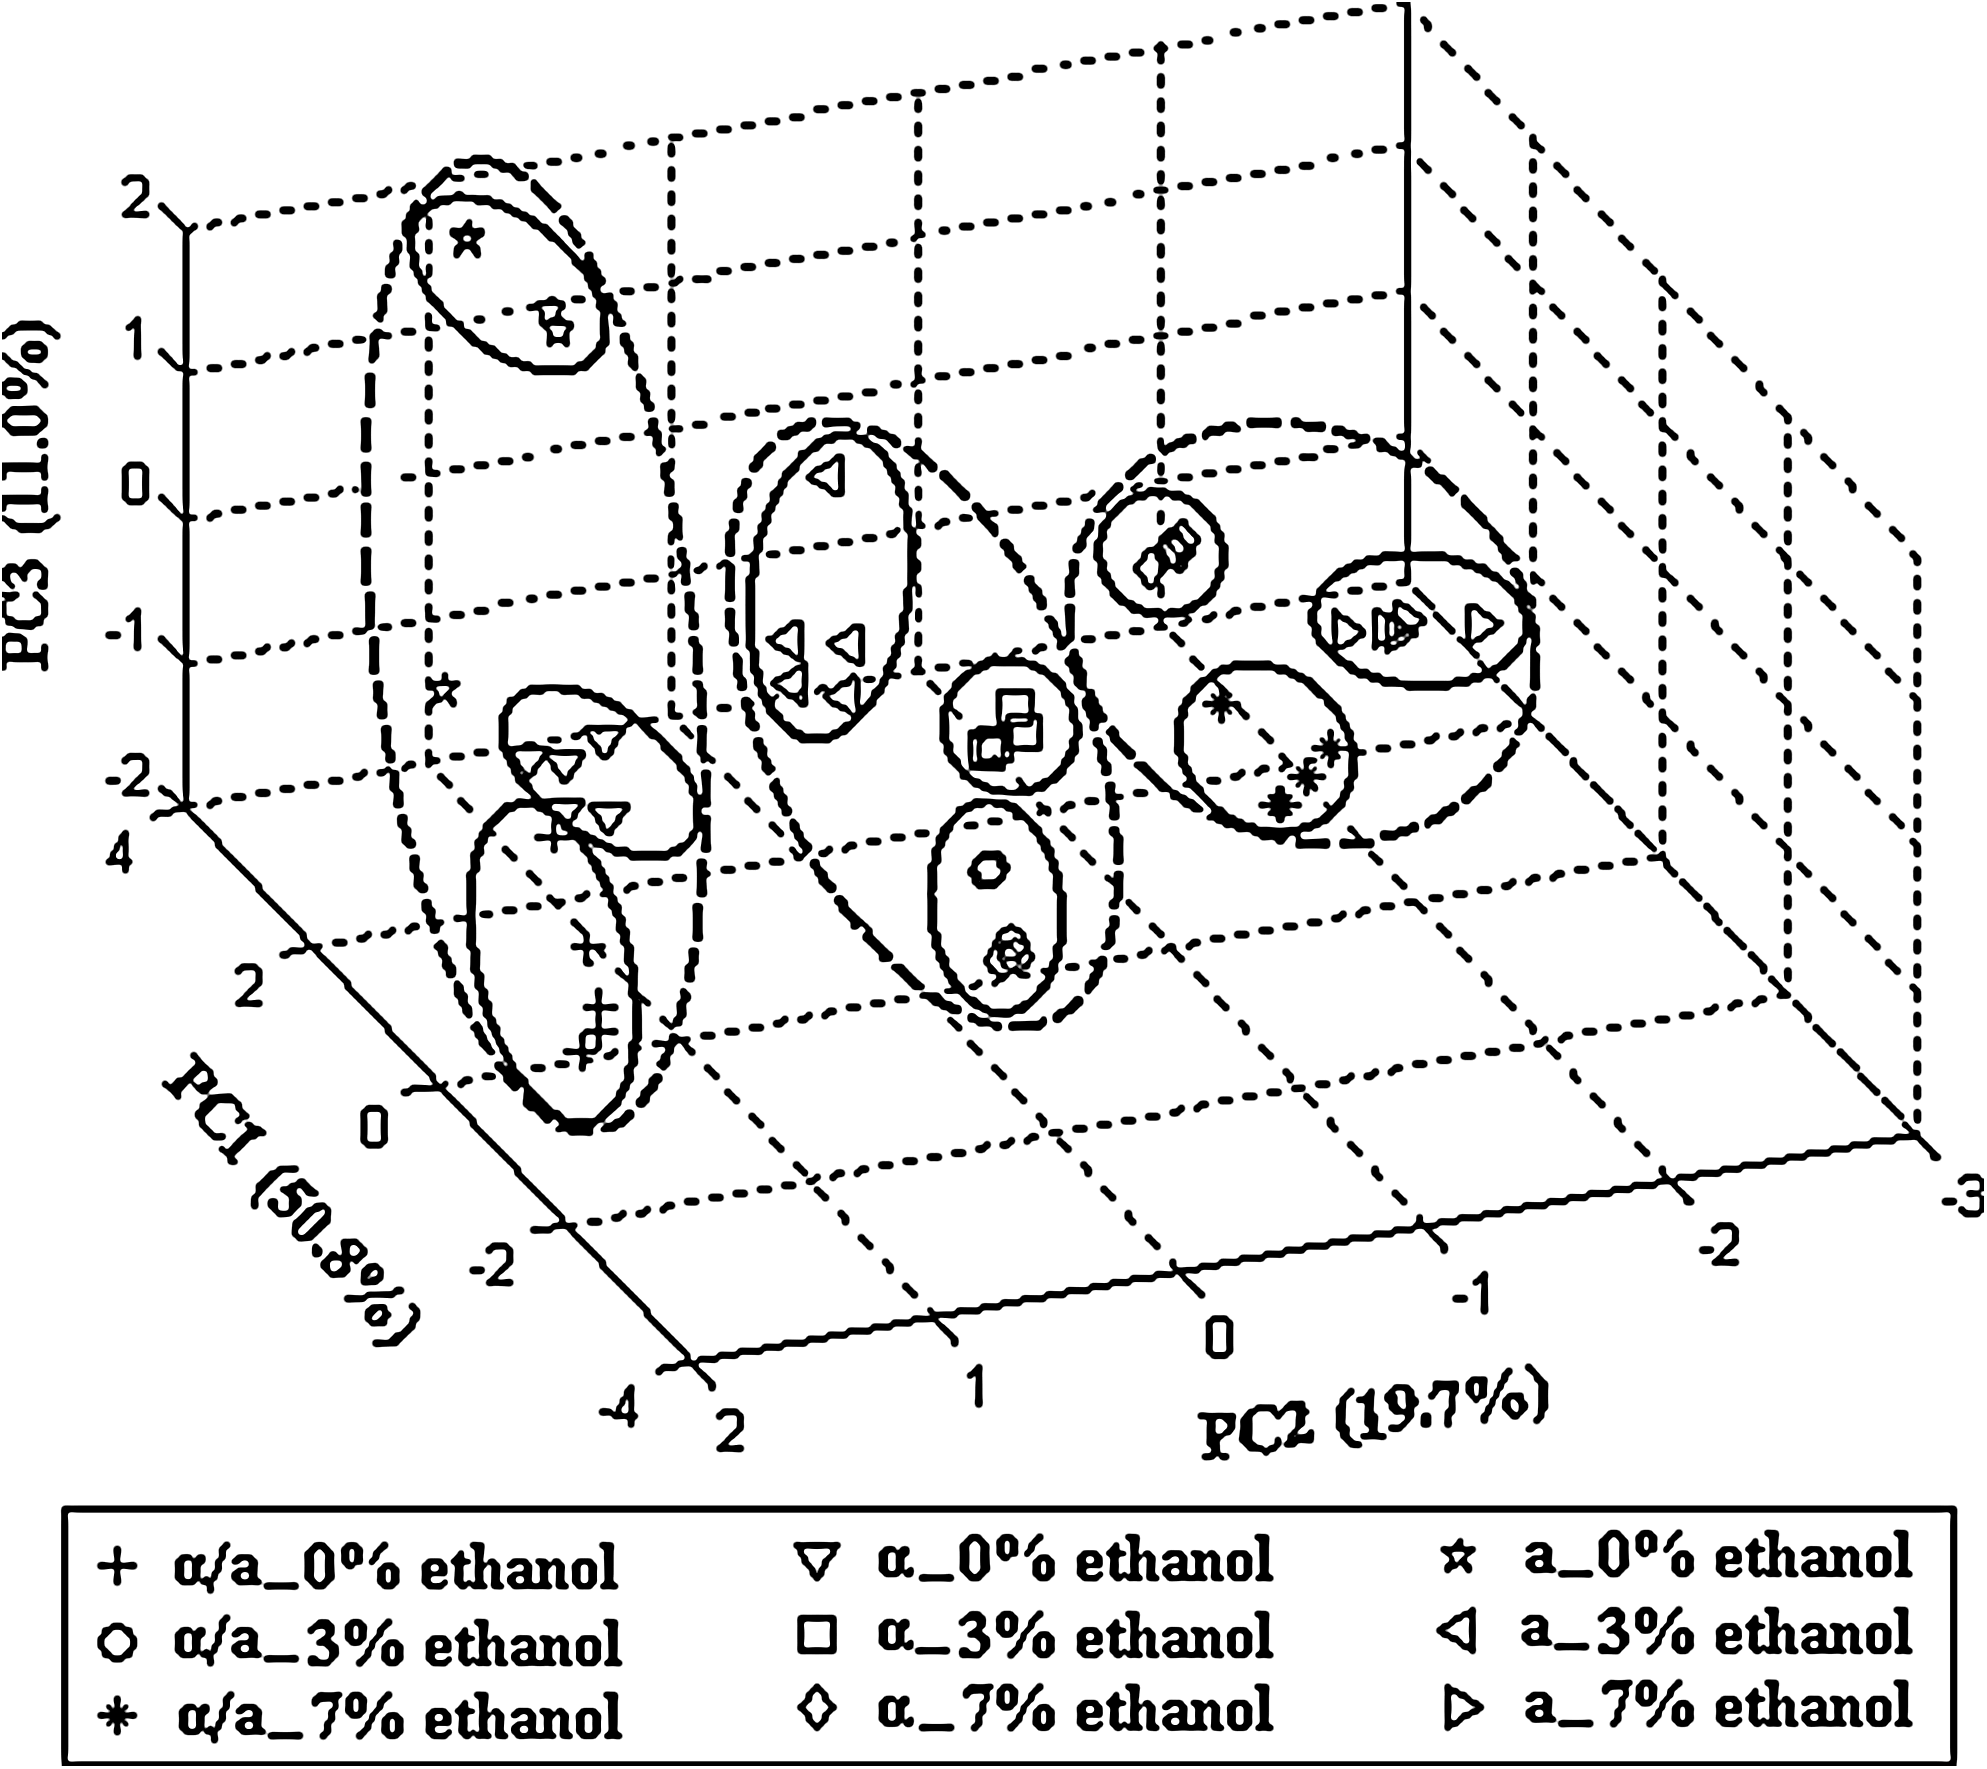
PCA score plot of diploid and haploid yeasts from fermentation with 0, 3, and 7% ethanol stress, extracted from the normalized peak area data of the five experimental groups. Each point represents the combination of metabolites in one sample, shaped by sample type.
Metabolic differences between haploid and diploid under ethanol stress
Our approach for quantitative understanding the cellular metabolic regulation of diploid and haploid yeasts revealed the dynamic metabolite variations in response to ethanol stress. Apart from performing multivariate data analysis to examine the global variations between different experimental conditions, the change of individual compound was analyzed in greater detail. Specifically, by analyzing the metabolites differentiation between diploid and haploid yeasts, we revealed that the intermediates of glycolysis, TCA cycle, and amino acid biosynthesis were identified to be of particular importance. Compared to haploid yeast, the diploid yeast was characterized by higher intracellular levels of glycolytic intermediates (e.g., glucose-6-phosphate and pyruvic acid) (Fig. 3A) both with and without ethanol stress. Citrate (Fig. 3B), which was the most important compound in TCA represented the similar differentiation to pyruvic acid among three strains. Other TCA intermediates including malate, fumarate, and succinate all represented significantly different levels in α-type haploid yeast compared with other two strains with 0 or 3% ethanol stress (Fig. 3B). Malate and fumarate were lower in α-type, whereas succinate represented a higher level in this strain. However, in the presence of 7% ethanol, most of the glycolysis and TCA intermediates represented the highest levels in diploid and the lowest levels in a-type haploid.

Differences of intermediates of
To evaluate the metabolic states in diploid and haploid under ethanol stress, the variations of measured amino acids were viewed in clustered heat-map format and their respective related pathway in central carbon metabolism was labeled (Fig. 4A). It revealed that the levels of most amino acids in haploid yeast were lower, particularly in a-type, relative to diploid. This observed difference was consistent with the result of multivariate analysis. Furthermore, total amino acid content in the a-type haploid dramatically increased in presence of ethanol stress, comparing with a slight increment in α-type haploid (Fig. 4B).

Stress protectants for ethanol stress
Our approach also captured the widespread effects of ethanol stress on metabolic pathways in both diploid and haploid, by identifying a number of significantly influenced metabolites, including polyols, precursors of phospholipid, amino acids and unsaturated fatty acids (Fig. 5). In ethanol stress-treated cells, sorbitol, ethanolamine, myo-inositol, proline, serine, palmitoleic acid, and oleic acid, which were related to stress tolerance, were all induced significantly. These induced metabolites observed probably suggested that these compounds participated in protecting cells from the damage of ethanol stress. Intracellular glycerol, the ethanol stress protectant, was induced by ethanol stress in diploid. However, glycerol was reduced in haploid, which was considered to be related to the increased cell membrane permeability. Furthermore, it was revealed that the levels of proline, serine, and ethanolamine were the highest in diploid, whereas they were the lowest in a-type haploid with 0, 3, and 7% ethanol stress. Particularly, palmitoleic acid, oleic acid and myo-inositol in α-type were all abruptly increased for more than five times caused by 7% ethanol stress.
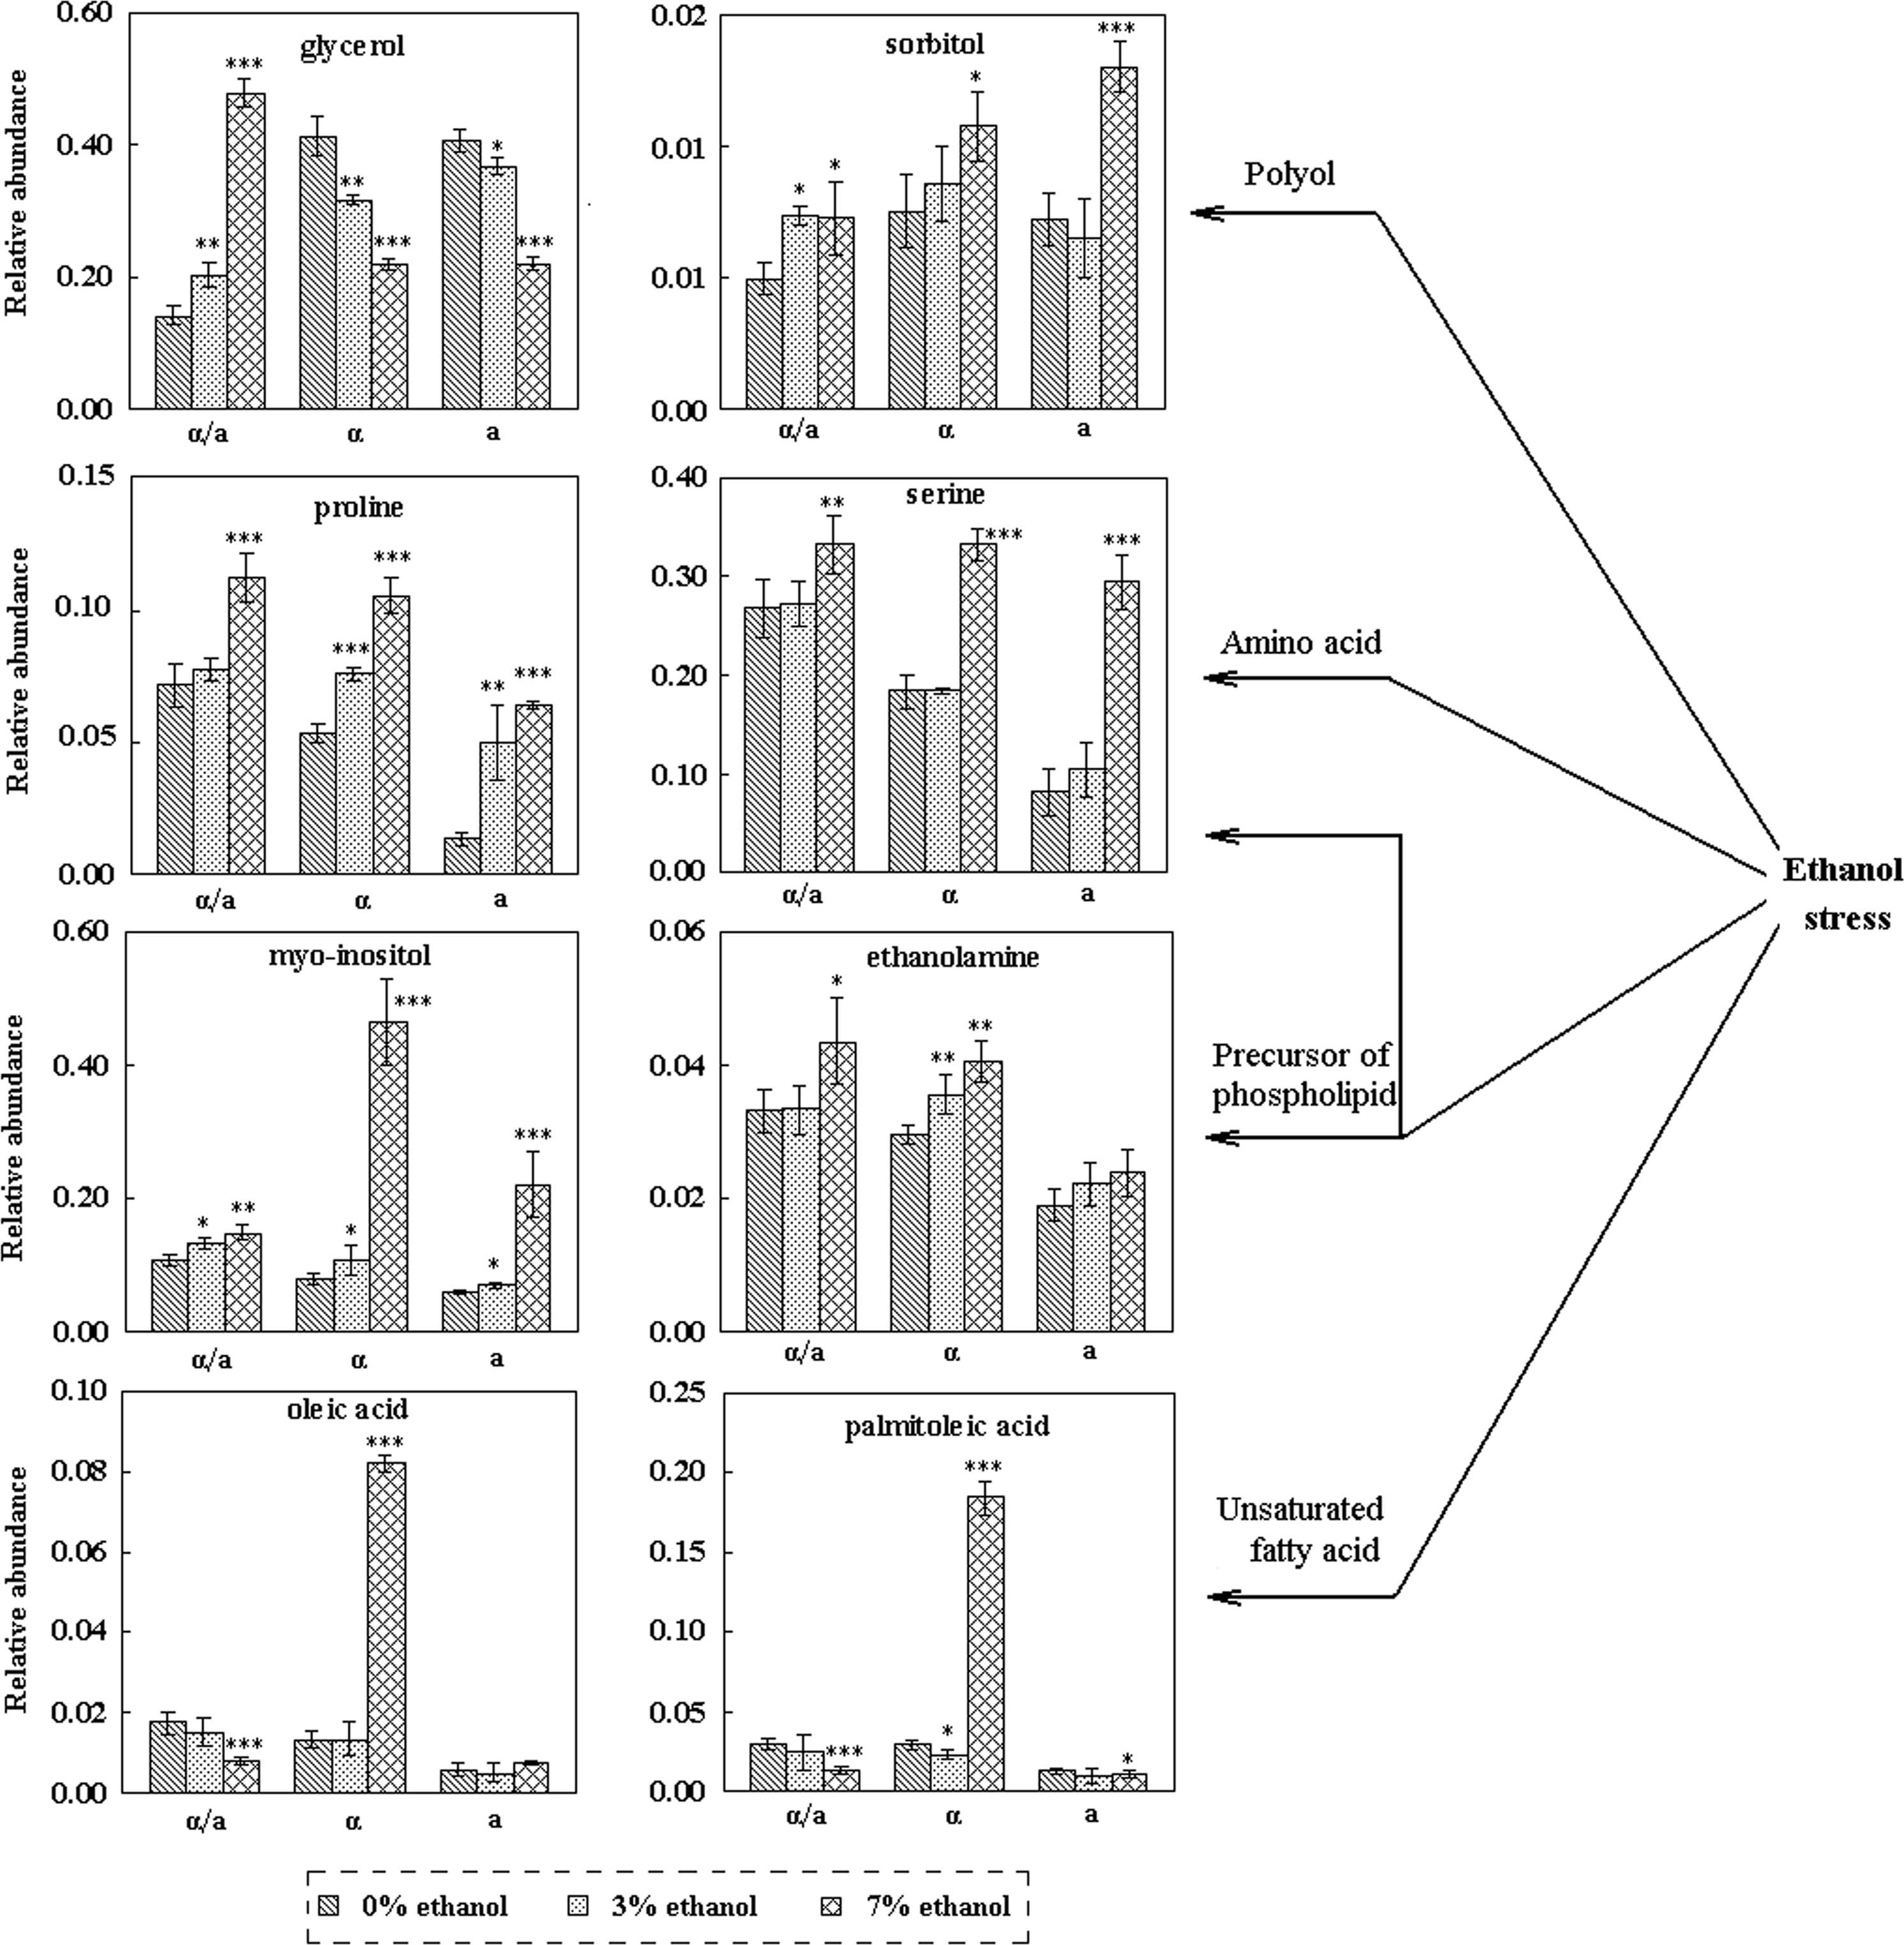
Variations of ethanol stress-related metabolites in diploid and haploid yeast. The relative abundance was calculated by normalization of peak area of each metabolite to IS, and each value represented the mean value of five independent replicates ± SD.
Discussion
Differences in carbon and nitrogen metabolism between diploid and haploid
In this study, metabolomic analysis revealed the different characteristics between diploid and haploid yeasts in response to ethanol stress, which extended from the whole metabolome to specific metabolic pathways. First, our analysis focused on quantitatively estimating their differences in specific pathways. The impacts of ethanol stress on the yeast primary carbon and nitrogen metabolism were all mainly dependent on ploidy, revealing a distinctive stress response mechanism between haploid and diploid yeast. Compared to haploid, the less inhibited growth rate and glucose uptake in diploid (Supplementary Fig. 1A and B) illustrated that diploid yeast represented better metabolic activity and displayed higher resistance to ethanol stress. It was reported that the glycolytic rate (Vriesekoop et al., 2007) and the expression of TCA cycle genes (Olguín et al., 2009) were drastically inhibited in exposure to ethanol stress. More significantly changed levels of glycolysis (Fig. 3A) and TCA cycle (Fig. 3B) intermediates in diploid indicated that central carbon metabolism in diploid yeast was affected more severely by ethanol stress than that in haploid. However, diploid still exhibited better metabolic ability than haploid for the higher levels of central metabolism intermediates under ethanol stress. The differences in central carbon metabolism intermediates and amino acids among three strains were similar between with 3% ethanol concentration and without ethanol (Figs. 3 and 4). However, in case of 7% ethanol stress, the significantly changed levels of central carbon metabolism intermediates (e.g., glucose-6-phosphate, pyruvic acid, and succinic acid) indicated that 7% ethanol imposed damage on primary metabolism of yeast cells. On the other hand, Piper (1995) reported that ethanol stress led to higher energy consumption. It was further supported by Koebmann et al. (2002) that the glycolytic flux in Escherichia coli was controlled by the demand for ATP. In this investigation, higher levels of glycolytic intermediates and citrate in diploid in exposure to ethanol stress indicated that the energy demand of diploid was lower than that of haploid under ethanol stress. Therefore, diploid yeast was more tolerant than haploid yeast under stress condition.
Furthermore, higher levels of total and individual amino acid in diploid yeast revealed that nitrogen metabolism was more active in diploid than in haploid (Fig. 4). Amino acids were essential parts of carbon and nitrogen metabolism, and precursors of a wide range of cell components including proteins, nucleotides, and other nitrogen-containing compounds. Analysis on amino acids provided information on metabolic coordination, as well as the relationship between carbon–nitrogen status and amino acid metabolism (Fritz et al., 2006). In diploid yeast, higher levels of valine and alanine, which were derived from pyruvic acid, could account for the better metabolic activity around the pyruvic acid branch point. Orlowski et al. (1969) reported that the detection of pyroglutamate was an indication for activation of glutathione metabolism. Higher level of pyroglutamate in diploid yeast demonstrated that the glutathione metabolism was more activated in response to ethanol stress in diploid than in haploid. Asparagine functioned in transport and storage of nitrogen in some species (Zulak et al., 2008). High levels of asparagine in haploid than diploid yeast in presence of 7% ethanol revealed that nitrogen transport and storage were more demanded in haploid for ethanol tolerance. Specifically, a-type haploid had the lowest metabolic ability, which was in agreement with their lowest growth and fermentation rate (Supplementary Fig. 1A and B). Furthermore, the increased pools of total amino acids and some individual amino acid including asparagine and threonine as the ethanol concentration increased in a-type haploid also illustrated that nitrogen metabolism of haploid was dramatically disordered by ethanol stress. These results further indicated that the diploid yeast displayed higher resistance to ethanol stress conditions.
Different ethanol stress tolerance between diploid and haploid
The different protective mechanisms of ethanol stress related metabolites were also investigated between diploid and haploid yeasts. Polyols (glycerol and sorbitol), amino acids (serine and proline), precursors of phospholipids (myo-inositol and ethanolamine), and unsaturated fatty acids (oleic acid and palmitoleic acid), which were highly dependent on the ethanol concentration in both diploid and haploid (Fig. 5), were considered to play key roles in the regulation of ethanol stress response. Sorbitol, glycerol, and myo-inositol were widely studied polyols, which were considered as compatible solutes in response to thermal, osmotic, and even vacuum stress (Ding et al., 2010). It was reported that accumulation of polyols facilitated osmotic adjustment and redox control. Moreover, sorbitol provided protection to cells under stress conditions, although smaller than that generated by an equal concentration of glycerol (Shen et al., 1999). McCue and Hanson (1990) found that polyols acted as ROS scavengers, thus contribute to protecting enzyme activities and membrane stabilization in plant cells. In our results, the increased levels of myo-inositol and sorbitol under ethanol stress in both diploid and haploid revealed that they all protected themselves from ethanol stress damage by increased levels of polyols. Myo-inositol also induced positive effects on yeast under concomitant thermal, ethanol and osmotic stress (Caridi, 2002; Furukawa et al., 2004). The dramatically increased level of myo-inositol in response to 7% ethanol stress in α-type haploid also suggested this haploid yeast was more susceptible to ethanol stress. Our research on ethanol stress response of diploid and haploid yeast by transcriptomics also gave the similar results that two myo-inositol synthesis related genes, INO1 and INM1, were dramatically induced by ethanol stress, especially in α-type haploid (Li et al., 2010a). It further suggested that diploid represented better ethanol stress tolerance than haploid.
It was known that the accumulation of glycerol inside the yeast cells via high osmolarity glycerol (HOG) pathway maintained osmotic homeostasis thus preserved many cellular processes under ethanol stress condition (Hohmann, 2002; Schüller et al., 1994). In the present study, intracellular glycerol was induced in diploid yeast but reduced in haploid yeast by ethanol, which revealed the different response of diploid and haploid to ethanol stress. The intracellular glycerol in haploid decreased under ethanol stress, whereas the excretion of glycerol increased. It indicated that the cell membrane was damaged more seriously and the membrane permeability increased in haploid yeast. Thus, the transport process of glycerol might be changed by ethanol stress, particularly in haploid yeast. Moreover, the glycerol production rate in haploid might be slower than its excretion rate under ethanol stress, which contributed to its reduced intracellular level under the stress condition. Furthermore, ethanol exposure had an effect on the level of NAD+, which could result in glycerol accumulation for NAD+ regeneration to maintain the redox balance (Vriesekoop et al., 2009). In this study, the accumulation of glycerol was an effective route for redox balancing in diploid yeast under ethanol stress condition. The diploid had the lowest intracellular glycerol in absence of ethanol, suggesting that haploid needed more NAD+ for normal metabolism. Moreover, significantly high level of intracellular glycerol in diploid yeast under 7% ethanol stress suggested that diploid could survive in high ethanol stress condition by producing more glycerol for NAD+ regeneration. However, the haploid represented low ability for resistance and even could not adapt to such severe stress.
Amino acids including glycine, serine, and threonine were reported to be induced by certain stresses (Brocekling et al., 2005). Proline was an important amino acid in yeast in terms of its biological functions in response to various stress conditions, such as freezing, oxidative, desiccation, or ethanol stress, most likely through enhanced membrane stability (Kaino and Takagi, 2008; Takagi et al., 2005). Judging from our results (Fig. 5), the induced level of proline caused by ethanol stress was for the protection of both diploid and haploid yeast cells from ethanol damage. Moreover, the fold change of proline was the highest in a-type haploid and the lowest in diploid under ethanol stress, which suggested that haploid was more susceptible to ethanol stress. The lower level of proline in haploid yeast than diploid yeast with same ethanol concentration was presumably due to the originally lower metabolism in haploid yeast regardless of ethanol stress.
It was widely accepted that yeast cells exhibited responses by adapting the membrane composition and function in presence of ethanol stress (Mannazzu et al., 2008; Vriesekoop et al., 2009). In this study, increased levels of unsaturated fatty acids (UFAs) and precursors of phospholipids (ethanolamine, myo-inositol, and serine) under ethanol stress (Fig. 5) indicated that the composition and fluidity of cell membrane was affected by ethanol stress. Moreover, different fold changes of these metabolites among three strains under ethanol stress indicated that diploid and haploid yeast represented significantly different stress tolerance to ethanol. Phospholipids and UFAs played important roles in membrane integrity and cell viability in yeast under unfavorable conditions, affecting the cellular functions, membrane stability and fluidity (Dinh et al., 2008; Xia and Yuan, 2009). Furthermore, the increases of serine and myo-inositol caused by ethanol stress were more significant in haploid than in diploid, which also illustrated that diploid strain was more tolerant to ethanol stress. You et al. (2003) reported that oleic acid was one of the most efficacious UFAs in overcoming toxic effects of ethanol in yeast cells through affecting the plasma membrane fluidity. In our work, the dramatically induced levels of oleic acid and palmitoleic acid in α-type haploid yeast might result in a compensatory decrease in membrane fluidity to counteract the fluidizing effects of ethanol. Furthermore, dramatically induced levels of UFAs triggered by 7% ethanol stress in α-type haploid suggested that the cell membrane of this strain was more vulnerable by stress conditions. On the other hand, increased levels of UFAs in haploid might be due to higher need in synthesis of lipid of membrane for better adaptation to the stressful condition. Thus, significant differences existed in responses to ethanol stress in cell membrane composition and function between diploid and haploid yeast.
Besides metabolomics, our group has extensively studied on the yeast stress response by transcriptomics (Li et al., 2010b), proteomics (Cheng et al., 2009a, 2009b; Lin et al., 2009), and lipidomics (Xia and Yuan, 2009) in previous works. So we used these “omics” to study the diploid and haploid yeast in response to ethanol stress. It was reported that the changes in the metabolome were expected to be amplified relative to changes in the transcriptome and the proteome (Urbanczyk-Wochniak et al., 2003). In this study, the diploid and haploid yeasts had substantial differences at metabolite level, and represented different metabolic response to ethanol stress. However, only a weak correlation between changes in metabolome and transcriptome or proteome was revealed, suggesting that there was a delay for expressing the changes in mRNA and protein at metabolite level.
Conclusions
Taken together, our results indicated that metabolomics was a good tool for analyzing the significant metabolic distinction between diploid and haploid yeasts in response to ethanol stress. This study permitted the identification of ploidy-specific and ethanol stress-specific metabolic changes in diploid and haploid. The diploid yeast possessed various metabolic characteristics that were different from haploid, including higher levels of most glycolytic intermediates and amino acids, as well as lower folds change of stress protectants in response to ethanol stress. Furthermore, diploid yeast was more tolerant to ethanol stress, whereas haploid was intrinsically more susceptible to stressful environment. The observed variations of intracellular metabolites led to a better understanding of different metabolic status of both diploid and haploid yeasts during fermentation condition or involving in ethanol stress response.
Footnotes
Acknowledgments
The authors are grateful for the financial support from the National Natural Science Foundation of China (Key Program Grant No.20736006), the National Basic Research Program of China (“973” Program:2007CB714301), international collaboration project of MOST (2006DFA62400), and Key Projects in the National Science & Technology Pillar Program (No. 2007BAD42B02).
Author Disclosure Statement
The authors declare that no conflicting financial interests exist.
References
Supplementary Material
Please find the following supplemental material available below.
For Open Access articles published under a Creative Commons License, all supplemental material carries the same license as the article it is associated with.
For non-Open Access articles published, all supplemental material carries a non-exclusive license, and permission requests for re-use of supplemental material or any part of supplemental material shall be sent directly to the copyright owner as specified in the copyright notice associated with the article.
