




Abstract
Abstract
We described an approach of identifying single nucleotide polymorphisms (SNPs) in complete genomic regions of key genes including promoters, exons, introns, and downstream sequences by combining long-range polymerase chain reaction (PCR) or NimbleGen sequence capture with next-generation sequencing. Using the adenomatous polyposis coli (APC) gene as an example, we identified 210 highly reliable SNPs by next-generation sequencing analysis program MAQ and Samtools, of which 69 were novel ones, in the 123-kb APC genomic region in 27 pair of colorectal cancers and normal adjacent tissues. We confirmed all of the eight randomly selected high-quality SNPs by allele-specific PCR, suggesting that our false discovery rate is negligible. We identified 11 SNPs in the exonic region, including one novel SNP that was not previously reported. Although 10 of them are synonymous, they were predicted to affect splicing by creating or removing exonic splicing enhancers or exonic splicing silencers. We also identified seven SNPs in the upstream region of the APC gene, three of which were only identified in the cancer tissues. Six of these upstream SNPs were predicted to affect transcription factor binding. We also observed that long-range PCR was better in capturing GC-rich regions than the NimbleGen sequence capture technique.
Introduction
With the advances in the next-generation sequencing technologies, cancer genome sequencing and resequencing have taken off. The sequencing and resequencing of the cancer genome have taken two directions: some applications have focused on the identification for mutations in the exons by genome wide amplification of exons followed by sequencing. Recently finished genome-wide exon sequencing included breast and colorectal cancer (Wood et al., 2007), pancreas cancer (Jones et al., 2008) and glioblastoma (Parsons et al., 2008). Another approach is to perform complete genome sequencing for the cancer genome. The first examples were done by Ley et al. (2008) and Mardis et al. (2009), who sequenced a primary, cytogenetically normal, de novo genome for acute myelogenous leukemia (AML) with minimal maturation (AML-M1) and a matched normal skin genomes using the Illumina's sequencing technology, and identified 12 acquired (somatic) mutations within the coding sequences of genes and 52 somatic point mutations in conserved or regulatory portions of the genome. Later, Shah et al. (2009) used the Illumina sequencing-based approach to sequence the genome of a primary tumor, as well as a metastasis collected from the same patient 9 years later, and they found that, of the 32 somatic alterations detected in metastasis, only 11 were detected in primary tumor. Recently, Clark et al. (2010) sequenced a grade IV glioma cell line U87MG and found that 512 genes were homozygously mutated, including 154 by single nucleotide variants (SNVs), 178 by small indels.
In contrast to the above approach, we tested an approach of targeted amplification or capture of complete genomic regions of genes including upstream, exonic, and intronic, as well as downstream sequences, followed by next-generation sequencing, for efficient identification of single nucleotide polymorphisms (SNPs) in a large number of samples. We used the APC gene, which is the most well-studied and thoroughly sequenced gene for its critical role in colorectal cancer formations (Fodde, 2002; Nagase and Nakamura, 1993; Nishisho et al., 1991; Smith et al., 1993; Wood et al., 2007), as an example. In the initial targeted sequencing for SNP screening, we pooled 27 colorectal cancer samples and 27 normal adjacent tissues. We identified a total of 210 SNPs in the colorectal cancers and normal adjacent tissues, of which 69 were novel ones. Eleven SNPs were identified in the exons of the APC gene and one of them is a novel SNP that had not been previously reported in the Ensembl SNP database. Eight of these SNPs are in the coding regions and seven of the them are synonymous SNPs. Interestingly, although these SNPs do not change the amino acids, they were predicted to affect splicing by either gain or loss of an exonic splicing enhancer or an exonic splicing silencer. Confirmational studies by allele-specific PCR approach of eight randomly selected SNPs suggested that the 210 SNPs that we identified have a negligible false discovery rate. As a byproduct of this study, we also compared the resequencing results from long-range PCR to that from NimbleGen sequence capture technology, and found that most variations indentified were common between these two methods. However, we observed that long-range PCR was better in capturing GC-rich regions than the NimbleGen sequence capture technique.
Materials and Methods
Clinical samples and genomic DNA isolation
Tissue samples were obtained from 6 control subjects (healthy individuals) and 37 colon cancer patients. All subjects are of Chinese origin. Samples were collected with an institutional review borad approval. DNAs were isolated using the DNeasy Blood & Tissue Kit (Qiagen Inc., Valencia, CA, USA) according to the manufacturer's protocol.
Long-range PCR
To amplify the genomic region of the APC gene, 14 pairs of specific primers were designed using the Primer 3 program (Rozen and Skaletsky, 2000) from the Human APC gene (Ensembl Gene ID ENSG00000134982) including 10 k upstream and 5 k downstream region. Primer sequences and their annealing temperature are shown in Supplementary Table 1. Amplifications of DNA were performed by PCR in a 25 μL volume containing 1 × Long-range PCR Buffer with 2.5 mM Mg2+, 500 μM of each Dntp, 0.4 μM of each primer and 1 unit of Long-range PCR Enzyme Mix (Qiagen Inc.). The PCR reaction was performed the following thermal cycling profile: an initial denaturation at 93°C for 3 min, 10 cycles of reactions with each cycle at [93°C for 15 s, the annealing temperature (the annealing temperature is listed in Supplementary Table 1 and varies for each primer pairs) for 30 s, and 68°C for 11 min], followed by another 28 cycles of reactions with each cycle at (93°C for 15 s, the annealing temperature for 30 s, and 68°C for 11 min with an extension of 20 s at each additional cycle), and a final extension at 68°C for 10 min. After amplification, PCR products were purified using the QIAquick PCR Purification Kit and the QIAquick Gel Extraction Kit (Qiagen Inc.) when the PCR products were run by electrophoresis and specific bands were cut out.
NimbleGen sequence captures
A custom tiling 385-k sequence capture array targeting the APC genomic sequence (Chr 5, coordinates 112091483–112214834 bp) was designed and manufactured by Roche NimbleGen. The 1:1 ratio of mixed genomic DNAs from 30 colon cancer patients were shipped to Roche NimbleGen (Madison, WI, USA). Briefly, the genomic DNA sample was fragmented, and then hybridized to the custom NimbleGen Sequence Capture array. Unbound fragments were removed, and the target-enriched DNAs was eluted and amplified as described (Albert et al., 2007; D'Ascenzo et al., 2009; Droege and Hill, 2008; Okou et al., 2007).
Sequence analyses by the next generation sequencing technologies
Amplified DNAs were sonicated for 10 min (130w, Cole-Parmer CPX 130, Vernon Hills, IL, USA) to generate DNA fragments of an average size of 500 bp. The DNAs were further purified and concentrated with Qiaquick PCR purification spin columns (Qiagen Inc.). Genomic fragments were end-repaired by a mixture of T4 DNA polymerase, Klenow DNA polymerase, and T4 PNK (Promega, Madison, WI, USA) and a 3′ overhang A was added using the Klenow exo- enzyme (Promega). The resultant fragments were ligated with the Illumina's classical adapters by DNA T4 ligase (Promega) according to the Illumina's protocol. Adapter-linked DNA fragments were separated by agarose gel electrophoresis and the band between 150–200 bp was excised from the gel. The DNA fragments were extracted from the agarose slices using the Qiaquick Gel Extraction Kit (Qiagen Inc.). Extracted DNAs were enriched by an 18-cycle amplification using Illumina's universal adapters. The DNA fragments were purified, quantified, and then sequenced for 36 cycles using the Illumina's protocol.
Short sequence read mapping and SNP calling
Short-sequence reads were extracted from the image files with the Illumina's Firecrest and Bustard programs and mapped to the Human APC reference genome sequence (ENSG00000134982, including 10 k upstream and 5 k downstream region) by BWA (version 0.5.3) with default parameters. BWA is an efficient program for aligning relatively short nucleotide sequences against a long reference sequence allowing mismatches and gaps, thus to find both SNPs and indels (Li and Durbin, 2009).
SNPs and indels were identified by samtools (version 0.1.6), which migrated and improved various downstream data processing implemented in Maq/Maqview, such as indexing, pileup, viewer, and consensus caller. Samtools generated the consensus sequence with the statistical model implemented in MAQ (Li et al., 2008, 2009). Potential PCR duplicates were first removed by command “samtools rmdupse.” Raw variations were called by command “samtools pileup” with default parameters, and then filtered by command “samtools.pl varFilter” with default options except following: minimum read depth (−d 5) to filter out low covered region, maximum read depth (−D 255) to filter out randomly placed repetitive hits. Those SNPs with SNP quality scores greater than 45 were considered as high-quality ones.
Detecting regions of no or low read coverage
Regions of no or low read coverage might be caused by either ineffective sequence capture or inaccuracy short reads mapping. GC content might affect Solexa base calling and PCR amplification, and low complexity regions might affect short reads mapping. GC content and read coverage were computed in a 100-bp window, and correlation coefficients (Spearman method) were computed using R (www.r-project.org). We computed the average coverage for both before and after removing PCR duplicates in a 100-bp window. Repeat and low complexity regions were found by cross_match program (Phrap package) with default parameters. Those low-complexity regions that were similar to others found in the human genome can cause ambiguity for mapping.
Prediction of functional consequences of SNPs
The final filtered SNPs were first compared to Ensembl variation database (version 55) to find novel ones using custom perl scripts. The online tool SNPnexus was then used for functional annotation for the SNPs. SNPnexus is a database providing a complete set of functional annotations of SNPs, including consequences to genes and regulatory elements (Chelala et al., 2009). The functional consequences of these SNPs on splicing were predicted by programs ESEfinder (Cartegni et al., 2003), or RESCUE-ESE (Fairbrother et al., 2002) for ESE prediction, and by the FAS-ESS program (Wang et al., 2004) for ESS prediction. The outcomes of the prediction was integrated using the online tool FASTSNP (Yuan et al., 2006), which was written as a central server to connect to various SNP function prediction programs.
We used PROMO, a program to detecting known transcription regulatory elements using species-tailored searches (Farre et al., 2003; Messeguer et al., 2002), to predict whether a SNP affects transcription factor (TF) binding. DNA sequences 10 nucleotides on either side of the SNP were used as inputs, and the TF species for human was selected and TF sites of all species were selected.
Confirmation of the APC SNPs
To confirm SNPs identified by the next-generation sequencing techniques, we performed allele-specific PCR (AS-PCR) (Wangkumhang et al., 2007; Ye et al., 2001) in a cohort of 24 pairs (48 samples) of individual colorectal cancer samples and 6 health volunteers. We employed the Tetra-primer amplification refractory mutation system (ARMS)-PCR, which is an efficient procedure for genotyping single nucleotide polymorphisms developed by Ye et al. (Wangkumhang et al., 2007; Ye et al., 2001). In brief, primers were designed using the online program for designing Tetra-primer ARMS-PCR primers (http://cedar.genetics.soton.ac.uk/public_html/primer1.html) (Ye et al., 2001). Each PCR reaction was carried out in a total volume of 10 μL, which contains 1 × TAKARA Ex Taq Buffer, 2.5 mM Mg2+, 250 μM of each dNTP, 0.2 μM of each primer, and 5 U/μL. TaKaRa Ex Taq. The results were then analyzed by 2% agarose gel electrophoresis.
Results
Identification of 210 highly confident SNPs in the APC gene
Using long-range PCR, we successfully amplified the complete APC genomic region (123 kb) including the 10-kb upstream and 5-kb downstream sequences using 14 10 kb-size PCR reactions from 27 pairs of colorectal cancer and adjacent tissue samples. The PCR primers used for the long-range PCR are shown in Supplementary Table 1. The coverage of the long-range PCR is 100% as we successfully amplified each region of the APC gene. The same amount of DNAs from 14 PCR products each from 27 colorectal samples (total of 378 PCR products) were pooled and subject to next-generation sequencing. The same procedure was carried out for the 27 adjacent colorectal samples. Amplification of individual sample before pooling, instead of pooling the samples and then performing PCR, ensured that the 27 pairs of individuals were equally represented in the final product for sequencing. This is important, as we found that different genomic preparations often have different efficiencies for PCR (data not shown), and therefore, mixing the samples before PCR may introduce bias in the final representation of samples.
In addition, we also used the NimbleGen sequence capture technology (Roche Diagnostics, Asia Pacific) to capture the same genomic region, as a test to see if it can replace the labor intensive long-range PCR. As the cost of doing NimbleGen's capture for each sample in very costly, we decided to pool the samples into the cancer sample pool and the normal adjacent sample pool, and then sent to NimbleGen for performing sequence capture. Regions in the APC gene that have repeats or low-complexity sequences were not targeted for capture in the NimbleGen sequence capture technology as no probes were designed in this region.
Short-sequence reads were first from aligned to the Human APC reference genome sequence (ENSG00000134982) including the 10-k upstream and 5-k downstream region by BWA (version 0.5.3) (Li and Durbin, 2009) with default parameters. BWA is an efficient program for aligning relatively short nucleotide sequences against a long reference sequence allowing mismatches and gaps, thus to find both SNPs and indels (Li and Durbin, 2009). Repeat sequences that matched to more than one locations were filtered out. SNPs and indels were identified by samtools (version 0.1.6) and MAQ (Li et al., 2008, 2009). After the analysis, the SNPs with SNP quality score greater than 45 were considered as high-quality ones.
In the end, we identified 210 SNPs in the APC gene, of which 69 were novel SNPs (Table 1 and Supplementary Table 2) that were not found in the SNP database. We also created a bedGraph format file for all the SNPs identified for easy upload to the UCSC genome browser for viewing the SNPs along with the genome annotations (Supplementary Table 3). Most of the SNPs were identified in the introns. Seven SNPs were identified in the upstream region. Eleven SNPs were located in exons (Table 2). Ten of them are synonymous SNPs and one is a nonsynonymous SNP. We also identified one novel SNP (at human genome HG19 position Chr5:112179745) that was not reported previously (Table 2). In addition, we observed that the SNP is not evenly distributed across the APC gene (Fig. 1). However, the functional consequences of this observation remain to be studied.
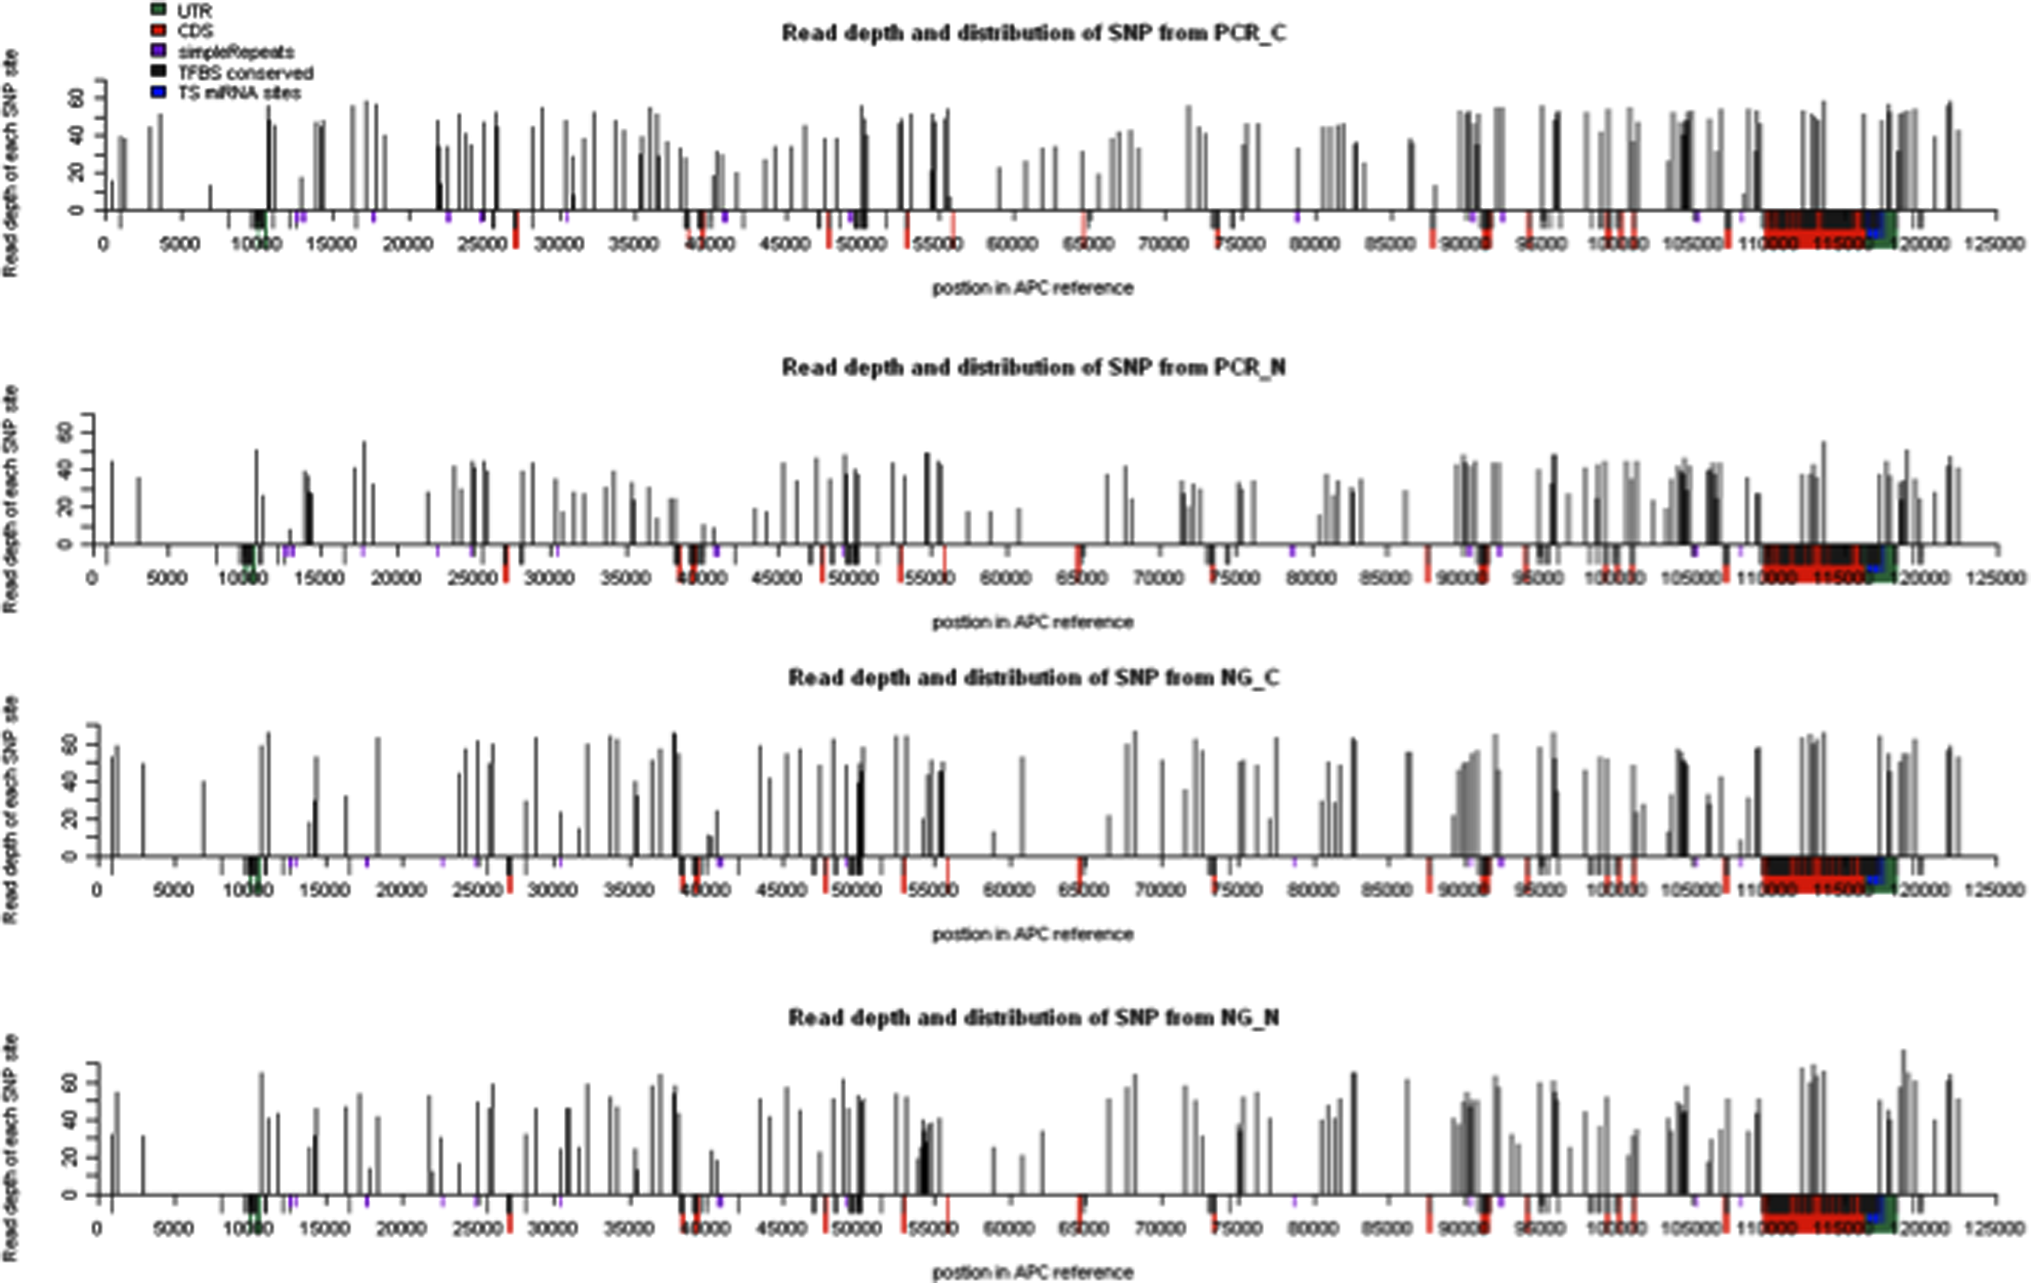
Read depth and distribution of each SNP of the APC gene in CRC. The height of each histogram represented read depth of corresponding SNPs, and the X-axis represents the position in APC reference (including 10 k upstream in the first and 5 k downstream in the end). The red regions were the CDS of the APC gene, and the green were UTR. The conserved transcription factor binding sites and miRNA target sites were labeled as black and blue.
SNPs, single nucleotide polymorphisms.
SNP, single nucleotide polymorphism; ESE, exonic splicing enhancer; ESS, exonic splicing suppressor.
Predicted functional consequences of the SNPs identified
As our approach not only identified SNPs in the coding exons, but also identified SNPs in the upstream sequences, introns, and down stream sequences, a more comprehensive analysis of the function of the SNPs identified, rather than simply annotating them with synonymous or nonsynonymous coding SNP, is needed. Human genes are regulated by diverse cis-acting elements to make the correctly spliced mRNAs at the right place and at the right time. SNPs affecting these regulatory elements of splicing will affect gene splicing, which was shown to contribute greatly to many human disease including cancers (Cartegni et al., 2002; Wang and Cooper, 2007). These regulatory elements include the intronic and exonic splicing enhancer (ISE and ESE) (Cartegni et al., 2003) and suppressor (ESS and ISS) elements (Wang et al., 2004). ESEs are cis-regulatory elements that direct or facilitate accurate splicing of precursor RNAs (Cartegni et al., 2003) and ESSs are cis-regulatory elements that inhibit the use of adjacent splice sites (Wang et al., 2004). ESEs can bind SR proteins and recruit and stabilize proteins necessary to splicing in the spliceosome while ESSs can bind protein components of heterogeneous nuclear ribonucleoproteins (hnRNP) to repress exon usage (Wang and Cooper, 2007).
Using the online tool FASTSNP (Yuan et al., 2006) to predict ESE or ESS gain or loss, we found that seven of the eight synonymous SNPs in the coding region affected splicing by either an ESE or an ESS gain or loss (Table 2). Two of the three SNPs in the 3′ UTR region also resulted in an ESE/ESS gain or loss (Table 2). The one nonsynonymous SNP also resulted an ESE gain (Table 2). It should be pointed out that this nonsynonymous SNP was predicted by PolyPhen, which predicts possible impact of an amino acid substitution on the structure and function of a human protein (http://genetics.bwh.harvard.edu/pph/) (Ramensky et al., 2002), to only have benign effect on protein function (the PSIC score difference was 0.532). However, it resulted in a gain of an exonic splicing enhancer.
We also identified seven SNPs in the upstream sequence (putative promoter regions) of the APC gene (Supplementary Table 2). We used PROMO, a program for detecting known transcription regulatory elements using species-tailored searches (Farre et al., 2003; Messeguer et al., 2002), to predict whether these SNPs affect transcription factor binding. We found that SNP at position chr 5: 112070456 (G->A) (all positions refer to the human genome HG19 position) would predict to have losses of two transcription factor bindings—c-Ets-1 [T00112] and R2 [T00712] (Table 3). The SNP at position chr 5: 112067142 (C->T) would result in a gain of YY1 binding, and a gain of additional binding sites to ENKTF-1 (from one site to two sites). The SNP at position chr 5: 112066524 (G->C) would result in gains of four TF binding sites for p300 [T01427], R2 [T00712], NFI/CTF [T00094], and Elk-1 [T00250]. The SNP at position chr 5: 112064826 (G->C) would result in the loss of binding to CUTL1 [T00100] and SRY [T00997]. The SNP at position chr 5: 112064475 (A->T) would result in the loss of PR B [T00696] and PR A [T01661] binding, but a gain of c-Myb [T00137] binding. The SNP at position chr 5: 112063970 (G->C) would result in gains of binding to WT1 I -KTS [T00900], WT1 -KTS [T01839], and ETF [T00270] (Table 3).
Our approaches identified a large number of SNPs in the introns of the APC gene. Recent genomic data showed that introns contain functional important regions such as the conserved intronic splicing regulatory elements (ISREs) that are important for gene regulation and splicing (Yeo et al., 2007). These ISREs include ISEs and ISSs. ISEs can enhance exon definition and activate weak exons, whereas ISSs can inhibit exon definition by recruiting splicing repressors and created a zone of silencing (Chou et al., 2000; Singh et al., 1995; Valcarcel et al., 1993). We found that many of the SNPs that we identified were located on the evolutionary conserved intronic regions using the UCSC genome browser view (data not shown). However, as there is no reliable prediction program for detecting the effect of SNPs in the ISRE regions, the functional consequences of these SNPs remain to be determined.
Confirmation of SNPs by allele-specific PCR (AS-PCR)
To confirm the SNPs that we identified by our approach are genuine SNPs, we performed AS-PCR for randomly selected SNPs. We used the tetra-primer allele specific PCR method, which is a simple and economical method for SNP genotyping and confirmation (Ye et al., 1992, 2001). To increase discriminating power of AS-PCR, we introduced an additional mismatch at position −2 from the 3′-terminus, an approach that was shown to increase the specificity of classical allele-specific PCR (Ye et al., 1992, 2001).
We randomly chose 10 SNPs with various SNP quality scores for confirmation by AS-PCR (Table 4): 8 SNPs had SNP quality scores >45, and 2 had SNP quality scores <45. We performed AS-PCR on DNAs from 24 pair of cancer and adjacent benign tissues (a total of 48 cancer samples) and 6 healthy individual controls. All of the eight SNPs with high SNP quality were successively confirmed including the one novel SNP, which was confirmed in both in the cancer and the normal adjacent tissues (Table 4). However, for the two SNPs with quality score less than 45; one was confirmed and another one was not (Table 4). Figure 2 shows the AS-PCR result for the confirmation of the SNP at position chr5: 112074356 (C > T). The result showed that the T allele at this position is the common allele in the Chinese populations. As we used the score of ≥45 as the cutoff score for our identified SNPs, and the eight SNPs with scores ≥45 were all confirmed, the false positive rate of the 210 SNPs that we identified is therefore negligible. The stringent score we used for selecting SNPs ensured the quality of the SNPs identified. However, we might miss some potential SNPs using such a stringent score.

Validation of SNP at position chr5: 112074356 (C > T) by AS-PCR. The PCR products for the T allele appeared in 16 samples, wherease the C allele only appeared in 8 samples, suggesting that 8 samples were heterozygous C/T and 8 samples were homozygous for the T allele.
SNP, single nucleotide polymorphism.
Comparing target selection by long-range PCR and sequencing capture technology for next-generation sequencing
We investigated the distributions of SNPs identified in cancer and normal adjacent tissues using the two methods. We found that about half of the SNPs (52%, 109 of 210 SNPs) were identified to be common among the four comparisons: PCR-C (DNAs amplified by PCR from cancer samples), PCR-N (DNAs amplified by PCR from normal adjacent samples), NG-C (DNAs captured by the Nimblegen's technology from cancer samples), and NG-N (DNAs captured by the Nimblegen's technology from normal adjacent samples) (Fig. 3).

Comparison of SNPs identified from CRC cancer and cancer adjacent tissues using either long-range PCR or the NimbleGen sequence capture technology. PCR-C: SNPs identified in the PCR amplified CRC samples; PCR-N: SNPs identified in the PCR amplified normal adjacent samples; NG-C, SNPs identified in the NimbleGen captured CRC samples; NG-N: SNPs identified in the NimbleGen Captured normal adjacent samples.
Comparing the SNPs between cancer and normal adjacent samples, we identified a total of 37 SNPs (22 from PCR-C, and 11 from NG-C) that were only identified in the cancer samples (Supplementary Table 2). Four of these SNPs have predicted functional consequences. The one coding SNP at position 112179745 (C to A) would result in an ESE loss. The other three SNPs were located in upstream sequences of the APC gene and would have predicted gain or loss of TF bindings (Table 5). For example, SNP 112070456 (G to A) would result in the loss of c-Ets-1 [T00112] and R2 [T00712] binding. However, most of the cancer specific SNPs that we identified are in the introns; whether and how these SNPs are related to colorectal cancer remains to be investigated.
We plot the sequence coverage across the APC gene using only the uniquely mapped sequence tags, and we found that the coverage is on average about the same (Fig. 4). However, we did notice that for the GC rich region, the PCR approach seemed to perform better than the NimbleGen's target capture approach. For the GC region marked by an arrow in Figure 4, the PCR approach (the PCR-C panel) has much higher coverage than the NimbleGen's capture approach (the NG-C panel). Please note the most of the low coverage regions in our analysis was due to filtering out the tags that are either repeats or are low complex sequences (marked by blue boxes in Fig. 4).
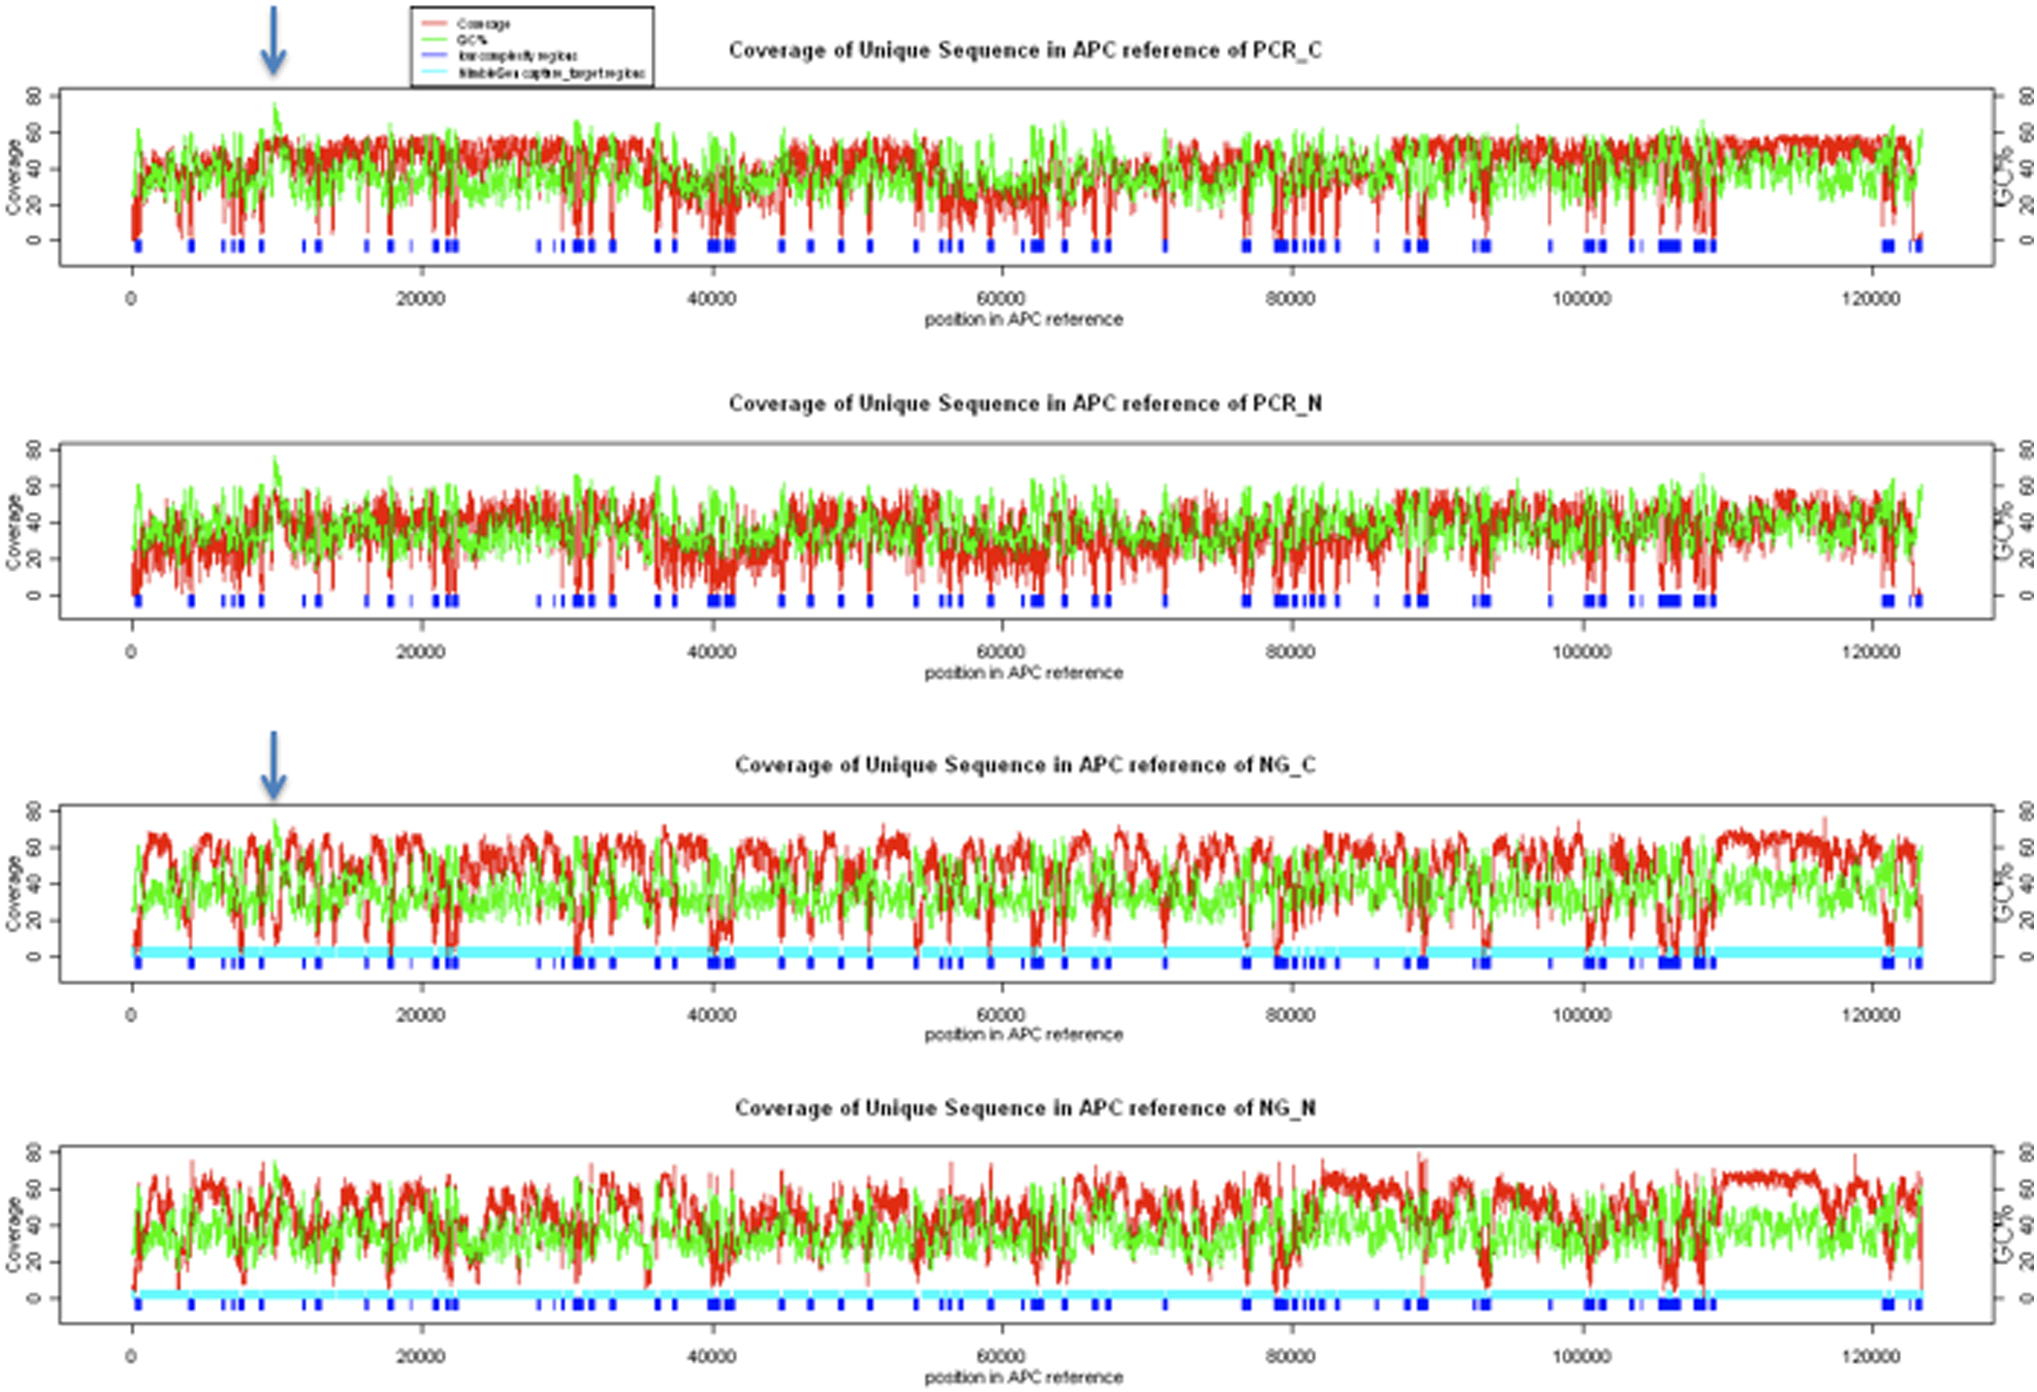
Plots of sequence coverage of the APC gene by the next-generation sequencing. The red lines show the sequence read depth of the corresponding bases, and the green lines show the GC content of a 100-bp window. The blue blocks were the low-complexity regions that are defined by the cross_match algorithms. PCR_C: long-range PCR of cancer tissues; PCR_N: long-range PCR of normal adjacent tissues; NG_C: NimbleGen sequence capture of DNAs from cancer tissues; PCR_N: NimbleGen sequence capture of DNAs from normal adjacent tissue.
Discussion
In this report, we tested a targeted genomic amplification and capture approach for sequencing a predetermined genomic region in a large number of samples using the next-generation sequencing technology for SNP discoveries. Our approach and analysis pipeline is summarized as follows: we first amplified by long-range genomic PCR or captured by NimbleGen's sequence capture technology a predetermined region followed by next-generation sequencing to identify SNPs using pooled samples. Data were then analyzed by BWA (Li and Durbinm, 2009) followed by samtools (Li et al., 2009). SNPs identified were confirmed using AS-PCR (Wangkumhang et al., 2007; Ye et al., 2001) in a large cohort of individual samples. Finally, annotations and functional consequences of SNPs were performed using bioinformatics tools SNPnexus and FastSNP (Chelala et al., 2009) (Yuan et al., 2006).
Using the APC gene as an example, we sequenced the whole genomic region of the APC gene (123 kb) in 27 pair of cancer and normal adjacent tissues of Chinese sporadic colorectal cancer patients, including its 10-kb upstream and 5-kb downstream regions. We identified 210 SNPs in total (Supplementary Table 2 and Table 1), of which 69 are novel SNPs that have not been reported in the Ensembl Database (release 55), which contains a total of 628 SNPs identified for the APC gene. Our analysis suggests that targeted capture or amplification of a predetermined genomic regions followed by the next-generation sequencing is an effective way of identify SNPs in a large number of patients without going for complete sequencing of the whole genome. This approach will be effective in quickly assessing the spectrum of the SNPs in important genes or genomic regions affecting cancers such as the APC gene that we used as an example for the colorectal cancer. Our approach not only identifies SNPs in exons, but also SNPs in introns and up- and downstream regions, which have been recognized more and more as playing important roles in gene regulation and human diseases (Jaillon et al., 2008). Our approach was tested when the bar-coding technology for next-generation technology was still immature. Recent advances in labeling multiple samples with bar-coding adapters prior to the next-generation sequencing (Cronn et al., 2008) may offer a more effective approach by eliminating the sample pooling step.
The adenomatous polyposis coli (APC) gene is mutated in familial adenomatous polyposis (FAP) patients and in most sporadic colorectal tumors. In the mutation database mutDB (http://mutdb.org/cgi-bin/mutdb.pl?id=APC&geneid=324), there are 47 nsSNPs (nonsynonymous SNPs) and 11 synonymous SNPs for the APC gene identified to be associated with FAP, colorectal cancer, or gastric cancer. In particular, mutations V890I, S906Y, E911G, Y1027C, T1313A, and A1508V were identified in colorectal carcinoma (Miyaki et al., 1997) (http://mutdb.org/cgi-bin/mutdb.pl?id=APC&geneid=324). In this study, we have identified one novel SNP (Table 2), expanding the number of mutations that are associated with colorectal cancers. Some of the 69 novel SNPs (Supplementary Table 2) that we identified might be unique to the Chinese population, similar to the observation that the mutation patterns of the APC gene in FAP patients in different populations are different (Attard et al., 2007). Comparison between Caucasian and Chinese using a large cohort of individuals is needed to answer this question.
The APC gene (ENSG00000134982) contains 16 exons and encodes a protein of 2,843 amino acid residues. The APC protein contains several domains: an oligomerization domain and Armadillo repeats in the N-terminal portion; several binding sites for β-catenin and the mammalian homologue of discs large (DLG) protein in the C-terminal portion; 3 15-amino acid repeats and 7 20-amino acid repeats in the middle portion (Fodde, 2002; Senda et al., 2007; Smith et al., 1993). APC down egulates the Wnt signaling pathway through its binding to β-catenin and Axin (Smith et al., 1993). Inactivation of APC in cancer is often due to truncations resulting from mutations (Senda et al., 2007). Loss of the APC function results in failure in inhibiting the Wnt signaling pathway, leading to proliferation of cancer cells (Aoki and Taketo, 2007; Nishisho et al., 1991). APC also binds other proteins such as the APC-stimulated guanine nucleotide exchange factor, the kinesin superfamily associated protein 3, IQGAP1, microtubules, EB1, and DLG (Aoki and Taketo, 2007).
It was generally assumed that the pathogenicity of exonic mutations result from predicted effects on the reading frame and protein function. Traditionally, synonymous mutations or benign nonsynonymous mutation were assumed not to cause much changes in function of the coded protein. However, the recent discovery that mutations creating or abolishing splicing enhancers and silencers can cause human diseases (Cartegni et al., 2002; Pagani and Baralle, 2004) changed our view. Accumulated evidence suggests that many cancer-associated alternative-splicing events occur in the absence of mutations in the affected genes and they correlate with cancer development, progression, and response to therapy (Grosso et al., 2008). About 50–60% of the mutations that cause diseases are found to affect splicing (Cartegni et al., 2002; Lopez-Bigas et al., 2005). For example, Pagani et al. (2005) recently showed that showed that about one-quarter of even synonymous substitutions resulted in altered splicing in their extensive and systematic mutation analysis of exons 9 and 12 of the CFTR gene, whose mutation causes cystic fibrosis.
Alternative splicing provides a versatile means of genetic regulation in metazoans. A single gene can generate multiple transcripts by alternative splicing, thereby expanding the transcriptome and proteome diversity. Removing of introns from pre-mRNAs involves an assembly of snRNPs and extrinsic, non-snRNP, protein-splicing factors, and pre-mRNAs to form the spliceosome. Many specific sequences located at and near the 5' and 3' splice sites, and in intronic regions can modulate the association of the spliceosome with the pre-mRNA, and affect alternative splicing. Six of the seven synonymous mutations and the one nonsynonymous mutation that we identified in the APC gene were predicted to result in a change of ESE or ESS (Table 2). Mutations of ESE could reduce inclusion of the corresponding exon into the mature mRNA but mutations of an ESS increases inclusion of the exon. The mutations in ESE or ESS could affect the specific binding of regulatory proteins such as SR proteins (serine/arginine-rich proteins) or heterogeneous nuclear (hn)RNPs (Graveley, 2000). Some silencers, instead of binding regulatory proteins, can form a particular pre-mRNA secondary structure that hinders the recognition of a neighboring splicing enhancer by SR proteins (Buratti et al., 2004). The exact mechanism of ESE/ESS gain or loss in the APC mutations that we identified remains to be investigated. The mechanism could be an inclusion or exclusion of exons coding for key APC functional domains, or a change that affects the proportions of different mRNA splicing isoforms and so on.
We also identified SNPs in the upstream regions that were predicted to affect transcription factor binding sites in the APC gene (Table 3), which may in turn, affect expression of the APC gene. Three of these SNPs were only identified in the cancer samples (Table 5). For example, Chr5:112063970 SNP G->C would result in the gain of binding to two isoforms of the Wilms' tumor WT1 protein [WT1 I-KTS, alternative splice variant of WT1 lacking 17 AA (250–266 SF of WT1 + KTS) and 408–410 (K-T-S) and WT1 − KTS, alternative splice variant of WT1 lacking AA 408–410 (K-T-S) of full-length WT1] and a gain of ETF transcription factor. The Wilms' Tumor 1-KTS Isoform (WT1–KTS) can induce p53-independent apoptosis (Menke et al., 1997). ETF specifically stimulates transcription from promoters without a TATA box (Kageyama et al., 1989). Chr5:112070456 SNP A->G would result in a loss of c-Ets-1 [T00112] binding. C-Ets-1 is a proto-oncogene that controls the expression of many genes including a number of genes involved in extracellular matrix remodeling (Reddy and Rao, 1988; Takai et al., 2000).
We compared the long-range PCR approach and the NimbleGen's target capture approach for obtaining specific genomic regions for the next-generation sequencing. We noticed that for the GC rich region, the PCR approach seemed to perform better than the NimbleGen's target capture approach.
Conclusions
We demonstrated an efficient approach for SNP discovery in targeted genomics regions in a large number of samples combining long-range PCR or NimbleGen sequence capture and the next-generation sequencing technologies. Using one of the most sequenced genes in the human genome—the APC gene, we showed that this approach is effective by the identification 69 novel SNPs among 210 SNPs that we identified in the colorectal cancers and normal adjacent tissues of Chinese patients.
Footnotes
Acknowledgments
This work was supported by grants 2006AA02A303, 2006AA02Z4A2, 2006DFA32950, and 2007DFC30360 from the MOST, China, and a grant Y200803669 (J. Wang) from the Department of Education, Zhejiang Provincial Government, China.
Author Disclosure Statement
The authors declare that no conflicting financial interests exist.
The first three authors contributed equally to this work.
References
Supplementary Material
Please find the following supplemental material available below.
For Open Access articles published under a Creative Commons License, all supplemental material carries the same license as the article it is associated with.
For non-Open Access articles published, all supplemental material carries a non-exclusive license, and permission requests for re-use of supplemental material or any part of supplemental material shall be sent directly to the copyright owner as specified in the copyright notice associated with the article.
