




Abstract
Abstract
Many association studies analyze the genotype frequencies of case and control data to predict susceptibility to diseases and cancers. Without providing the raw data for genotypes, many association studies cannot be interpreted fully. Often, the interactions of the single nucleotide polymorphisms (SNPs) are not addressed and this limits the potential of such studies. To solve these problems, we propose a novel computational method with source codes to generate a stimulated genotype dataset based on published SNP genotype frequencies. In this study we evaluate the combined effect of 26 SNP combinations related to eight published growth factor-related genes involved in carcinogenesis pathways of breast cancer. The genetic algorithm (GA) was chosen to provide simultaneous analysis of multiple independent SNPs. The GA can perform feature selection from different SNP combinations via their corresponding genotype (called the SNP barcode), and the approach is able to provide a specific SNP barcode with an optimized fitness value effectively. The best SNP barcode with the maximal occurrence difference between groups for the control and breast cancer, together with an odds ratio analysis, is used to evaluate breast cancer susceptibility. When they are compared to their corresponding non-SNP barcodes, the estimated odds ratios for breast cancer are less than 1 (about 0.85 and 0.87; confidence interval: 0.7473∼0.9585, p < 0.01) for specific SNP barcodes with two to five SNPs. Therefore, we were able to identify potential combined growth factor-related genes together with their SNP barcodes that were protective against breast cancer by in silico analysis.
Introduction
Recently, the relationship between IGF-1 and IGFBP-3 single nucleotide polymorphisms (SNPs) and breast cancer risk has been addressed (Al-Zahrani et al., 2006; Patel et al., 2008). In total, 26 SNPs from eight growth factors-related genes, namely, EGF, IGF1, IGF1R, IGF2, IGFBP3, IL10, TGFB1, and VEGF, were selected to investigate their association with breast cancer (Pharoah et al., 2007). Although the individual role of these growth factor-related genes was addressed in the study, the combined effect of gene (or SNP) interactions in relation to breast cancer was ignored. Furthermore, this study is similar to many association studies in that they only published genotype frequencies without the supplementary genotypic raw data. Accordingly, an evaluation of SNP–SNP interactions based on published data remains challenging. To solve this problem, we proposed a novel method to provide a genotype simulation derived from published genotype frequency data that mimics the original genotype data and allows further analysis using datasets from the literature such as (Pharoah et al., 2007).
For SNP–SNP interactions, different numbers of SNPs are randomly select (or interact) and they are combined with one of the various genotypes. Theoretically, this will generate many different “SNP barcodes” patterns, which is combinations of the SNPs with their corresponding genotypes. Because the genetic algorithm (GA) (Holland, 1992) has been successfully optimized in spite of many problems (Dias Alexandre and de Vasconcelos, 2002; Oh et al., 2004; Tsai et al., 2002), it allows a randomized search and optimization technique that is derived from the working principles of natural genetics. This simplifies the potential optimization problems associated with SNP–SNP interactions. Therefore, the GA was used to generate the SNP “barcodes” of genotypes across many genes in order to group the patients into cases (breast cancer) and controls. Among this output, the “best” SNP barcodes, with a maximum difference between controls and cases, are also provided by the GA and their possible risk in terms of breast cancer was analyzed by odds ratio analysis. Therefore, the crosstalk between and joint role of the combinational genotypes of the 26 SNPs for growth factor-related genes were analyzed in relation susceptibility to breast cancer using GA-based and odds ratio-based methods and simulated genotype frequency data.
Materials and Methods
Example data
The datasets were obtained from the growth factors pathway (43 SNPs for 8 genes) in a breast cancer association study (Pharoah et al., 2007) including SNP and clinical status for up to 4,400 breast cancer cases and 4,400 controls. Except for the EGF and TGFB1 genes, which contain only one SNP in literature (Pharoah et al., 2007), the other genes (IGF1, IGF1R, IGF2, IGFBP3, IL10, and VEGF) were chosen with the same numbers of SNPs at random, namely, 4, and 26 SNPs were included in this study (Table 1). EGF, IGF1, IGF1R, IGF2, IGFBP3, IL10, TGFB1, and VEGF genes are located in the chromosomes 4q25, 12q23.2, 15q26.3, 11p15.5, 7p13–p12, 1q31–q32, 19q13.1, and 6p12, respectively. The possible relationships between these 26 SNPs within the 8 genes have not been addressed previously. In this article, we focus on the selection of the best combination of SNPs with genotypes (SNP barcodes) that gives a maximal difference between controls and cases using GA.
Data collected from literature (Pharoah et al., 2007).
Data highlighted with bold text are the statistically significant results.
All the [Ch/position], that is, [Chromosome no./Chromosome position], information is based on the “Assembly GRCh37.”
The contig information is shown in SNP no. (contig accession no.) as follows: SNP 1 (NT_016354.19); SNPs 2-5 (NT_029419.12); SNPs 6, 8, 9 (NT_010274.17); SNPs 10, 11 (NT_009237.18); SNPs 14-17 (NT_007819.17); SNPs 18-21 (NT_167186.1); SNP 22 (NT_011109.16); SNPs 23-26 (NT_007592.15). For SNPs 7, 12, and 13, their rs numbers are unavailable [?] in the original source (Pharoah et al., 2007).
SNP, single nucleotide polymorphisms; CI confidence interval.
Genotype simulation from genotype frequency in order to mimic the original genotype data
In this study, the chosen dataset (Pharoah et al., 2007) provided only the genotype frequencies rather than the original raw data for the genotypes. The original data for each SNP involves different numbers of individuals and therefore the simulated population for each SNP needs to be adjusted by normalization to fit the same population size; this would allow further analysis. The simulated data are inputted by generating the new data at random but such that the output still obeys the final frequency for each SNP for the whole dataset. Based on the genotype frequency of the complete dataset (with the highest numbers of cases and controls), the simulated dataset are inputted. For example, we assume that SNP1 is regarded as the complete dataset after normalization, while the SNP2 contains the original data before normalization. If the sums for the values of three genotypes (AA, Aa, and aa) in SNP1 and SNP2 are 4555 and 2277, respectively, then the difference of genotype numbers for three genotypes between SNP1 and SNP2 are compensated by the property of the mode to normalization. First, the percentage for each genotype in SNP2 is calculated as shown in “original data*/sum (%),” that is, 1,945/2,277 (85%) for AA, 310/2,277 (14%) for Aa, and 22/2,277 (1%) for aa, where the symbol * indicates that original data is derived from SNP dataset before normalization. According to this percentage, the modified data for SNP2 is calculated by multiplying the percentage with the sum of the complete dataset (4,555 for SNP1), that is, 85% × 4,555 ( = 3,871) for AA, 14% × 4,555 ( = 638) for Aa, and 1% × 4,555 ( = 46) for aa. Therefore, the modified data for SNP2 has been adjusted to the same sum (3,871 + 638 + 46 = 4,555) as in SNP1.
Finally, all the SNP data from the data source (Pharoah et al., 2007) was adjusted to the same sum number, namely, 5,000, for all genotype distributions; this was randomly generated as described in the following pseudocode. The simulated genotype data with 26 SNPs for case and control groups are presented in Supplementary File 1. The source code for this GA program is implemented in Java and is freely available from the Supplementary File 2. The simulated genotype distributions among case and control groups are shown in Table 1.
Pseudocode for a Randomly List Procedure
GA-based SNP barcode generation
GA has been successfully applied to a variety of problems, such as biomarker discovery and multiclass cancer classification (Liu et al., 2005), primer design (Png et al., 2006), gene selection based on gene expression data (Li et al., 2001), and others (Deb et al., 2002; Hou et al., 1994; Kim and Zhang, 2001; Pullan, 2003; Vafaie and De Jong, 1992). In this study, we apply the GA method to an evaluation of breast cancer susceptibility by stimulation. The standard GA procedure applies the following genetic operators: chromosome encoding and initialization, selection, crossover, mutation, and replacement; this is done in order to compute a whole generation of new offspring. By applying genetic operators on strings in the mating pool, a new population of strings is formed to give the next generation. The implementation of the genetic operators is repeated in each subsequent generation until a termination condition is reached. Accordingly, GA weakens quickly and optimal solutions are obtained effectively out of a wide solution space. The components of GA are as follows.
Chromosome encoding and initialization
In the GA, each chromosome in a population is coupled with a solution group. Representation of a chromosome (C) is composed of two parts: the number of selected SNPs and the corresponding genotype for the selected SNP. It is represented as follows:
where m and n indicate the population size and the number of selected SNPs, respectively. A gene thus described represents the selection of the jth SNP on the ith chromosome, S
ij
represents the 26 SNPs that can be selected, G
ij
represents the three different possible genotype states once S
ij
is selected. Because the SNP code is not repeatedly selected, the S
ij
selection process is not repeatable. However, genotype selection does not have any limitations on how often it can be repeated. Thus, no restrictions are imposed on the genotype (G
ij
) selection. The size of the whole “chromosome in GA” will be changed according to the number of SNPs selected. In this study, the initial population is randomly generated. A chromosome containing 26 SNPs undergoes random selection from the 26 SNPs and the corresponding three genotypes for each SNP as follows:
In this representation of the chromosome, the first three numbers represent the chosen SNPs {1, 10, 17} and the following three numbers represent the chosen genotypes {3, 2, 1}. Chosen SNPs along with one of their corresponding genotypes were randomly produced. In the example above, {1, 3} represents SNP1 with the third genotype, and {10, 2} represents SNP10 with the second genotype, etc. In brief, X_{h,k} = “SNP h shows the k-th genotype” and employing a chromosome of the form C = {X_{1,3}, X_{10,2}, X_{17,1}}.
Fitness function
An important consideration in this representation is the choice of fitness function. The fitness value for the generated SNP barcodes (best combination of SNPs with genotypes) is required to be computed from all selected SNPs. Chromosomes of different sizes are excluded during computation of the evolution process. To obtain the highest fitness value, the number of SNPs is set first in order to concentrate on special SNP combinations.
To determine the maximum fitness value, we divided the fitness calculation into two separate steps. First, the total number of SNP barcode combinations in the control dataset is calculated. Second, the total number of SNP barcode combinations in the case dataset is calculated. Subsequently, Eq. (1) is used to determine the fitness value of each chromosome. SNP barcodes with a high fitness value represents that the SNP selection and genotype combinations within the SNP barcodes that have a high risk of breast cancer.
where N is the total number of combinations, ALL_Brca_control the total number of SNP barcode combinations in the control group, ALL_Brca_case the total number of SNP barcode combinations in the case (breast cancer; Brca) group.
In the example Ci = {10, 17, 2, 1}, we computed the number that matches the condition of the SNPs and genotypes for the control and case data according to the stimulated data described in Materials and Methods section. First, we calculated the control number for SNP10 with genotype 2 (i.e., {10, 2}) and SNP17 with genotype 1 (i.e., {17, 1}). In the stimulated data (the Supplementary File 1), the numbers of controls independently matching the {10, 2} and {17, 1} are 2,183 and 3,027, respectively. The number for control individuals that have {10, 2} and {17, 1} are 1,309. Second, we calculated the case numbers for {10, 2} and {17, 1}. The numbers of cases independently matching for {10, 2} and {17, 1} are 2,074 and 2,908, respectively. The number for case individuals that have {10, 2} and {17, 1} are 1179. According to Eq. (1), the fitness f(Ci) of {10, 17, 2, 1} is determined by subtracting 1,179 from 1,309, giving 130.
Selection
In the GA, the viable selection operations for individuals include tournament selection and roulette wheel selection. Our design adopts the rank-based tournament selection scheme. In tournament selection, the chromosomes in the population are ranked and the best two chromosomes (P1 and P2) from population selected to perform the crossover and mutation operation. This continues until a certain set number of chromosomes had been selected.
Crossover and mutation
Tournament selection was used to choose the two parents P1 and P2. Because the chromosomes are divided into two parts (SNP and genotype), the value range produced by each part is different. Accordingly, four crossover points had to be selected during each crossover based on a randomly generated disorder number in order to apply the two-point crossover method to our chromosome. Two crossover points were used for the SNP crossover with a selection range of [1, n], and two points were used for the genotype crossover with a selection range of [n + 1, 2n]. Part of the crossover points within the two groups was selected to proceed with the crossover, in order to produce two new offspring.
How the crossover step proceeds in one generation of the GA is explained below. In Figure 1, P1: {1, 10, 17, 3, 2, 1} and P2: {2, 6, 19, 1, 3, 2} are chosen from the population and regarded as the two parents. In Figure 1, first and second are the crossover points for the first part (i.e., the SNP part), and first, third are crossover points for the second part (i.e., the genotype). The crossover process changes the information on the two chromosomes and produced two offspring, S1 and S2, as shown in Figure 2.
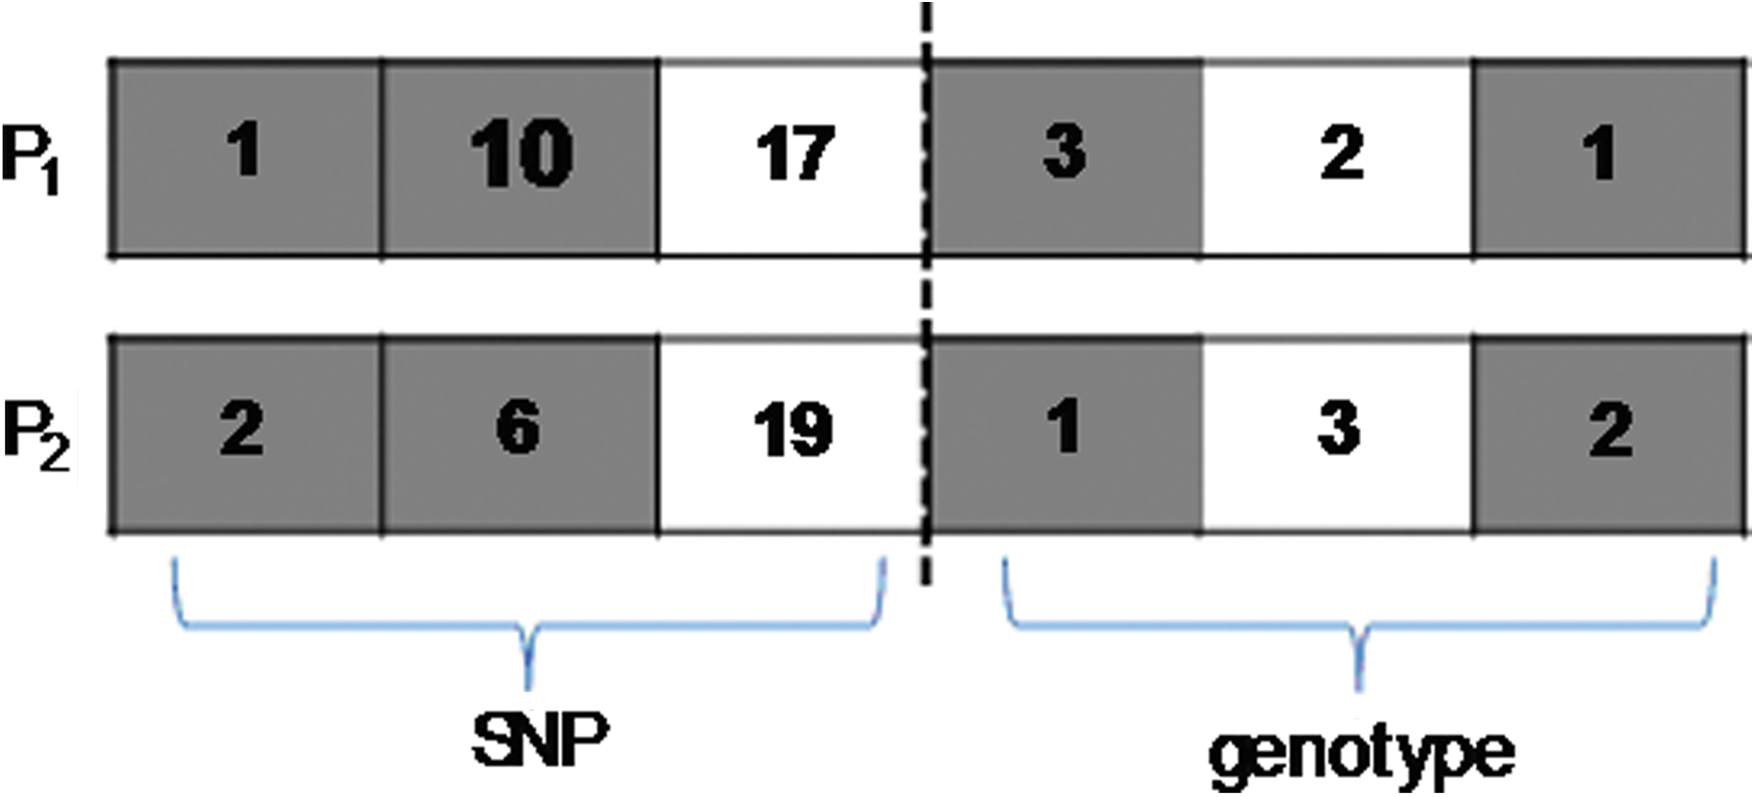
The left block before the dashed line represents that the points 3 and 4 are randomly generated to choose ranges of noncrossover between two points, and then the first and second [ranges of P1 crossover: {1, 10}; ranges of P2 crossover: {2, 6}) in P1 and P2 will be implemented the crossover operation for the first part (i.e., the SNP part). The right block after the dashed line represents that the points 2 and 3 are randomly generated to choose ranges of noncrossover between two points, and then the first and third (ranges of P1 crossover: {3, 1}; ranges of P2 crossover: {1, 2}) in P1 and P2 will be implemented the crossover operation for the first part (i.e., the genotype part).
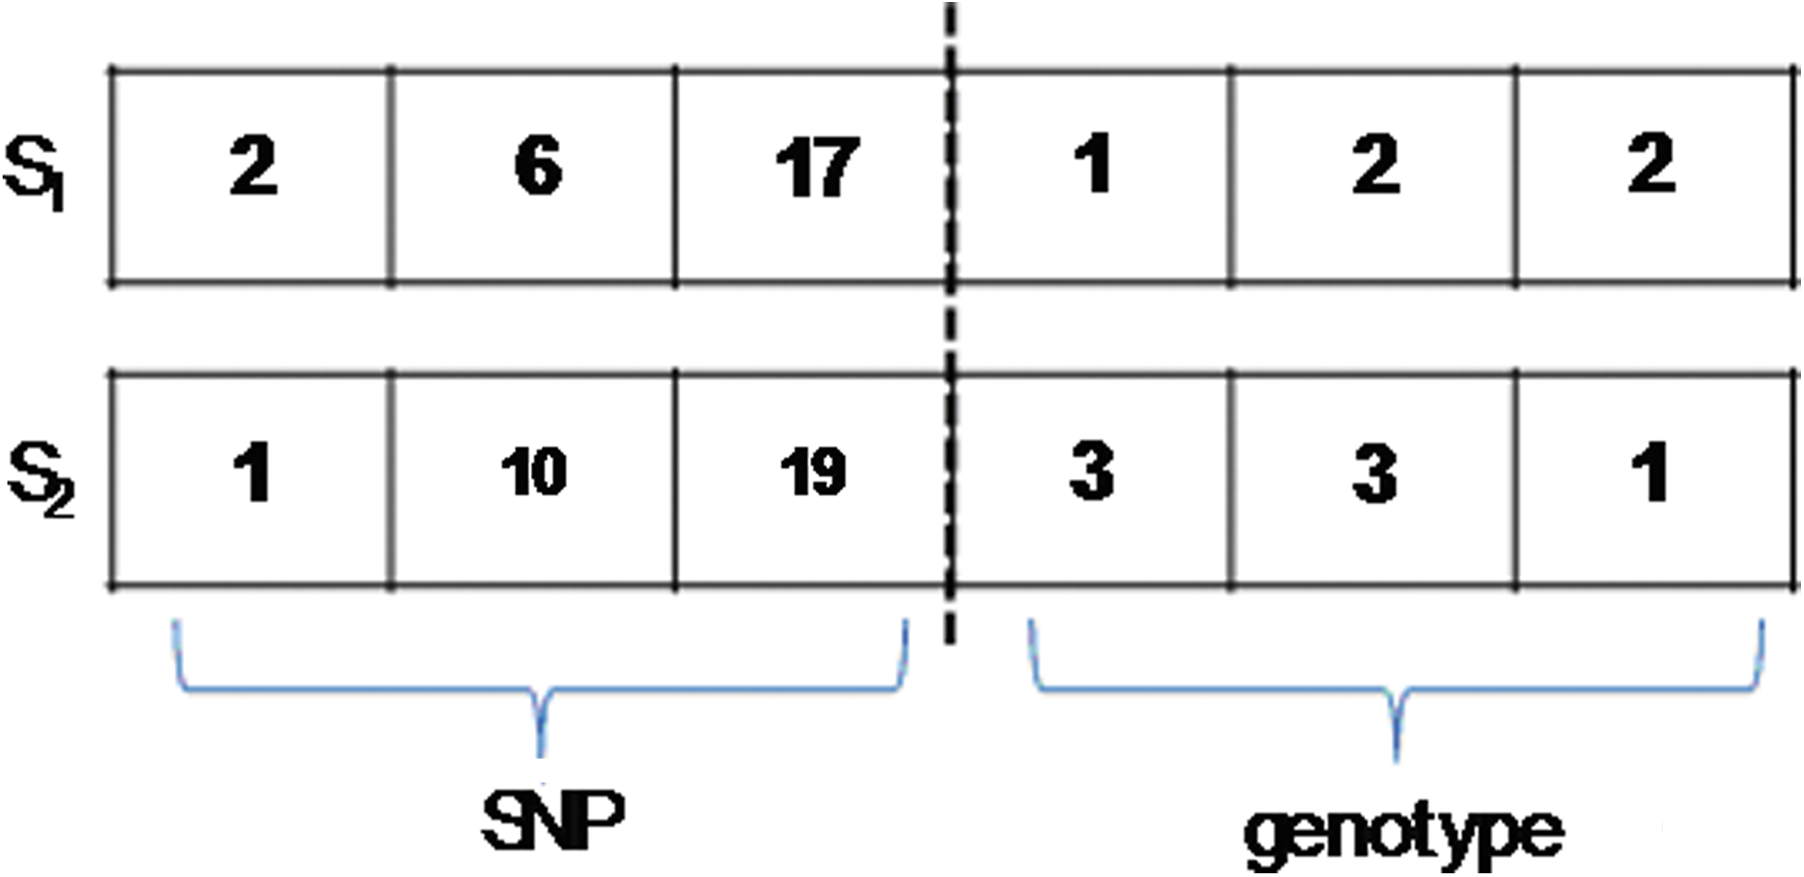
S1 and S2 represent two offspring produced from two parents, P1 and P2. The values of each crossover point are changed in this step, for instance, the values of the ranges of P1 crossover in SNP part are changed with P2, that is, 1-P11st change with 2-P21st and 10-P12nd change with 6-P22nd.
When the fitness value is the same for a given number of iterations, the procedure is possibly trapped within a local optimum. The primary purpose of the mutation operation is to randomly introduce new genetic information and thus contribute to an escape of the fitness value from a local optimum.
Replacement
In GA, the crossover operation generates offspring from two parents, and the mutation operation mildly disturbs the offspring. If an offspring is superior to both parents, it substitutes for the most similar parent. Alternatively, if is the offspring's fitness lies between the two parents, it substitutes for the inferior parent; otherwise, the most inferior chromosome in the population is substituted (Gan et al., 2008).
Parameter settings
The termination condition of the GA is reached at a prespecified number of iterations (100 in this study). The parameters were a population size of 30, a chromosome size double the number of SNPs chosen (i.e., when three SNPs are chosen, the chromosome size is 6). The rates for crossover and mutation were set at 1.0 and 0.1, respectively.
Generation of SNP barcodes
Using a combination of two SNPs as an example (in Table 2), the specific SNPs with genotypes (SNP barcodes) showing the largest difference between controls and cases were computed by a genetic algorithm (Beaudet and Belmont, 2008) as mentioned above, rather than arbitrarily selected. Selection of SNP barcodes with 3 to 26 SNP combinations used the same criteria (not shown).
For example, SNPs (10,17) represent the combination of SNP10–SNP17, that is, rs680–rs2132572. Other combinations follow the same rule. Some combinations such as SNPs (1,2) genotypes 2-2, SNPs (15,19) genotypes 2-1, and SNPs (10,25) genotypes 1-1 are shown to represent the combinations with small differences between controls and cancer cases. Other similar results for two SNP combinations are provided on-line (http://bioinfo.kmu.edu.tw/brca-26SNP.xls) where all the occurrences of every two possible combinational SNPs with genotypes are listed.
The detailed SNP information is summarized in Table 1. For example, SNPs (10,17) with genoypes 2-1 is the combination of [IGF2 rs680-AG]-[IGFBP3 rs2132572-AA].
Statistical analysis
The largest difference in the occurrence between control and breast cancer groups was determined from the SNP barcodes using 2 to 26 SNPs combined with their corresponding genotypes. Logistic regression was used to confirm the GA-generated odds ratio and provided 95% confidence interval (CI). This corresponds to the effect of each specific SNP barcode on the occurrence of breast cancer. Statistical analysis was carried out using SPSS 13.0.
Results
Association between individual polymorphisms of growth factor-related genes in relation to breast cancer
Based on our simulated data as described in Materials and Methods, Table 1 shows the estimated effect (Odds ratio and 95% CI) of individuals with respect to 26 SNPs from 8 genes (EGF, IGF1, IFG1R, IGF2, IGFBP3, IL10, TGFB1, and VEGF) for the occurrence of breast cancer. With the exceptions of IGF1 rs5742678-GG, IGF1 rs1549593-GG, IGF1 rs6220-GG, IGF1R IGF1R-10-aa, IGF1R rs2229765-AA, IGF2 rs680-GA, IGFBP3 rs2854744-CC, IGFBP3 rs2132572-GA, -AA, and TGFB1 rs1982073-CC, namely, SNPs 2, 3, 4, 7, 8, 10, 16, and 17, no other specific SNP was significantly associated with the risk of breast cancer. All these genotype frequencies for the simulated data were the same as described in the literature (Pharoah et al., 2007).
Identification of the best SNP barcodes with the maximum difference between controls and cases
In this study, the SNP barcodes are defined as combined SNPs with their corresponding genotypes. Among the combinations, as shown in Table 2, two specific combined SNPs with their corresponding genotypes, namely SNPs (10, 17) with genotype 2-1; [rs680-GA]-[rs2132572-GG], showed the maximal difference, that is 130 between the ALL_Brca_control and ALL_Brca_case groups (1309 vs. 1179). Similarly, 3 and 26 combined-SNP barcodes with the best performance (largest difference between controls and cases) were mined by the GA. Here, only two to five SNPs for combinational analysis are presented (in the left side of Table 3), although the calculation processes are not shown. In a three SNP combinations, the barcode is SNPs (1, 10, 17) with genotype 1-2-1, that is, [rs2237054-TT]-[rs680-GA]-[rs2132572-GG]. In a four SNP combination, the barcode is SNPs (1, 10, 17, 21) with genotype 1-2-1-1, that is, [rs2237054-TT]-[rs680-GA]-[rs2132572-GG]-[rs1554286-CC]. In a five SNP combination, the barcode is SNPs (1, 10, 17, 21, 26) with genotype 1-2-1-1-1, that is, [rs2237054-TT]-[rs680-GA]-[rs2132572-GG]-[rs1554286-CC]-[rs3025039-CC]. Therefore, the GA provides the highest difference in terms of SNP barcodes between the ALL_Brca_control and ALL_Brca_case groups for fixed numbers of SNPs.
“Other” is the reference group, indicating the union of all other possible two to five SNP combinations.
Application of GA-generated SNP barcodes for odds ratio analysis in order to evaluate the risk of breast cancer
To investigate the combined contribution of many combinations growth factor-related gene SNPs in relation to breast cancer, the GA-generated specific SNP barcodes and their breast cancer susceptibility were analyzed. On the right side of Table 3 the estimated effect (odds ratio, 95% CI, and p-value) of certain SNP barcodes with respect to breast cancer susceptibility are shown. Patients with specific SNP combinations (two, three, four, and five SNPs), that is, SNPs (10, 17), SNPs (1, 10, 17), SNPs (1, 10, 17, 21), and SNPs (1, 10, 17, 21, 26), had 13% (CI: 0.7945–0.9527, p = 0.0026), 13% (CI: 0.7877–0.9522, p = 0.0030), 15% (CI: 0.7608–0.9488, p = 0.0038), and 15% (CI: 0.7473-0.9585, p = 0.0086) reduced odds of breast cancer, respectively, when compared to other SNP combinations with genotypes. Hence, these results suggest that these identified SNP barcodes for growth factor-related genes have a lower association with breast cancer.
Discussion
Accumulating evidence on SNP–SNP interaction supports polygenic models for many types of cancers such as prostate (Sun et al., 2008; Vaarala et al., 2008; Zheng et al., 2008), large B-cell lymphoma (Park et al., 2009), lung (Popanda et al., 2004; Schabath et al., 2006), adult glioma (Liu et al., 2009), breast (Briollais et al., 2007; Lin et al., 2009; Smith et al., 2008), colon (Goodman et al., 2006), and oral cancers (Chen et al., 2008; Huang et al., 2009; Yen et al., 2008). These studies suggest that cancers are associated with combinations of SNPs rather than individual SNPs. However, computational methods to identify such complex interactions are still challenging to implement.
Here, we propose using a GA to computationally screen for the maximum occurrence difference between control and breast cancer groups among SNP combinations. The GA provides the best SNP barcode for the odds ratio analysis. This demonstrates the significance of the DNA barcodes. The lowest risk SNP barcodes for different SNP numbers (two to five) are presented and suggest that special interactions between the 26 SNPs in our study may slightly decrease the risk of breast cancer. The proposed GA-based and odds ratio-based methodology can provide a specific SNP barcode with an optimized fitness value and predict the susceptibility to breast cancer.
The GA also estimates the relative influence of SNPs on the breast cancer risk. In Table 2, SNPs 10–17 are involved in the best barcode among all two-SNP combinations. Similarly, SNPs 10-17-1, SNPs 10-17-1-21, and SNPs 10-17-1-21-26 are the best barcodes among all three-, four-, and five-SNP combinations. These results suggest the following order for the influence of these SNPs: SNPs 10/17 > SNP 1 > SNP 21 > SNP26 in terms of protection against breast cancer.
In many association studies, some SNPs are found to be “not associated” with several types of cancers (Cheng et al., 2007; Kalmyrzaev et al., 2008; Moore et al., 2007; Petersen et al., 2008; Stevens et al., 2008; Yuan et al., 2008). Usually, they are regarded as the unimportant factors when evaluating the cancer risk. However, these studies did not consider the possibility of SNP-SNP interactions. Moreover, many association studies only provided genotype frequencies between the cases and controls. Without the raw genotype data, it is impossible to evaluate SNP–SNP interactions. In our study, we proposed a novel method that provides a genotype simulation from the genotype frequencies in order to mimic the original genotype data. The significance of the stimulated data (adjusted to 5,000) is that it is in accord with the original data (Pharoah et al., 2007) (not shown). Using the stimulated genotype data, susceptibility to cancer or disease in relation to many previous unidentified SNP–SNP interactions can be reconsidered simultaneously.
In this study, the genotype information was simulated at random and depended only on the genotype frequencies. In general, a larger number of stimulated datasets may provide more stable results for certain types of SNP barcodes that are associated with disease; however, the purpose of this study was to focus on the development of a methodology for mining cancer-associated SNP barcodes using case–control studies where only the genotype frequencies are known. Using our stimulated data and source code (Supplementary Files 1 and 2, respectively), the results in the Table 3 are reproducible at the defaulted seed value 7,561. Based on this criterion, SNPs 10, 17, 1, 21, and 26 seem to play an interacting role in relation to the risk of breast cancer under two- to five-SNP combinations among the 26 SNPs (Table 3). However, Table 1 shows SNPs 2, 3, 4, 7, 8, 10, 17, 21, and 26 show significant differences with respect to the risk of breast cancer based on the odds ratio (Table 1). Only SNPs 10 and 17 are common to the estimated effect between individual and combined SNPs for the occurrence of breast cancer. SNPs 1, 21, and 26 are not found to be significant as individual SNPs in relation to the occurrence of breast cancer. These results reveal that the SNPs involved in SNP–SNP interactions may not be detectable using normal association studies that commonly focused on the significance of individual SNPs. Taken together, we found that GA-generated specific SNP barcodes present in growth factor-related genes may protect against the development of breast cancer. Therefore, our proposed method is able to reduce SNP numbers that wet experiments need to target. In the future, these narrowed down SNP barcodes should become convenient candidates for biological examination in association studies.
One possible important factor that might affect the ability to infer using the GA approach is genetic linkage between the SNPs in an individual, which is usually ignored during random genotype generation. Our proposed method is based on simulated data without considering genetic linkage between SNPs that are located on the same chromosome. However, the possibility that some correlation/linkage structure affects the SNP data cannot be excluded. Furthermore, it is should be carefully to interpret the odds ratio data because odds ratio is a good estimation of relative risk only if the rare disease assumption holds, which is not necessary the case for breast cancer unless its prevalence is less than 10% (Zhang and Yu, 1998). The more frequent the outcome becomes, the more the odds ratio will overestimate the risk ratio when it is more than 1 or underestimate the risk ratio when it is less than 1. The true relative risk can be estimated as described (Zhang and Yu, 1998). Therefore, the procedure for generation SNP data from marginal genotype distributions in our proposed method can only be applied to completely independent SNPs.
Recently, a simulation study designed to simulate data when linkage is present and when there is association between markers across the simulated chromosomes has been reported (Hancock et al., 2007). Using the simulation of linkage and association (SIMLA) program (Bass et al., 2004; Schmidt et al., 2005), several genetic scenarios studying the relationships between linked or unlinked markers and disease loci across several simulated chromosomes have been explored. In this study, we had assumed that all SNP have the same sum number of 5,000. However, we cannot exclude the possibility that some gene locus may not be expressed due to functional conservation. Therefore, it would be important to justify this assumed total number based on genetics and epidemiology of breast cancer. Currently, the available chromosome position for each SNP distribution is provided in the Table 1, and it may be helpful to assess the possible linkage between these SNPs in genetic studies if necessary. More epidemiological data should be collected to improve the simulation prediction and become more biologically feasible. In the future, we will develop an improved method that integrates the SIMLA program (Bass et al., 2004; Schmidt et al., 2005) by using the chromosome location of or genomic distance between SNPs. This should help to extend SNP–SNP interaction studies to a broader range of association studies.
Conclusion
The contribution of our study is that we have developed a methodology for generating simulated SNP genotype data from SNPs with known genotype frequencies in order to evaluate SNP–SNP interactions for growth factor-related genes in relation to the risk of breast cancer. The results obtained demonstrate that GA coupled with odds ratio analysis is able to successfully account for complex SNP interactions and provides the best SNP barcode profile for predicting breast cancer cases. This suggests that the method is suitable for the systematic exploration of genome-wide SNP interactions.
Footnotes
Acknowledgments
This work was partly supported by the National Science Council in Taiwan under grants NSC99-2622-E-151-019-CC3, NSC98-2622-E-151-024-CC3, NSC98-2221-E-151-040, NSC98- 2622-E-151-001-CC2, NSC97-2311-B-037-003-MY3, and NSC97-2622-E-151-008-CC2, the funds DOH100-TD-C-111-002 and KMU-EM-99-1.4.
Supplementary Data
Supplementary File 1 (stimulated dataset);  (source code).
Author Disclosure Statement
The authors declare that no conflicting financial interests exist.
References
Supplementary Material
Please find the following supplemental material available below.
For Open Access articles published under a Creative Commons License, all supplemental material carries the same license as the article it is associated with.
For non-Open Access articles published, all supplemental material carries a non-exclusive license, and permission requests for re-use of supplemental material or any part of supplemental material shall be sent directly to the copyright owner as specified in the copyright notice associated with the article.
