




Abstract
Abstract
The transcriptional responses of yeast cells to a wide variety of stress conditions have been studied extensively. In addition, deletion mutant collections have been widely used to measure the combined effect of gene loss and stress on growth (fitness). Here we present a comparative analysis of 1,095 publicly available transcription and genome-wide fitness profiles in yeast, from different laboratories and experimental platforms. We analyzed these data, using T-profiler, to describe the correlation in behavior of a priori defined functional groups. Two-mode clustering analysis of the fitness T-profiles revealed that functional groups involved in regulating ribosome biogenesis and translation offer general stress resistance. These groups are closely related to growth rate and nutrient availability. General stress sensitivity was found in deletion mutant groups functioning in intracellular vesicular transport, actin cytoskeleton organization, and cell polarity, indicating that they play an key role in maintaining yeast adaptability. Analysis of the phenotypic and transcriptional variability of our a priori defined functional groups showed that the quantitative effect on fitness of both resistant and sensitive groups is highly condition-dependent. Finally, we discuss the implications of our results for combinatorial drug design.
Introduction
In recent years, genomic collections of yeast deletion mutants have been exposed to many different conditions, greatly expanding the data on genome-wide behavior. The types of experiments and platforms vary greatly, which has hindered comparative analysis on the level of individual genes. Additionally, several studies of global fitness and transcript levels reported that individual genes required for optimal growth are often not activated transcriptionally under the same conditions (Birrell et al., 2002; Giaever et al., 2002; Smith et al., 2006; Tai et al., 2007). These studies indicate that our understanding of cellular functions required for coping with imposed stresses and their regulation in response to environmental changes is far from complete. To address this issue we performed a comparative analysis of genome-wide studies on the effect of single gene deletions on growth, and integrated this with a similar analysis on the level of transcription, in order to dissect the global changes occurring on different levels of biological control. Using T-profiler, a method based on t-statistics, we directly analyzed the behavior of a priori defined groups, from 159 fitness and 936 transcription experiments (Boorsma et al., 2005, 2008).
We confirm that transcription factor-controlled gene expression is not propagated onto the phenotypic level, with the exception of ribosomal protein-encoding genes, which form a tightly coregulated functional group controlled by a small set of transcription factors. Although similar numbers of significantly altered functional groups are identified in both transcription and fitness profiles, they represent very distinct functions. Two-mode clustering of t-values of Gene Ontology (GO)-based groups and conditions for all fitness t-profiles reveals strong interactions between functional groups and treatments. Reduced functioning of ribosomal biogenesis and translation leads to increased fitness in many, but not all, conditions. In addition, there is a general stress sensitivity of deletion mutants involved in the intracellular vesicular transport machinery and the actin cytoskeleton, functions that seem crucial in the general adaptive mechanisms of S. cerevisiae. Analysis of the variability of a group's transcriptional responses and of the effect they have on fitness throughout the compendium suggests that the regulation of stress-sensitive groups is mostly posttranscriptional. Additionally, the quantitative effect of perturbation of a specific function is highly condition-specific, which provides targets for combinatorial design of antifungal treatment. In conclusion, we report global properties in yeast fitness data and provide a quantitative comparison of global fitness and transcription differences on the level of cellular functions and biological processes. Our results provide a better understanding of yeast adaptation to many conditions, and of the cellular functions required for this adaptation.
Materials and Methods
Libraries of genome-wide fitness and transcription data
Our library of fitness data contains data of 159 fitness experiments carried out with all nonessential deletion mutants of S. cerevisiae (Table 1). The yeast deletion collection can be tested for susceptibility to any type of stress in at least three various ways. The growth of individual mutants can be detected, the colony size of each mutant can be determined, and finally, by amplification of unique tags for each mutant, the abundance of all mutants can be scored simultaneously on a microarray. We used datasets exploring both haploid and homozygous diploid yeast knockout strains, yielding a broad range of datasets that are not easily comparable. Our fitness library contains data from all three different experimental platforms and includes experiments where cells are subjected to various stress conditions. The library of gene transcription data contains data of 936 hybridization experiments carried out with S. cerevisiae from 19 publications (Boorsma et al., 2008). This transcription library contains data from different DNA-array platforms such as Genefilter, Affymetrix, and spotted slides, and includes experiments with gene deletion strains, synchronized cells for cell cycle analysis, sporulating cells, and cells subjected to various physical and chemical perturbations.
The list contains publication from which experimental data was obtained, the type of yeast deletion pool used, the platform that was used to perform the genome-wide experiment, and the number of experiments per study.
T-profiler
We use T-profiler (www-t-profiler.org) to calculate the t-values corresponding to the average fitness levels of predefined groups of deletion mutants (mutant groups) and expression levels of predefined gene groups. Previously, the same method was used to quantify the average expression levels of predefined gene groups in genomic expression and fitness experiments (Boorsma et al., 2005; Zakrzewska et al., 2005, 2007). We use the same method, except for the fact that gene groups now become mutant groups (see below for a description of each category of mutant groups), and their t-scores are calculated with respect to the total population of viable haploid mutants sampled. Both gene and mutant groups can contain the same members, yet to avoid confusion we generally use the term “gene group” for the description of transcription data, and the term “mutant group” for the description of fitness data. The fitness and transcriptome t-profile datasets in our library have been analyzed using T-profiler and the resulting fitness and transcription t-profiles have been uploaded to two databases, which can be found at http://www.science.uva.nl/∼boorsma/t-base-fitness/ and http://www.science.uva.nl/∼boorsma/T-base-all, respectively.
Transcription factor (TF) regulated groups
We specify TF-regulated groups in two ways; Motif-based groups are made up of those genes that contain a common regulatory motif in the 600 bp of their promoter region allowing no overlap between neighboring ORFs (van Helden et al., 2000), The consensus motifs used in T-profiler (Boorsma et al., 2005) are derived from three different sources. First, motifs were extracted from the SCPD database (http://rulai.cshl.edu/SCPD/). Additionally, motifs were found by comparing the genome sequence of highly related yeast species (Gasch et al., 2000; Kellis et al., 2003). Finally, motifs were discovered in various microarray experiments by the REDUCE algorithm (Bussemaker et al., 2001; Roven and Bussemaker, 2003). Most of these motifs are similar or identical to motifs described in the literature. In total, 153 motif groups have been included in T-profiler calculations. Transcription factor occupancy (TFO)-based groups were generated using the TFO data from chromatin immunoprecipitation microarray (ChIP–chip) studies as input in T-profiler (Harbison et al., 2004; Lee et al., 2002). These datasets contain results of ChIP–chip experiments performed in rich medium (YPD) with 203 transcription factors. For 84 of these binding to promoter regions was also measured in at least 1 of 12 other environmental conditions. A mutant was considered to be part of a TFO group if the p-value reported for its gene by the authors was smaller than 0.001. In addition, TFO groups were required to have at least seven gene members. This resulted in 252 TFO groups that were used for T-profiler analysis.
Functional groups
GO-based groups contain the genes/mutants associated with a specific GO category as well as all of its child categories. Only GO groups with at least seven members were used for calculation. This approach resulted in a reduction of the original Saccharomyces Genome Database (SGD) to 3,836 GO-based groups to 1,346 GO-based groups, which were used for T-profiler analysis. Significantly scoring GO-based mutant groups directly indicate which functions or cellular processes are required for optimal growth under a specified condition.
MIPS-based groups contain genes annotated by the MIPS organization as well as three types of categories that were analyzed together with MIPS-derived groups. Three major categories of groups are based on functional classification, protein complex and cellular localization. We only used the MIPS mutant groups with at least seven members for our analysis. Significantly scoring MIPS-based mutant groups directly indicate which functions are required to maintain optimal fitness in a specific stress condition. Three minor categories were added, based on the morphology database, the phenotype database, and the synthetic lethality database. For the first, 4,400 nonessential mutants were scored for their cellular shape and subsequently annotated to 11 categories. We used six of these morphology groups, based on the number of their members and excluding the morphology group named WT (wild type). We tested 233 phenotype categories derived from the MIPS database that describe various features of mutant strains ranging from mutants' drug susceptibilities, defects in cell shape or organelle morphology, cell cycle, mating, sporulation, to auxotrophies, and defects in utilization of carbon and nitrogen. The weakness of this database is such that it is not complete, due to the fact that it is only a collection of available facts from literature. However, because it is entirely based on analysis of mutants, it is very suitable for characterization of fitness data. The Synthetic Lethality Interactions database comprises 462 groups of mutants, representing a full spectrum of biological processes and cellular functions. The data contained there comes from genetic screens where a deletion mutant of a query gene is crossed into an array of viable gene deletions, which generates an array of double mutants that can be scored for synthetic lethal or sick (reduced fitness) phenotypes. The result of such screens provides information on genes that are involved in the same function or genes, which are able to buffer each other's functions (Tong et al., 2004). This database is not yet complete, as only around 10% of genes were tested as a query in the synthetic genetic interaction network. However, the enormous advantage of the Synthetic Lethality categories is that they are determined by the organism and not annotated by a researcher.
Two-mode clustering of fitness t-profiles
The t-values of all GO-groups in all experiments make up a two-dimensional data matrix. To find discreet clusters of both GO-groups and experiments that are most similar, we used two-mode clustering (Van Mechelen et al., 2004). We used a Genetic Algorithm (GA) based two-mode clustering method, that searches simultaneously for the optimal clustering of groups and experiments by minimizing the summed and squared deviation of all t-values from the mean within one cluster (Hageman et al., 2008; Wehrens and Buydens, 1998). In this way, groups that behave similarly under certain experimental conditions will be clustered together. The Matlab routines of GA-based two mode clustering routines applied in this article are available at http://www.bdagroup.nl (Hageman et al., 2008). A GA requires a predefined number of clusters on both axes. We chose the knee method to decide on the correct number of clusters. This method finds the knee or “L” in a contour plot of the number of clusters versus the sum of squares of the residuals (Salvador and Chan, 2004). The knee is a combination of cluster numbers for which an additional cluster no longer sharply decreases the sum of squares of the residuals. No unique L could be recognized, and we decided on 10 GO ontology group clusters, and nine experiment clusters, because increasing these numbers did not lead to a strong increase in performance.
Analysis of group variability
To systematically analyze group behavior over all datasets, we calculated for each group its general position on a scale of resistant to sensitive, by calculating the t-value for all its t-scores in the 159 fitness experiments compared to the t-scores of all other groups (Tmean), as well as its position on a scale from minimally modified to highly modified, by calculating a t-value for the deviations of the group's t-scores from the average t-score over all experiments (Tvar). Similarly, we calculated these values for all groups in all 936 transcriptome datasets to understand transcriptional variability of groups.
with the pooled standard deviation
Here μγ indicates the average t-value and sγ the standard deviation of one group over NG experiments, whereas μ′γ is the average t-value and s′γ the standard deviation for all other groups over all experiments, adding up to N′γ. For the variability the absolute deviation of the group t-value in each experiment from the average t-value of this group over 159 or 936 experiments was calculated. A t-value was calculated (Tvar), similar to that for the mean, but now using the set of deviations instead of actual t-values. Associated p-values were corrected for the total number of t-values in the analysis, and a corrected p-value of 0.05 or lower was considered significant.
Results
Generation and analysis of fitness t-profiles
We collected 159 global fitness datasets of homozygous diploid or haploid deletion strains of all nonessential genes of S. cerevisiae exposed to various environmental conditions, including two datasets of our own (Table 1). Each fitness experiment provides a quantitative description of a whole spectrum of susceptibilities, ranging from highly sensitive to highly resistant, of all individual deletion mutants, represented by the log2 ratio of abundance of the single mutants in control versus treatment. We reanalyzed the fitness of mutant groups compared to the whole population using T-profiler (Boorsma et al., 2005), which converts fitness values from all individual mutants into a set of t-values for all mutant groups, resulting in a fitness t-profile (Fig. 1). Similarly, a transcription t-profile is the collection of all t-values of predefined gene groups for each individual transcription experiment in our collection of 936 such experiments (see (Boorsma et al., 2008). One of the important advantages of T-profiler over other methods used to analyze large-scale datasets is that the transformation of the data into a number of t-values for all groups introduces an intrinsic normalization. It therefore allows for direct comparison of datasets from various types of experiments, including colony size measurements, arrays for assessing abundance of all deletion mutants by unique DNA tags, individual growth curve monitoring or the use of haploid or diploid strains. Importantly, it also allows comparison of fitness and transcription experiments (Boorsma et al., 2008; Zakrzewska et al., 2005, 2007). Second, the group-wise analysis gives greater robustness against possible errors in the determination of fitness of individual mutants, both because of the group size (Kim and Volsky, 2005) and because in T-profiler the single highest and lowest value in the group are discarded, thus minimizing the effect of outliers (Boorsma et al., 2005). Last, T-profiler is capable of detecting minor changes in average fitness, which means that individual mutants do not need to show significant changes in fitness in order for the group to show a significant change, if the changes are strongly correlated. This property of T-profiler analysis provides a more realistic insight into cellular responses than any stringent cutoff, as many biological processes tend to be regulated in subtle and gradual ways (Bussemaker et al., 2007).
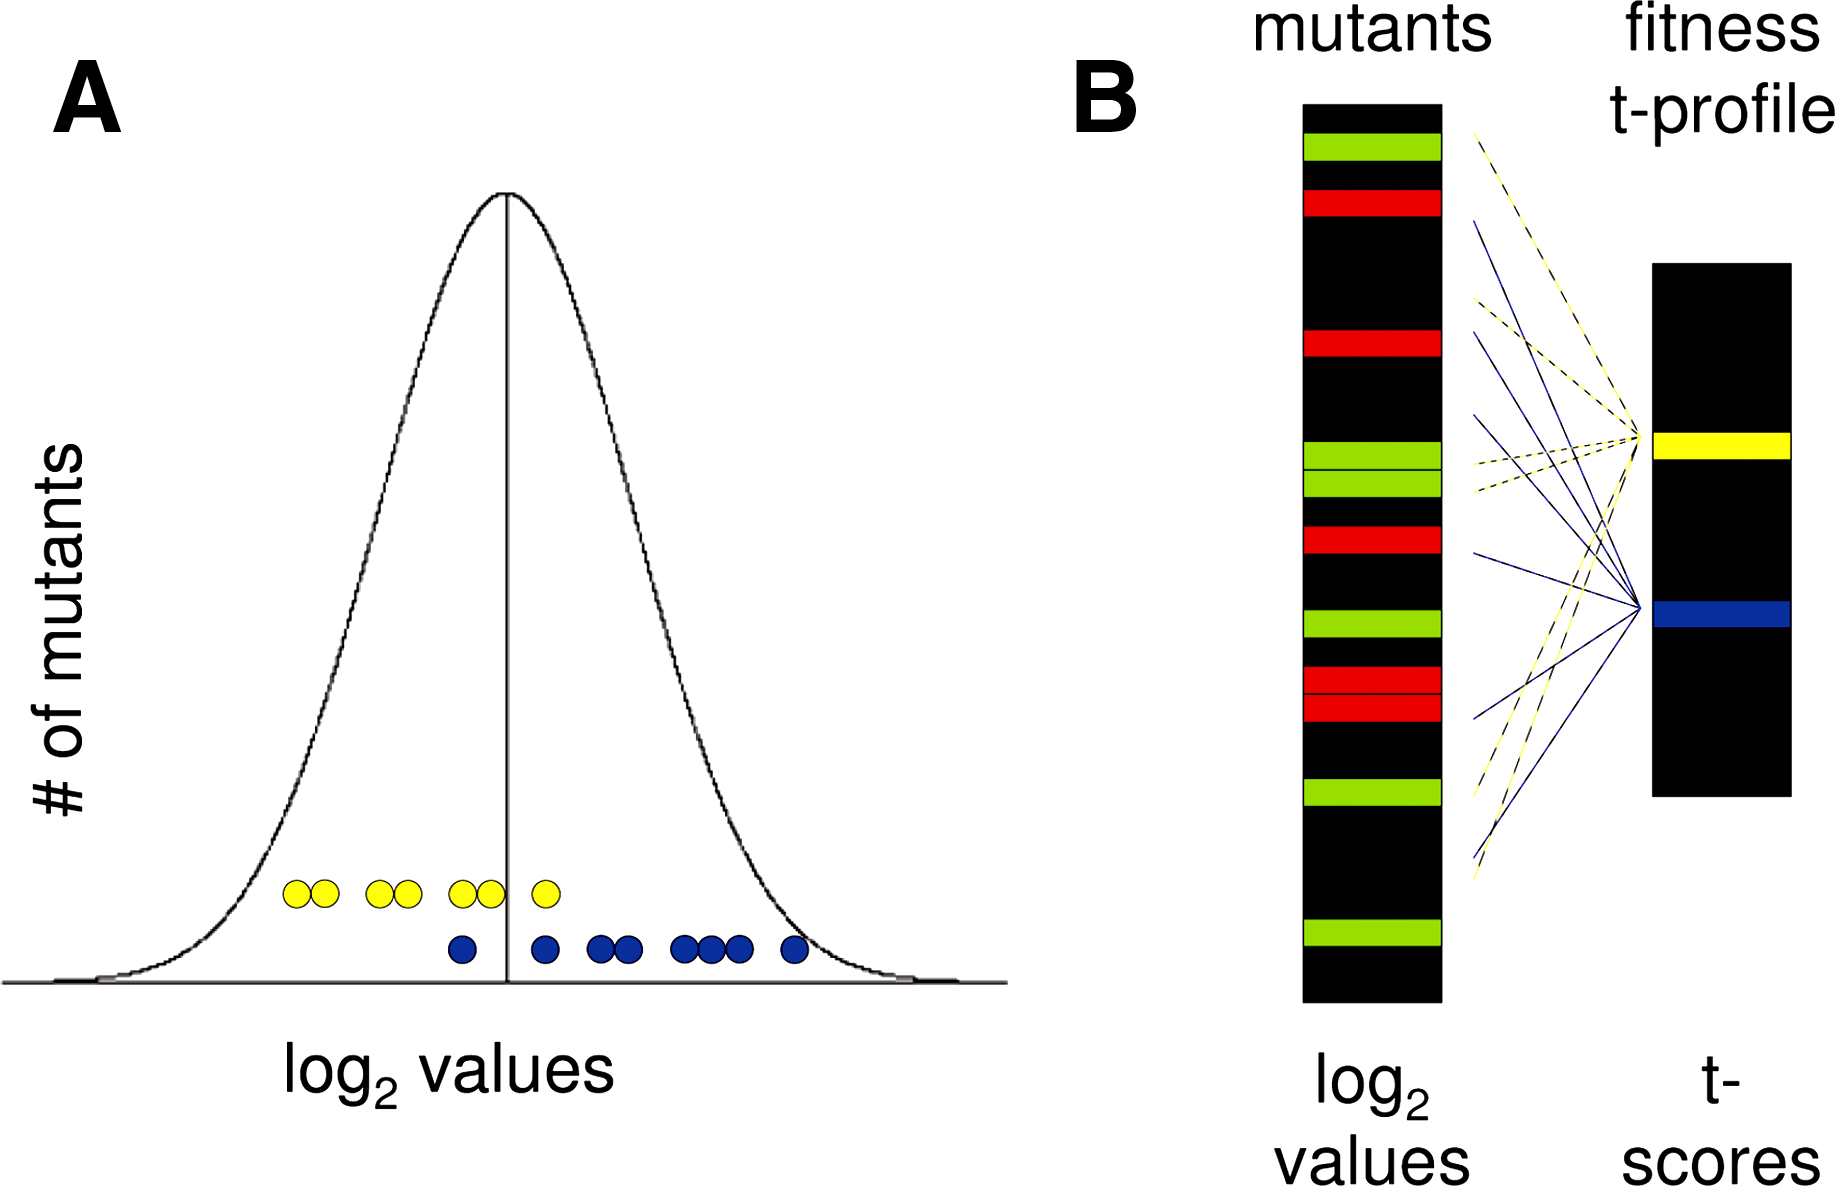
T-profiler analysis converts fitness or transcriptome data into functionally interpretable groups. (
Functionally related genes are required for optimal growth under stress conditions
To respond and adapt to varying growth conditions particular functions and cellular processes need to be activated or repressed upon change. We speculated that mutation of genes that participate in adaptation to an environment should result in the mutants sharing similar phenotypes or fitness properties. We found that yeast strains deleted for genes regulated by the same transcription factors do not generally share similar fitness properties. Although groups of genes controlled by specific transcription factors did show coordinated behavior in transcription datasets, they did not appear as significant groups in fitness datasets (Fig. 2a and b). The exception to this rule were the groups controlled by Fhl1p, Rap1p, and Sfp1p (Supplementary Table 1). All three transcription factors are almost exclusively involved in regulating the transcription of ribosomal proteins and genes involved in ribosome biogenesis (Zhao et al., 2006). The corresponding gene and deletion mutant groups were significant in many transcriptional datasets, but also in up to 50% of the fitness datasets.
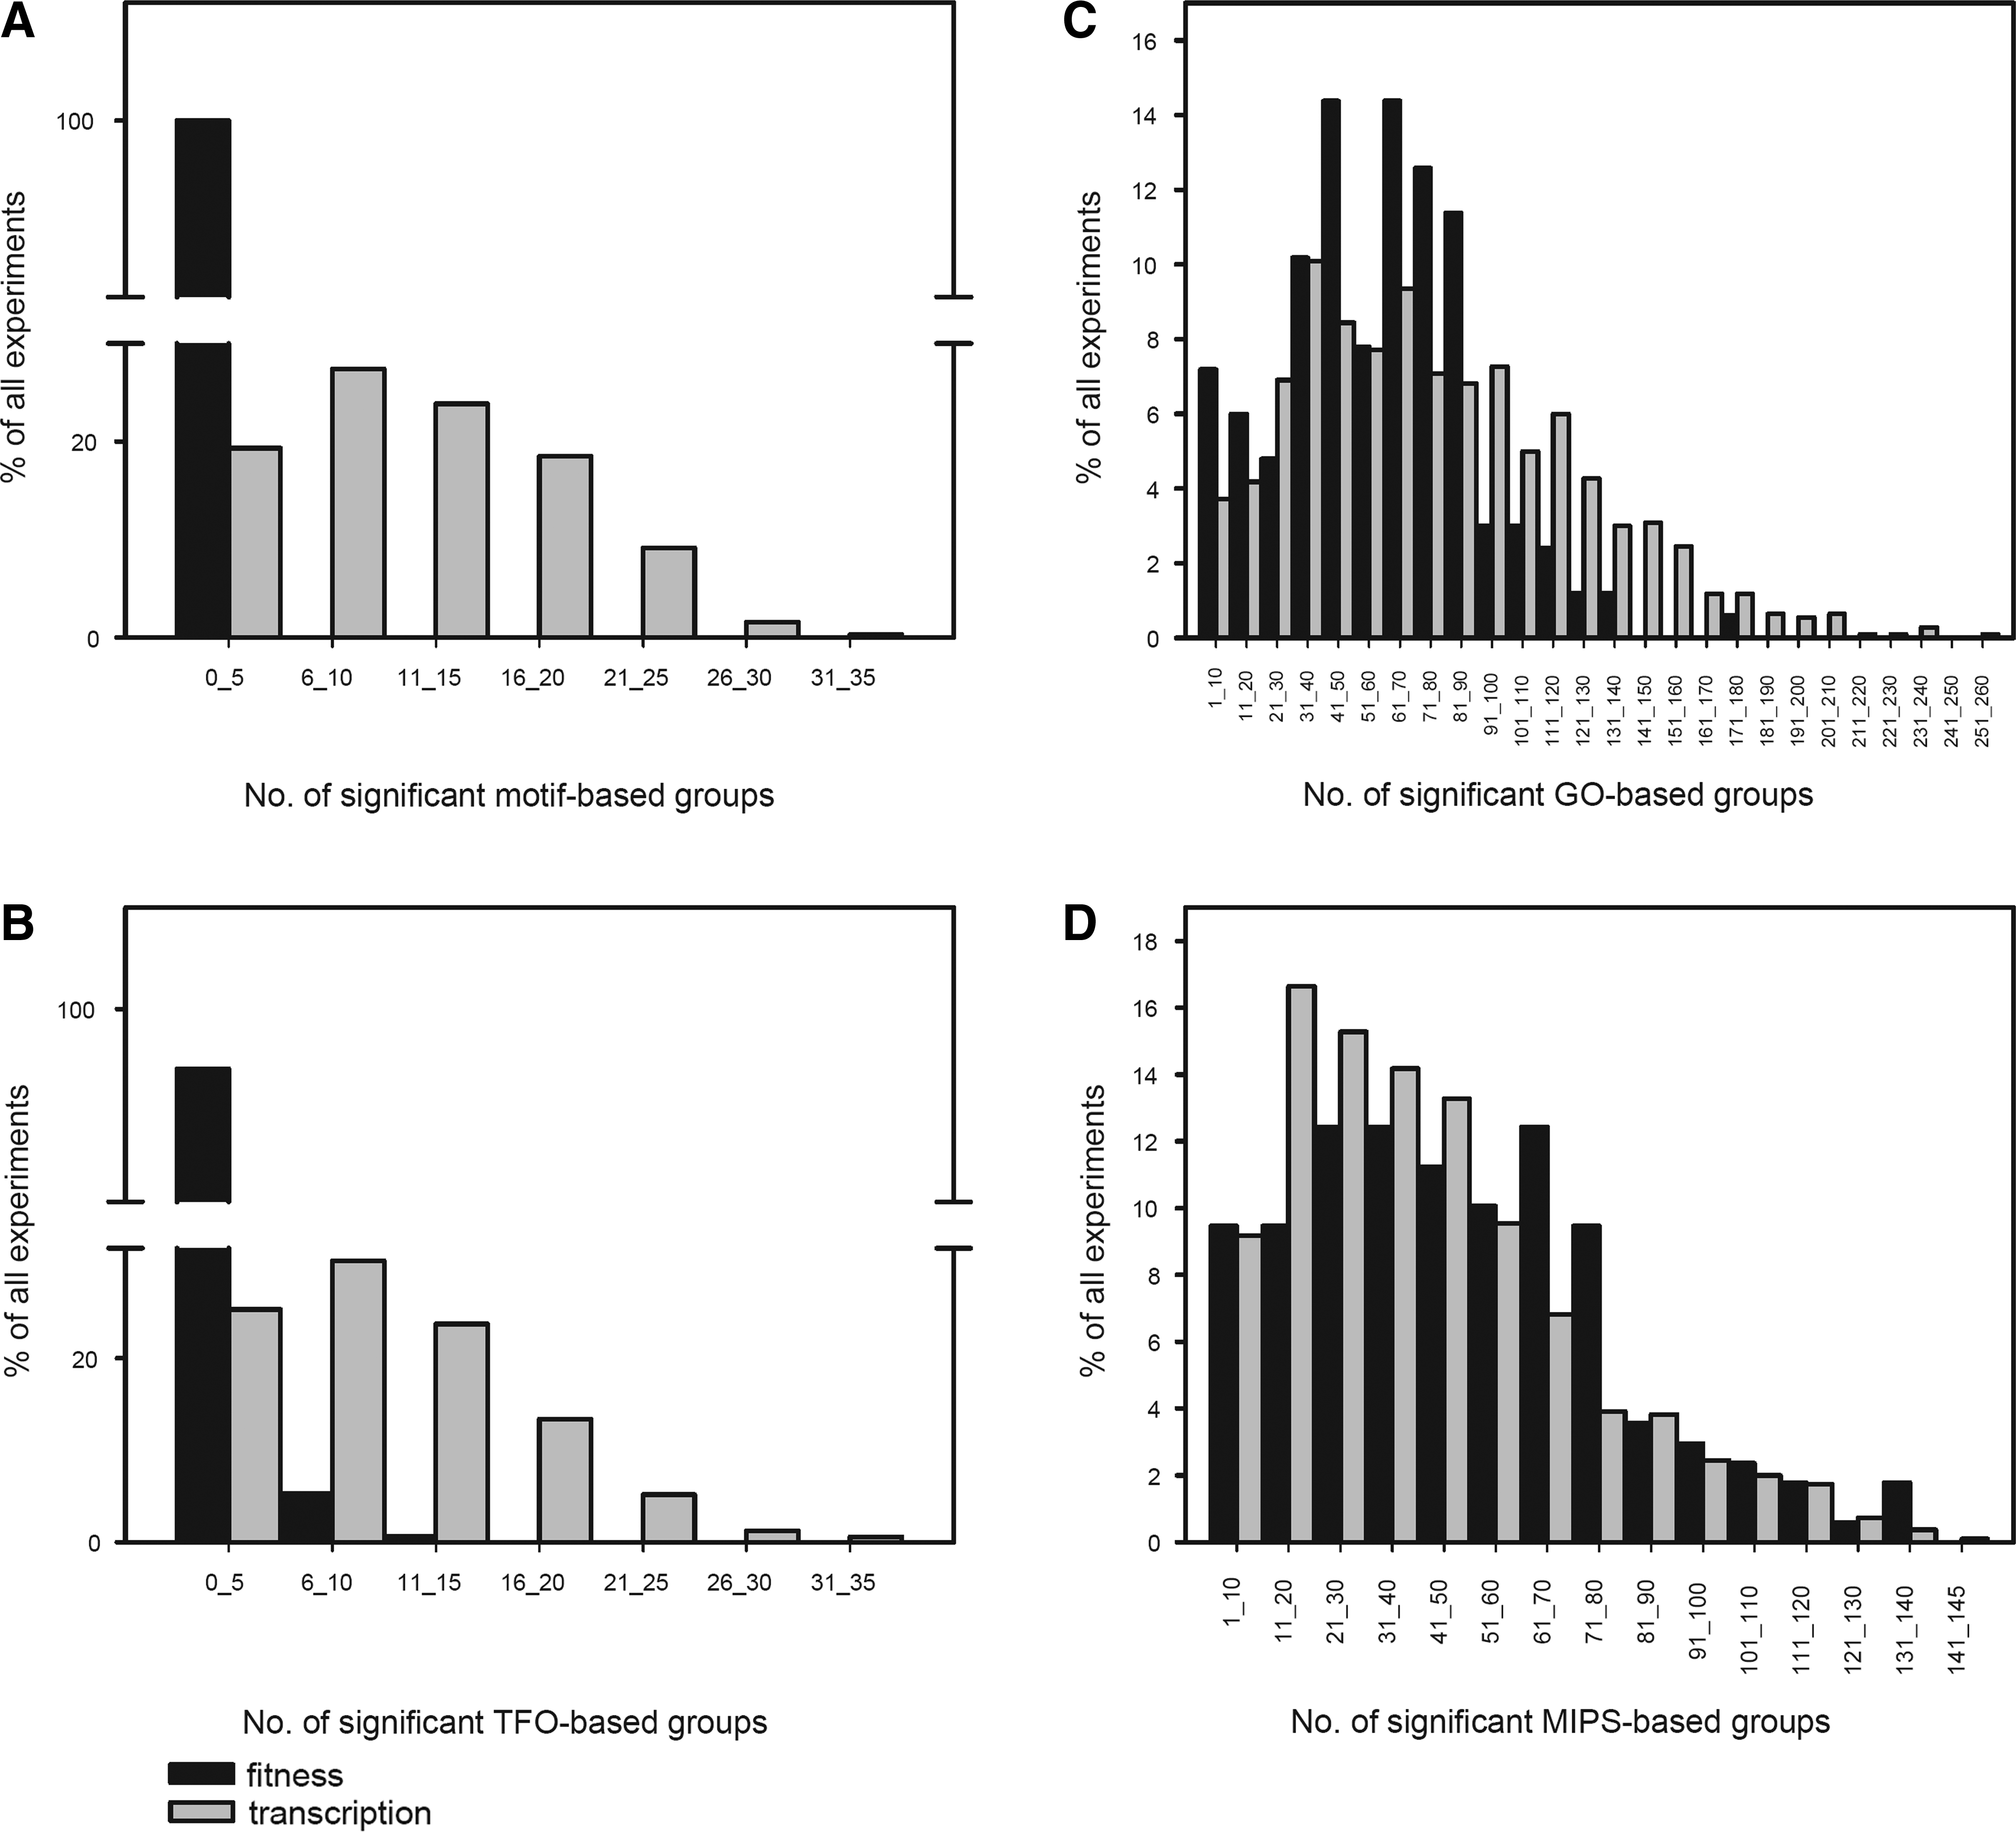
Distribution of significantly altered gene groups in fitness and transcription experiments. For each fitness and transcription experiment the t-values of the motif-, TFO-based, GO-based, and MIPS-based gene groups were calculated (see Materials and Methods for details) and the number of significant t-values per experiment was determined. The percentages of experiments with the indicated numbers of significantly changed gene groups (in indicated bins) are shown. (
To examine whether fitness properties of deletion mutants are linked to functional characteristics other than transcription factor regulated gene expression, we studied the distribution of gene and deletion mutant groups derived from GO and MIPS in both transcription and fitness and datasets (Fig. 2c and d). The majority of fitness t-profiles (81%) and transcriptome t-profiles (61%) scored more than 10 significantly changed GO-based groups. Similarly, above 80% of all fitness and transcription t-profiles scored more than 10 significantly changed MIPS-based groups. This shows that many functional groups are transcriptionally regulated, and that deletion mutants in functional groups often have correlated growth effects. However, we cannot determine from these results whether the functional groups in both types of data are the same. To further investigate this point we performed a direct analysis of the individual groups that were transcriptionally regulated or those that resulted in similar phenotypes, in a subset of experiments with identical treatment times and dosages of three DNA-damaging agents (Birrell et al., 2001). Our data revealed that there was no correlation of GO groups between the fitness and transcription t-profiles (Supplementary Fig. 1).
These results show (Fig. 2) that genes required for optimal growth under specific conditions generally function together in biological processes, or that their gene products localize to the same cellular compartments and/or form complexes, or that their deletion mutants share morphological characteristics. However, the genes in these groups are rarely transcriptionally coregulated, while transcriptionally coregulated functional groups do not share fitness characteristics.
Two-mode clustering of fitness t-profiles reveals general fitness characteristics of Saccharomyces cerevisiae
We next asked whether the fitness data reveal general features required for adaptation to suboptimal growth conditions, similar to the well-described ESR in transcriptome experiments (Gasch et al., 2000; Gasch and Werner-Washburne, 2002). Above, we showed that yeast fitness is not defined by transcriptional responses, but that mutations in genes that belong to specific functional groups often lead to similar effects on fitness. To analyze behavioral correlation between different functional groups, we performed two-mode clustering analysis (Hageman et al., 2008) of the 561 GO groups with significant fitness t-scores in at least 4 out of the 159 experiments. Two-mode clustering minimizes deviations within whole clusters, rendering this method exceptionally suitable to reveal general traits and to emphasize interactions between functions and growth conditions. We determined an optimal combination of 10 GO group clusters (rows,
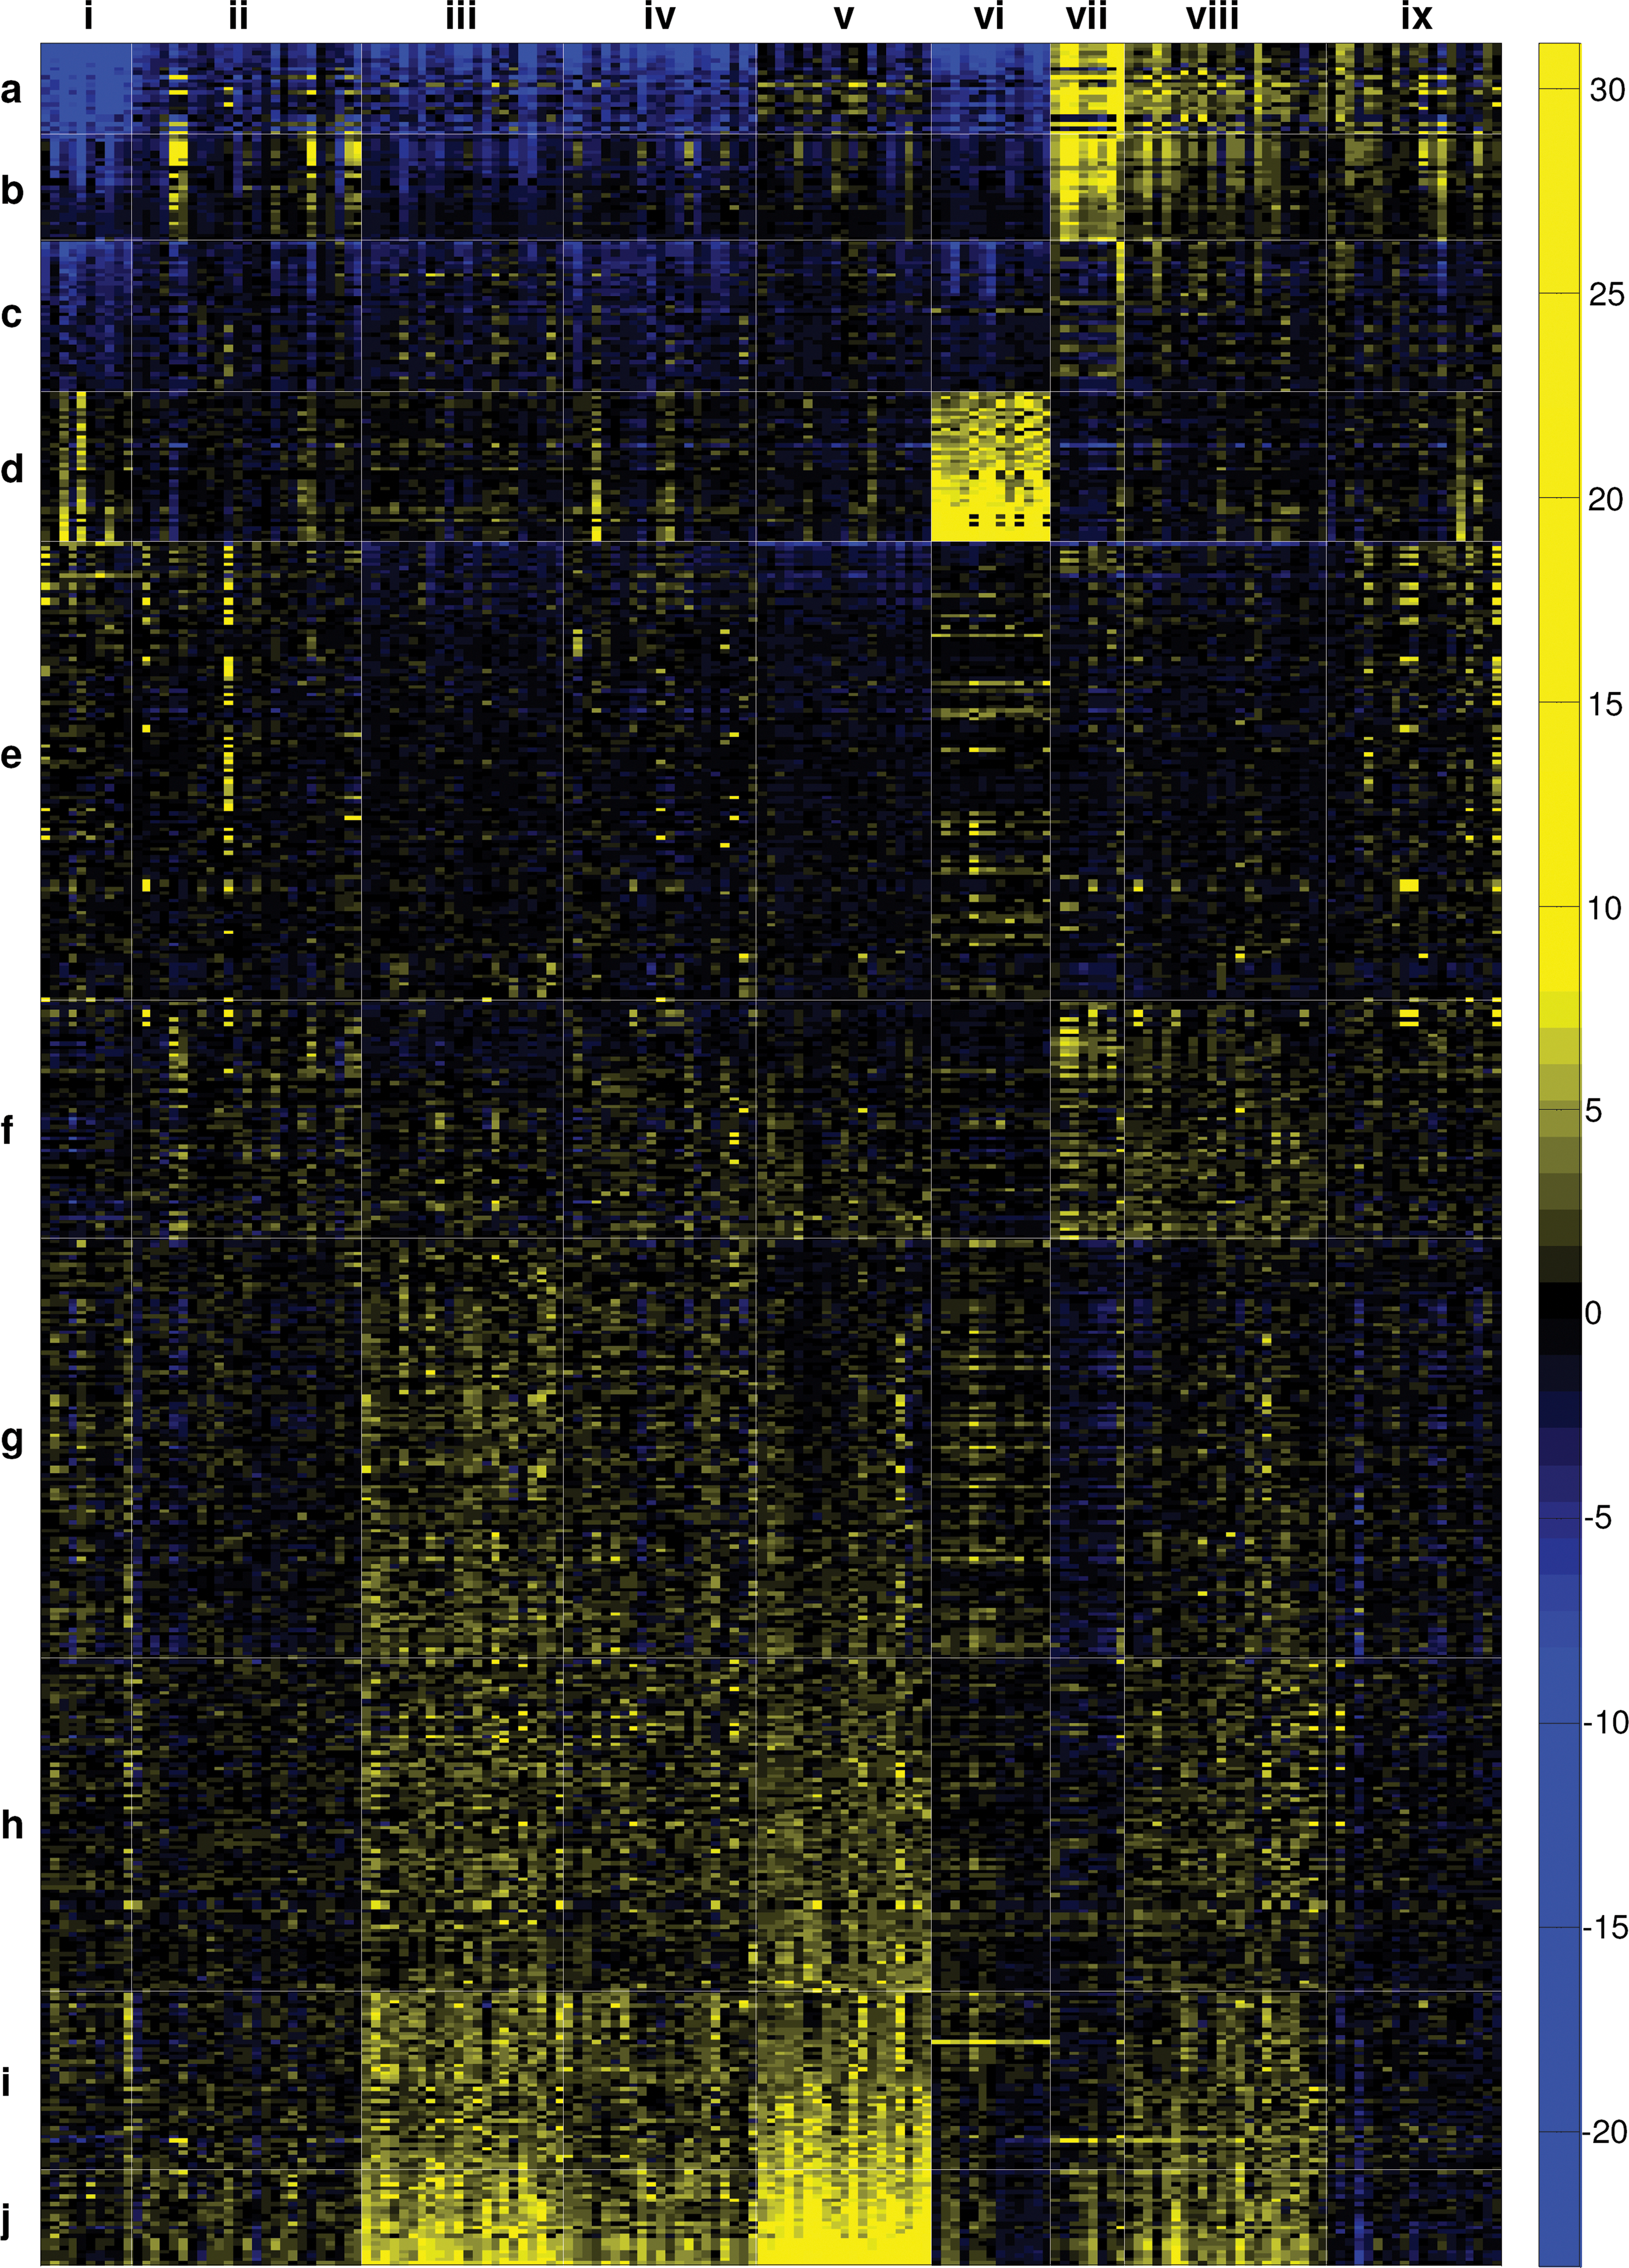
Two-mode cluster analysis of GO-based fitness t-profiles. The t-values in all 159 fitness experiments for the GO-based mutant groups that were significant in at least four fitness experiments were clustered into 10 group clusters and 9 experimental clusters using a GA-based two-mode clustering algorithm (See Materials and Methods). Each column represents a single fitness t-profile, and each row represents a single GO-based group. Blue indicates resistant, and yellow indicates sensitive groups. For a complete description of all clusters see Supplementary data.
Several clusters appeared generally stress resistant, meaning that the average stress-induced growth reduction of the deletion mutants in these groups is significantly less than the average growth rate reduction of all other deletion mutants in the population. In clusters
Clusters
Remarkably, clusters
Group fitness dynamics separate functions important for general cellular maintenance from those important for adaptability
As observed in Figure 3, functional groups can be either generally sensitive or resistant, or largely stress specific. Also, group fitness can either vary widely, or show very little variation. We hypothesized that groups with low fitness dynamics are either generally important, if they are always sensitive, or are highly condition specific, if they tend to be neutral to resistant. In contrast, highly dynamic groups should be important for adaptability, as their role varies strongly with the changing environment. To test our hypothesis, for each group we calculated its general position on a scale of resistant to sensitive (Tmean), as well as its position on a scale from minimally dynamic to highly dynamic (Tvar) (see Materials and Methods), compared to all other groups. This allows us to systematically analyze the variability of functional group behavior, and to determine for all groups whether they are important for general cellular maintenance, or for adaptability.
A plot of Tvar versus Tmean is depicted in Figure 4A, and was colored depending on the clustering shown in Figure 3. We observed a strong aggregation of groups in the generally stress resistant clusters
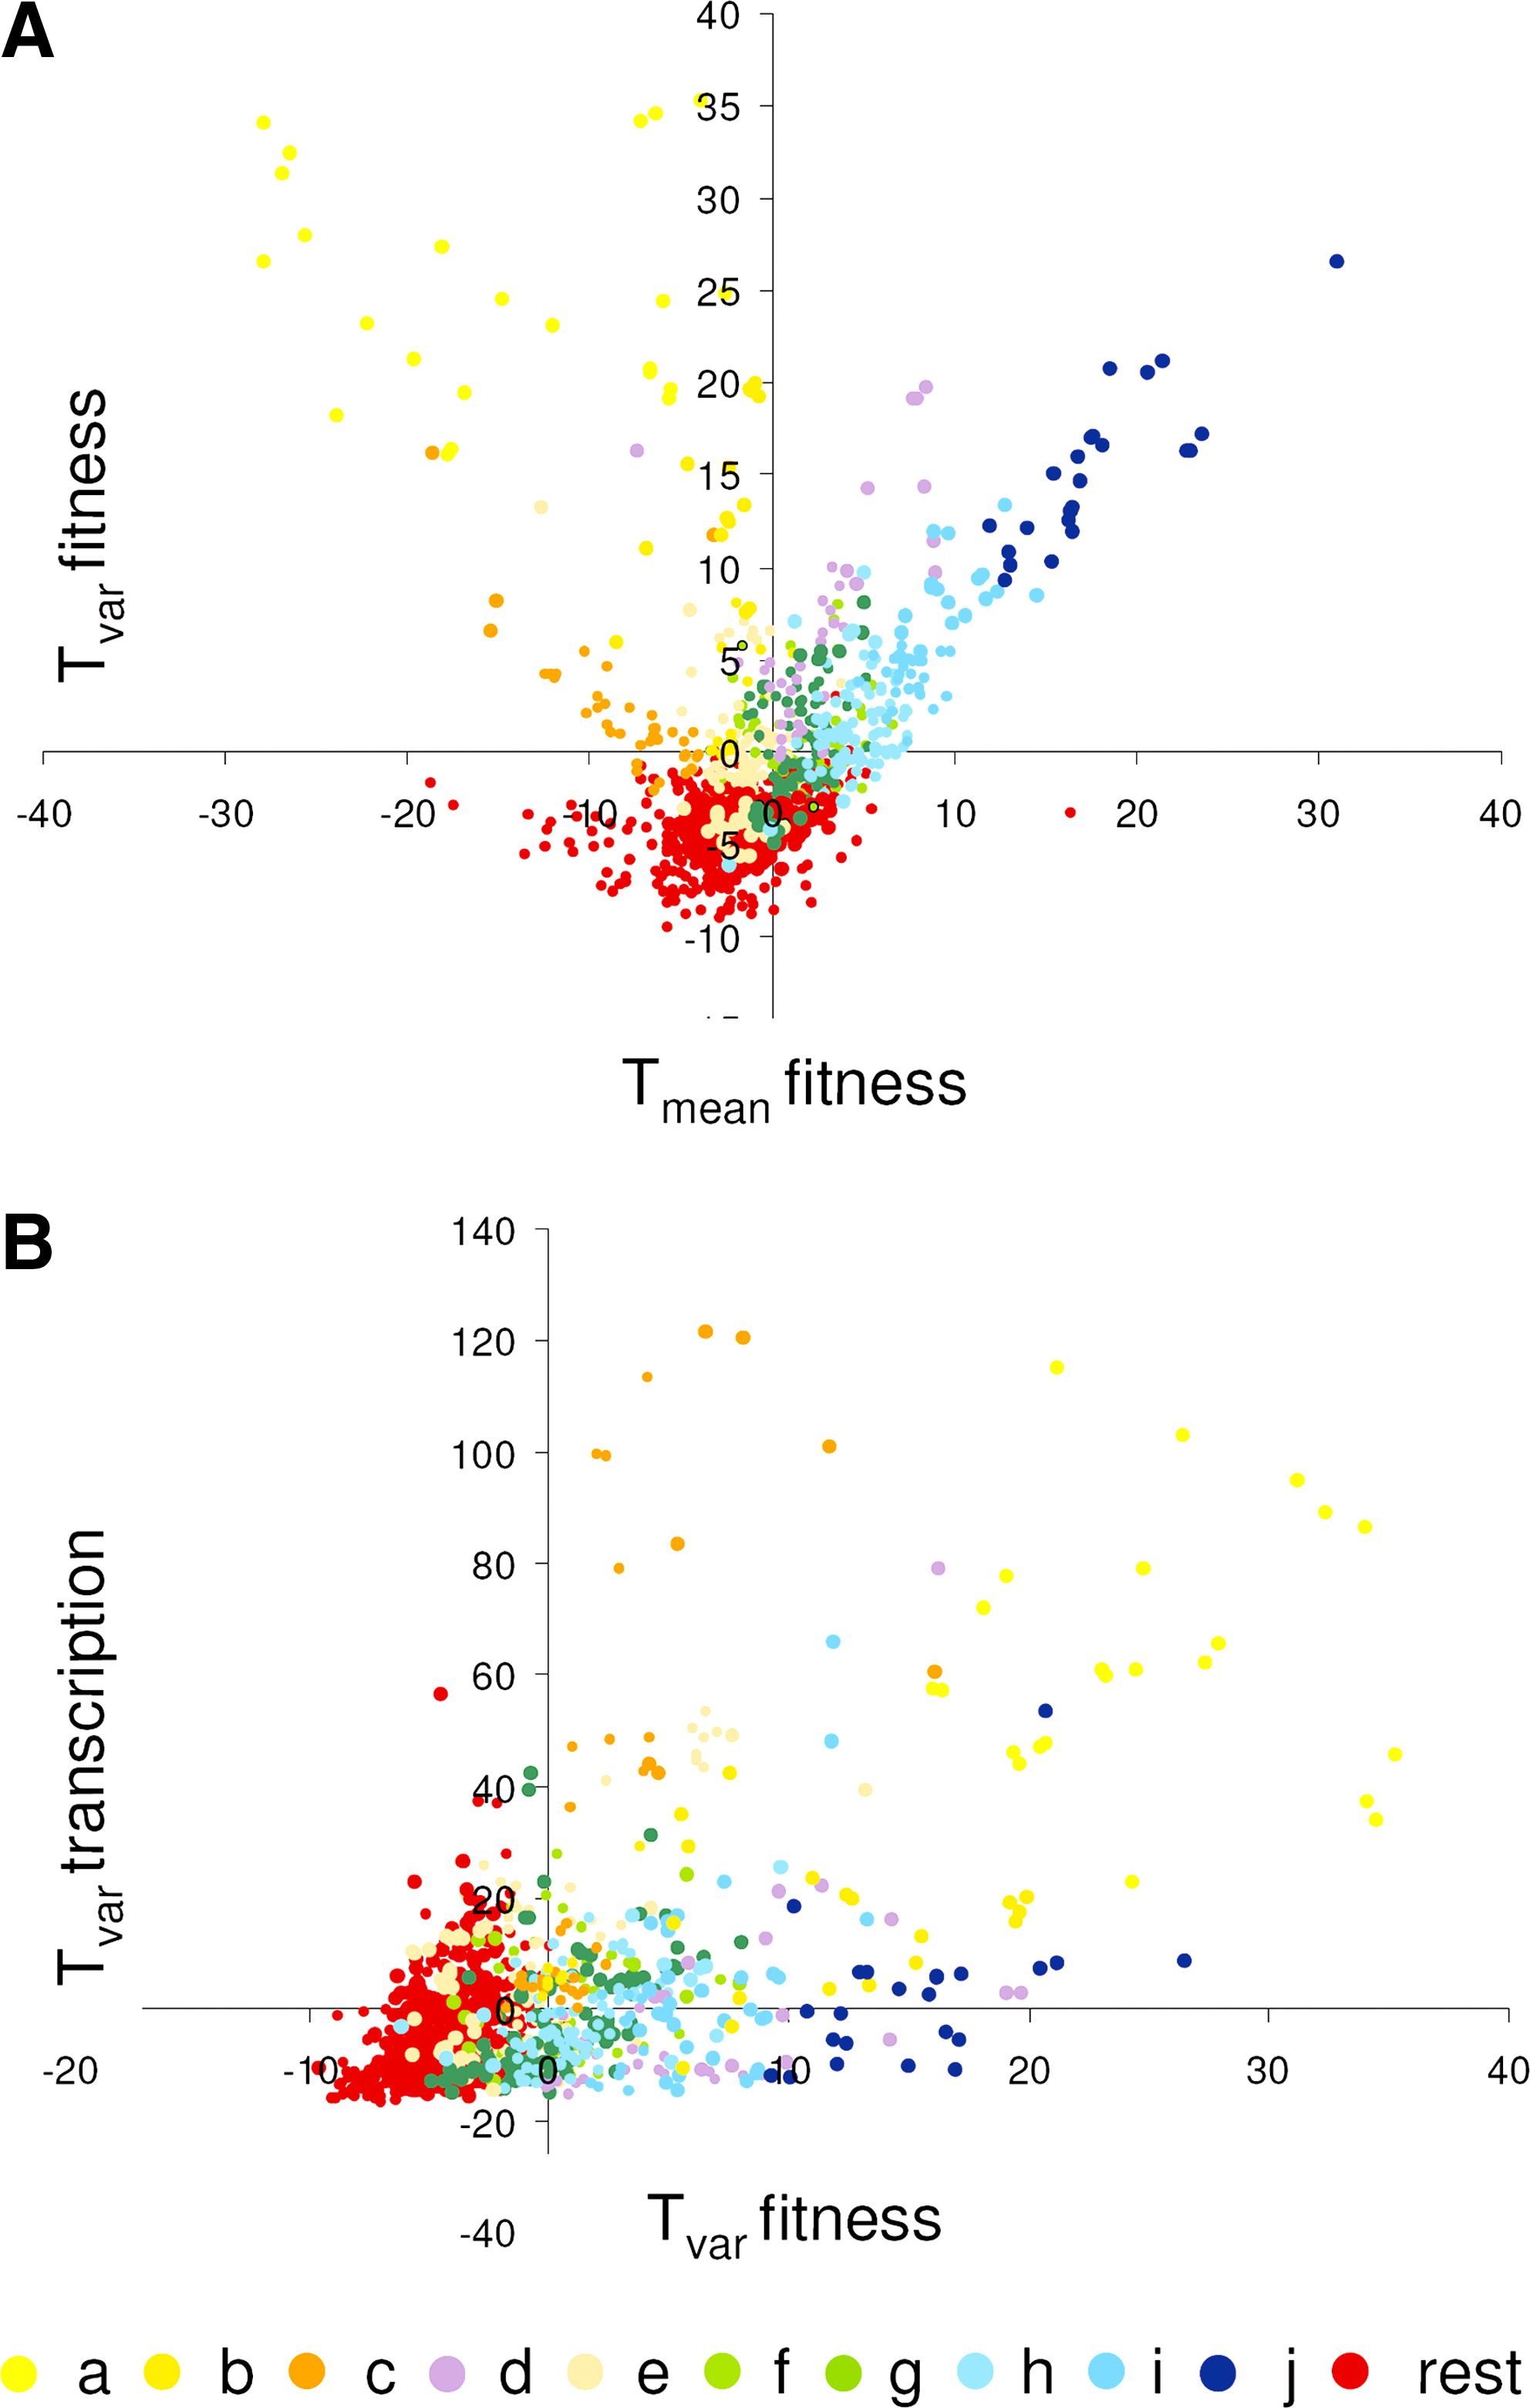
Variability of GO-ontology based functional groups in fitness and gene expression data. (
We find many functional groups that have significantly low variability (438 out of 1,186 tested, see Supplementary data) in the lower part of Figure 4A. Most of these groups are absent in the two-mode cluster analysis, because we selected only groups with significant t-scores in four or more experiments for the clustering. Mutations in genes belonging to these groups have very little effect on fitness in our set of experiments, either positively or negatively. It is possible that the corresponding functions do not actually have low variability in all conditions, but are not challenged in the experiments analyzed, for example, because they are important for specific developmental pathways such as pseudohyphal growth, mating, or sporulation. Alternatively, the fitness of deletion mutants in these groups does not vary much because the effect of deletion of genes in these functions is buffered. Indeed, GO-ontology groups such as karyogamy and conjugation with cellular fusion, spore wall and pro-spore membrane, pseudohyphal growth, but also replicative cell aging and nicotinamide metabolic process, are among the significant low variability groups (see Supplementary data), and are also significantly resistant, suggesting that the presence of these specific functions leads to nonoptimal growth in most cases, and that the inactivation of these functions causes the cells to grow better in most suboptimal environmental conditions.
Interestingly, in the large set of functional groups that show low fitness variability we also found many central cellular functions such as those involved in tRNA and amino acid biosynthesis, and central carbon metabolism. It seems likely that the effect of single gene mutations in such functions would be buffered, either by the presence of “redundant” genes, or by less easily identifiable properties of the entire cellular network.
General stress-sensitive groups are posttranscriptionally regulated
If the regulation of the function of a group is mostly on the transcriptional level, the dynamics of transcription should be similar to the dynamics in fitness. If a function is transcriptionally highly variable, but does not lead to variability of fitness, the transcriptional regulation is not relevant for fitness. On the other hand, if a function's effect on fitness is highly variable but is not mimicked by a variability on the transcriptional level, the effect of the function must be regulated posttranscriptionally. Thus, we can obtain insight into the regulation of a functional group from the relationship between variability of fitness and variability of transcription.
We compared Tvar for transcript data with Tvar for fitness data (Fig. 4B). Clusters
Discussion
The relation between fitness and growth
In exponentially growing cells RP genes account for nearly 40% of the total number of polymerase II-mediated transcription initiation events (Warner, 1999). Their transcriptional regulation plays a central role in the control of cell growth through control of translation rate (Schawalder et al., 2004; Wade et al., 2004; Warner, 1999; Warringer et al., 2003). Genes involved in ribosome biogenesis, controlled by Rap1p, Fhl1p, and Sfp1p (Marion et al., 2004; Zhao et al., 2006) are strongly transcriptionally coregulated, and this transcriptional coregulation also reflected in fitness. Mutations in these genes lead to slow growth (Giaever et al., 1999, 2002; Warringer et al., 2003). In our experiments this is also exemplified by the “sensitivity” of the groups in clusters
Our method analyzed fitness of all mutants within the population of deletion mutants only rather than in comparison to wild type, which might be one reason for the apparent resistance of ribosome-related deletion mutant groups. However, others have already shown that the ribosome-related mutants are not only the least sensitive within a mutant population, but are indeed stress resistant compared to wild type (Giaever et al., 2002; Tai et al., 2007; Warringer et al., 2003). It has been suggested that the perceived resistance is an artifact of the comparison of stress condition to control condition as deletion mutants are slow growers in optimal conditions, but often display growth rate similar to wild type in stress conditions. It should be borne in mind, however, that the growth rate of these mutants in control conditions is only moderately reduced compared to wild type (Jasnos and Korona, 2007; Warringer et al., 2003), and can be reduced further by additional mutations as predicted by models for genetic interaction (Mani et al., 2008). The mutants could therefore still display condition dependent growth rate reduction comparable to wild-type, which suggests that mutations in these groups lead to actual resistance. Why then do these groups lead to increased fitness in stress conditions? The same set of functional groups are strongly and coordinately downregulated in response to many stresses (Causton et al., 2001; Gasch et al., 2000; Smirnova et al., 2005), and their transcription also strongly correlates with growth rate (Brauer et al., 2008; Castrillo et al., 2007; Regenberg et al., 2006). Growth rate decrease, either induced by mutation of by stress-related downregulation of growth related processes, therefore seems to be important to withstand environmental change. Indeed, in bacterial populations slow growing, genetically identical subpopulations (persisters) have been shown to display significantly enhanced resistance to antibiotics (Balaban et al., 2004). Together, these phenomena suggest a functional role for the environmental stress-induced downregulation of ribosome biogenesis and protein synthesis in growth rate control (Jorgensen et al., 2004; Levy et al., 2007). Such control is key to the successful adaptation to environmental stress.
General requirements for adaptation
Very few transcription factor-regulated mutant groups were significant in the fitness t-profiles. This contrasts sharply to their scores in transcription data. As observed before, transcriptional regulation is only rarely reflected in a growth phenotype (Birrell et al., 2002; Giaever et al., 2002; Haugen et al., 2004; Smith et al., 2006), and many pos-transcriptional or network effects disturb the correlation between transcription and fitness. The significant exception from this general observation are the functional groups involved in ribosome biogenesis. Their behavior in fitness experiments correlates highly with their coregulated expression by the transcription factors Fhl1p, Rap1p, and Sfp1p, regulating the transcription of ribosomal proteins and genes involved in ribosome biogenesis (Lee et al., 2002; Zhao et al., 2006).
Comparative analysis of fitness and transcription t-profiles revealed a similar distribution of the numbers of significant GO- and MIPS-based groups in both types of large-scale data (Fig. 2c and d). However, these two types of data represent entirely distinct functional classes. Members of mutant groups involved in common cellular processes often share fitness properties. Fitness of a deletion mutant subjected to a specific condition depends on the fitness contribution of the cellular function in which its gene product participates, and on the adaptive response to that condition. Deletion mutants whose genes are not involved in common processes but are steered by a common transcription factor often lack concerted fitness effects. A possible explanation is that fitness and transcriptome experiments are generally performed on very different time scales; yeast transcriptional changes are studied mostly within the first 2 h of application of stress (one to two generation times), whereas changes in mutant fitness are investigated after 6–16 generations. Indeed, the ESR transcriptional responses are usually transient (Gasch et al., 2000; Gasch and Werner-Washburne, 2002), globally controlled by chromatin modifications (Alejandro-Osorio et al., 2009). These initial responses potentially serve to create a permissive state for more lasting adaptive responses.
Based on global fitness data, it is possible to identify a functional general adaptive response. The two-mode cluster analysis of GO-based fitness t-profiles revealed that the functional groups related to ribosome biogenesis, structure, and assembly perform better in the majority of stress conditions, except for those involved in regulation of growth in response to nutritional signals. Second, we observed hypersensitivity of deletion mutants participating in intracellular transport (vesicle-mediated, endosome, Golgi, and secretion) to most imposed stresses, indicating that these functions may play a central role in response to changes in the environment. Indeed, many genes involved in these functions were identified in two comprehensive chemogenomic screens as multiple drug resistance genes (Dudley et al., 2005; Hillenmeyer et al., 2008). In addition, deletion mutants involved in actin cytoskeleton organization, a function that is also involved in maintaining proper trafficking within the cell, were hypersensitive to many conditions, suggesting a key role for this function in survival and adaptation. A constant (targeted) flux of secretory vesicles, and a balancing flux of endocytic vesicles to recover membrane material are required for cellular remodeling as well as for cell growth (Araujo-Bazan et al., 2008; Higuchi et al., 2009; Kohli et al., 2008; Zonia and Munnik, 2008), also in Saccharomyces (Ayscough, 2005; Moreira et al., 2009; Walther et al., 2006). This appears central for maintenance of cellular homeostasis (Mousley et al., 2008). The high variability of the fitness effects of these mutant groups was not mimicked by a high variability of their transcription. In fact, these groups were among those least variable on the transcriptional level, which suggests that their functions are regulated posttranscriptionally, either by stress-induced regulation of translation (Melamed et al., 2008; Preiss et al., 2003; Shenton et al., 2006; Smirnova et al., 2005), or by posttranslational regulation or metabolic activity of the process (Postmus et al., 2008; Wu et al., 2008). Also, we can conclude that the intracellular transport network, or its role in stress adaptation, is not very robust in response to mutations of its individual components. We conclude that the functional groups in clusters
Perspectives for antifungal drug design
The two-mode clustering analysis revealed strong interactions between types of conditions and cellular functions, exemplified by the specific sensitivity of the functions in cluster
Additionally, we observed that mutations in genes with a function in growth rate regulation lead to increased resistance to most chemical stress conditions. This, too, has implications for drug design, as it suggests that conditions, which reduce growth rate, also reduce drug sensitivity. Indeed, perturbation of nutritional signaling renders yeast more susceptible to azole treatments (Robbins et al., 2009). Growth rate reduction may be caused by previous exposure to a drug or treatment, by recent conditions changes, by lack of nutrients, or generally by nonoptimal conditions. Most drug susceptibility testing is done in rather optimized laboratory conditions. Indeed, drug efficacy in real situations is usually much reduced compared to test situations (Marine et al., 2005; Nett et al., 2008). We propose to evaluate drug efficacy in more realistic settings, mimicking the environment or at least the growth of the fungus in the conditions in which the treatment is going to be applied.
Concluding, we present a simple method that allows for the direct comparison of genome-wide data of various platforms and regulatory levels. The analysis reveals general and specific aspects of yeast adaptation to a changing environment, and provides important insights for the design of anti-fungal treatments.
Footnotes
Acknowledgments
The authors thank Drs. Parsons and Boone for generous sharing of data prior to publication, and Dr. Bussemaker for useful discussions. This research was financially supported by grant APB.5504 from The Netherlands Technology Foundation (STW) (to F.M.K.), and by the BioRange program of The Netherlands Bioinformatics Centre (NBIC), which is supported by The Netherlands Genomics Initiative (NGI) (to J.A.H.).
Author Disclosure Statement
The authors declare that no conflicting financial interests exist.
References
Supplementary Material
Please find the following supplemental material available below.
For Open Access articles published under a Creative Commons License, all supplemental material carries the same license as the article it is associated with.
For non-Open Access articles published, all supplemental material carries a non-exclusive license, and permission requests for re-use of supplemental material or any part of supplemental material shall be sent directly to the copyright owner as specified in the copyright notice associated with the article.
