




Abstract
Abstract
The photosynthetic activity of two Syrian barley (Hordeum vulgare L.) landraces, Arabi Abiad (A. Abiad) and Arabi Aswad (A. Aswad), grown under low- and high- temperature stresses, were studied by analyzing the measured chlorophyll fluorescence signals. Both the applied stresses influenced photosystem II (PSII) activity. However, the effects depend on the stress type and the duration of its application. Phenomenological parameters were shifted shortly after the application of both stresses, whereas fluorescence ratios and yield values were altered most significantly after 7 days of stress imposition. The earliest changes in PSII activity of both cultivars were observed in the case of high temperature treatment. The maximal quantum efficiency of the photosynthetic apparatus (Fv/FM) did not alter after stress application. Therefore, we could not recommend this parameter for early detection of such stress. In contrast, the results from the present investigation strongly indicate that the most significantly changed chlorophyll a fluorescence parameters could be used as an efficient tool for the early diagnosis of temperature stress in barley.
Introduction
Chlorophyll a fluorescence kinetics are an informative and widely used tool for studying the effects of different environmental stresses on photosynthesis (Kalaji and Peiguo, 2008). It is a nondestructive way of measuring photosynthetic activity using user-friendly, computerized portable instruments (Kalaji et al., 2004; Kalaji and Loboda, 2009; Kalaji and Pietkiewicz, 2004). Research techniques based on fluorescence phenomena, in particular, chlorophyll a fluorescence measurements, are very simple, noninvasive, and precise. These measurements are usually carried out using portable devices known as Fluorimeters or Plant Stress Meters, which are the most viable alternative to expensive and bulky gas analyzers (Photosynthesis Measurements Systems) that are traditionally being used by plant scientists (physiologists, ecologists, plant breeders, agronomists, etc.) in the field. Fluorimeters are useful in ecophysiological research, to monitor ecosystems threatened by pollution or any type of stress. They are also being used to determine plants' tolerance to unfavorable climatic conditions (climate change scenario) and to estimate their fertilization requirements.
A number of examples illustrate the effects of short- and long-term exposure to high and low temperatures on plant photosynthetic activity (Harding et al., 1990; Morgan-Kiss et al., 2006; Starck et al., 1994) expressed as chlorophyll a fluorescence parameters (Lazar and Ilik, 1997; Ranney and Ruter, 1997; Yamada et al., 1996). Recently, in addition to chlorophyll a fluorescence signal analyses, the JIP test has been frequently used in experimental plant biology to determine the responses of the photosynthetic apparatus to different stresses. The JIP test is based on the theory of flow of energy in thylakoid membranes, and it contributes to a better understanding of the relationships between the biophysical side of photosynthesis, fluorescence signals, and its analytical expressions (Morgan-Kiss et al., 2006). It offers the possibility to study the equilibrium between the inflow and the outflow of the entire energy for photosynthetic pigments, and it provides relevant information about the probability of the fate of the absorbed energy. Moreover, the JIP test also provides detailed information about the structure and functions of the photosynthetic apparatus (Oukarroum et al., 2007; Strasser et al., 2005).
In the present investigation, an attempt was made to detect the temperature stress at an early stage in barley using chlorophyll a fluorescence signals.
Materials and Methods
Barley seedlings (Hordeum vulgare L.) cvs. Arabi Abiad (A. Abiad) and Arabi Aswad (A. Aswad) (Syrian landraces) were grown in 1-liter glass pots filled with modified Hoagland nutrient solution. During the first week of growth, the average day/night temperature of the greenhouse was maintained at 26/18°C, respectively, relative humidity was set in between 50 and 60%, the photoperiod for the day/night cycle was 16/8 h, respectively, and the maximum photosynthetically active radiation was about 1400 μmol photon m−2 s−1. The 7-day-old seedlings were then exposed to low- and high-temperature stresses. The day and night temperatures of the greenhouse were maintained at 10/6°C and 40/20°C for inducing low- and high-temperature treatments, respectively.
Chlorophyll a fluorescence of the fully expanded leaves was measured after 1 and 7 days of stress application using the Plant Efficiency Analyzer (Handy-PEA fluorimeter, Hansatech Instruments Ltd., Pentney, King's Lynn, Norfolk, England). Measurements were performed on undamaged tissues of attached mature leaves of both stressed and control plants after 45 min of dark adaptation at room temperature. During dark adaptation, all reaction centers were fully oxidized and available for photochemistry and any fluorescence yield was quenched. This process takes a variable amount of time and depends upon plant species, light history prior to the dark transition, and whether or not the plant is stressed. If a sample is dark adapted the PSII electron acceptor pool is gradually reoxidized to a point where all of the PSII reaction centers are capable of undertaking photochemistry. The sample was suddenly illuminated with a high-intensity light source (3,500 μmol photon m−2 s−1), and the rapid polyphasic rise in chlorophyll fluorescence, which is subsequently followed by a slow decline in fluorescence intensity to a steady-state level of fluorescence, was observed (Kautsky Fluorescence Induction). Chlorophyll fluorescence induction transient curves were analyzed and additional parameters were calculated using JIP test based on Biolyzer v.3.0.6 software (developed by Laboratory of Bioenergetics, University of Geneva, Switzerland) (Strasser et al. 1999).
All total 30 measurements were performed on the first, second, and third leaf in each treatment. The results are presented as mean values±standard errors (Table 1). Statistical significance between mean values was assessed by analysis of variance and a conventional Duncan's Multiple Range Test (DMRT), with Statistica 5.0 statistical software. A probability of p<0.05 was considered significant.
Data are presented as mean±SE. Means followed by a common superscript letter in a column are not significantly different at the 5% level by Duncan's Multiple Range Test.
The JIP test parameters calculated with Biolyzer v.3.0.6 software from the chlorophyll a fluorescence signals were as follows:
1. ABS/CS
o
—absorption flux per cross-section (CS) at t=0, approximated by Fo, 2. ABS/RC—light absorption flux (for PSII antenna chlorophylls) per reaction center (RC), 3. Area—the area above the chlorophyll fluorescence curve between Fo and FM (reflecting the size of the plastoquinone pool) 4. DI
o
/CS
o
—dissipated energy flux per cross-section (CS) at t=0, 5. DI
o
/RC—dissipation energy flux per PSII reaction center (RC), 6. ET
o
/CS
o
—electron transport flux per cross-section (CS) at t=0, 7. ET
o
/RC—maximum electron transport flux (further than QA−) per PSII reaction center (RC), 8. Fv/Fo—a value that is proportional to the activity of the water-splitting complex on the donor side of the PSII, 9. kN—nonphotochemical deexcitation rate constant in excited antennae of the energy fluxes for nonphotochemistry, 10. kP—photochemical deexcitation rate constant in excited antennae of the energy fluxes for photochemistry, 11. N—the number indicating how many times QA is reduced while fluorescence reaches its maximal value (number of QA redox turnovers until FM is reached) 12. OJIP transient—transient fluorescence induction defined by the names of its intermediate steps (O is for “origin” and “P” is for peak, whereas, J and I are intermediate steps), 13. PIABS—the performance index that is calculated as: (RC/ABS)×[φ
Po
/(1−φ
Po
)]×[ ψ
o
/(1−ψ
o
)], where RC is for reaction center; ABS is for absorption flux; φ
Po
is for maximal quantum yield for primary photochemistry; and ψ
o
is for the quantum yield for electron transport 14. QA—primary quinone acceptor of photosystem II, 15. RC/ABS—density RCs per chlorophyll, 16. SFIABS—indicator of PSII structure and functioning, 17. SM—normalized area above the OJIP curve [=(Area)/Fv], represents energy necessary for the closure of all reaction centers 18. TFM—time needed for reaching FM, 19. TR
o
/CS
o
—trapped energy flux per cross-section (CS) at t=0, 20. TR
o
/RC—trapped (maximum) energy flux (leading to QA reduction) per reaction center (RC), 21. φ
Do
—thermal dissipation yield, 22. φ
Eo
—electron transport yield, 23. φ
o
/(1−φ
o
)—conformation term for primary photochemistry, 24. φ
Po
—maximal quantum yield of primary photochemistry, 25. ψ
o
– exciton transfer efficiency to the electron transport chain, 26. ψ
o
/(1−ψ
o
)—the conformation term for thermal reactions (nonlight-dependent reactions).
Results
Under low-temperature stress (1 and 7 days of treatments), both the cultivars (A. Aswad and A. Abiad) exhibited nonsignificant changes (compared to the control seedlings) in the ABS/RC ratio, which is dependent on the ratio of active to nonactive reaction centers (Table 1). In contrast, the high-temperature stress had profound effects on the effective antenna size of active reaction centers. Compared to the control, the ABS/RC ratio increased significantly (approximately two- to fourfold) in both the cultivars irrespective of treatment period (except for A. Aswad at 1 day after stress application) (Table 1). Maximum increase (approximately fourfold) was recorded at 7 days of high-temperature stress in case of A. Aswad (Table 1).
An identical trend was observed in case of the kN parameter, which did not change significantly in either of the studied cultivars grown under low temperature (Table 1), whereas during high-temperature stress (1 and 7 days after stress treatment), the value of this parameter increased significantly (approximately twofold) in cultivar A. Abiad. In the case of A. Aswad seedlings, the kN value increased (∼1.5-fold over the control plants) only after 7 days of high-temperature treatment (Table 1).
The φ Do parameter also exhibited an exactly identical trend (Table 1). There were no significant deviations in either cultivars under low temperature stress. Under high temperature, this value increased ∼2.5 to 3.5-fold (over control seedlings) with the exception of cultivar A. Aswad exposed to high-temperature stress for 1 day.
The DI o /RC ratio increased many fold (1.5- to 14-fold) in both the cultivars subjected to low- and high-temperature stresses, except in A. Aswad seedlings after 1 day of stress application (Table 1).
After 1 day of low-temperature stress, most of the studied fluorescence parameters of cultivar A. Abiad were lower than those of plants grown under optimal temperature, excluding RC/ABS, φ Po and TR o /RC, whose values were almost the same as those determined in control plants (Fig. 1A). The Performance Index PIABS showed the lowest value (about 40%) of all parameters measured in the study.
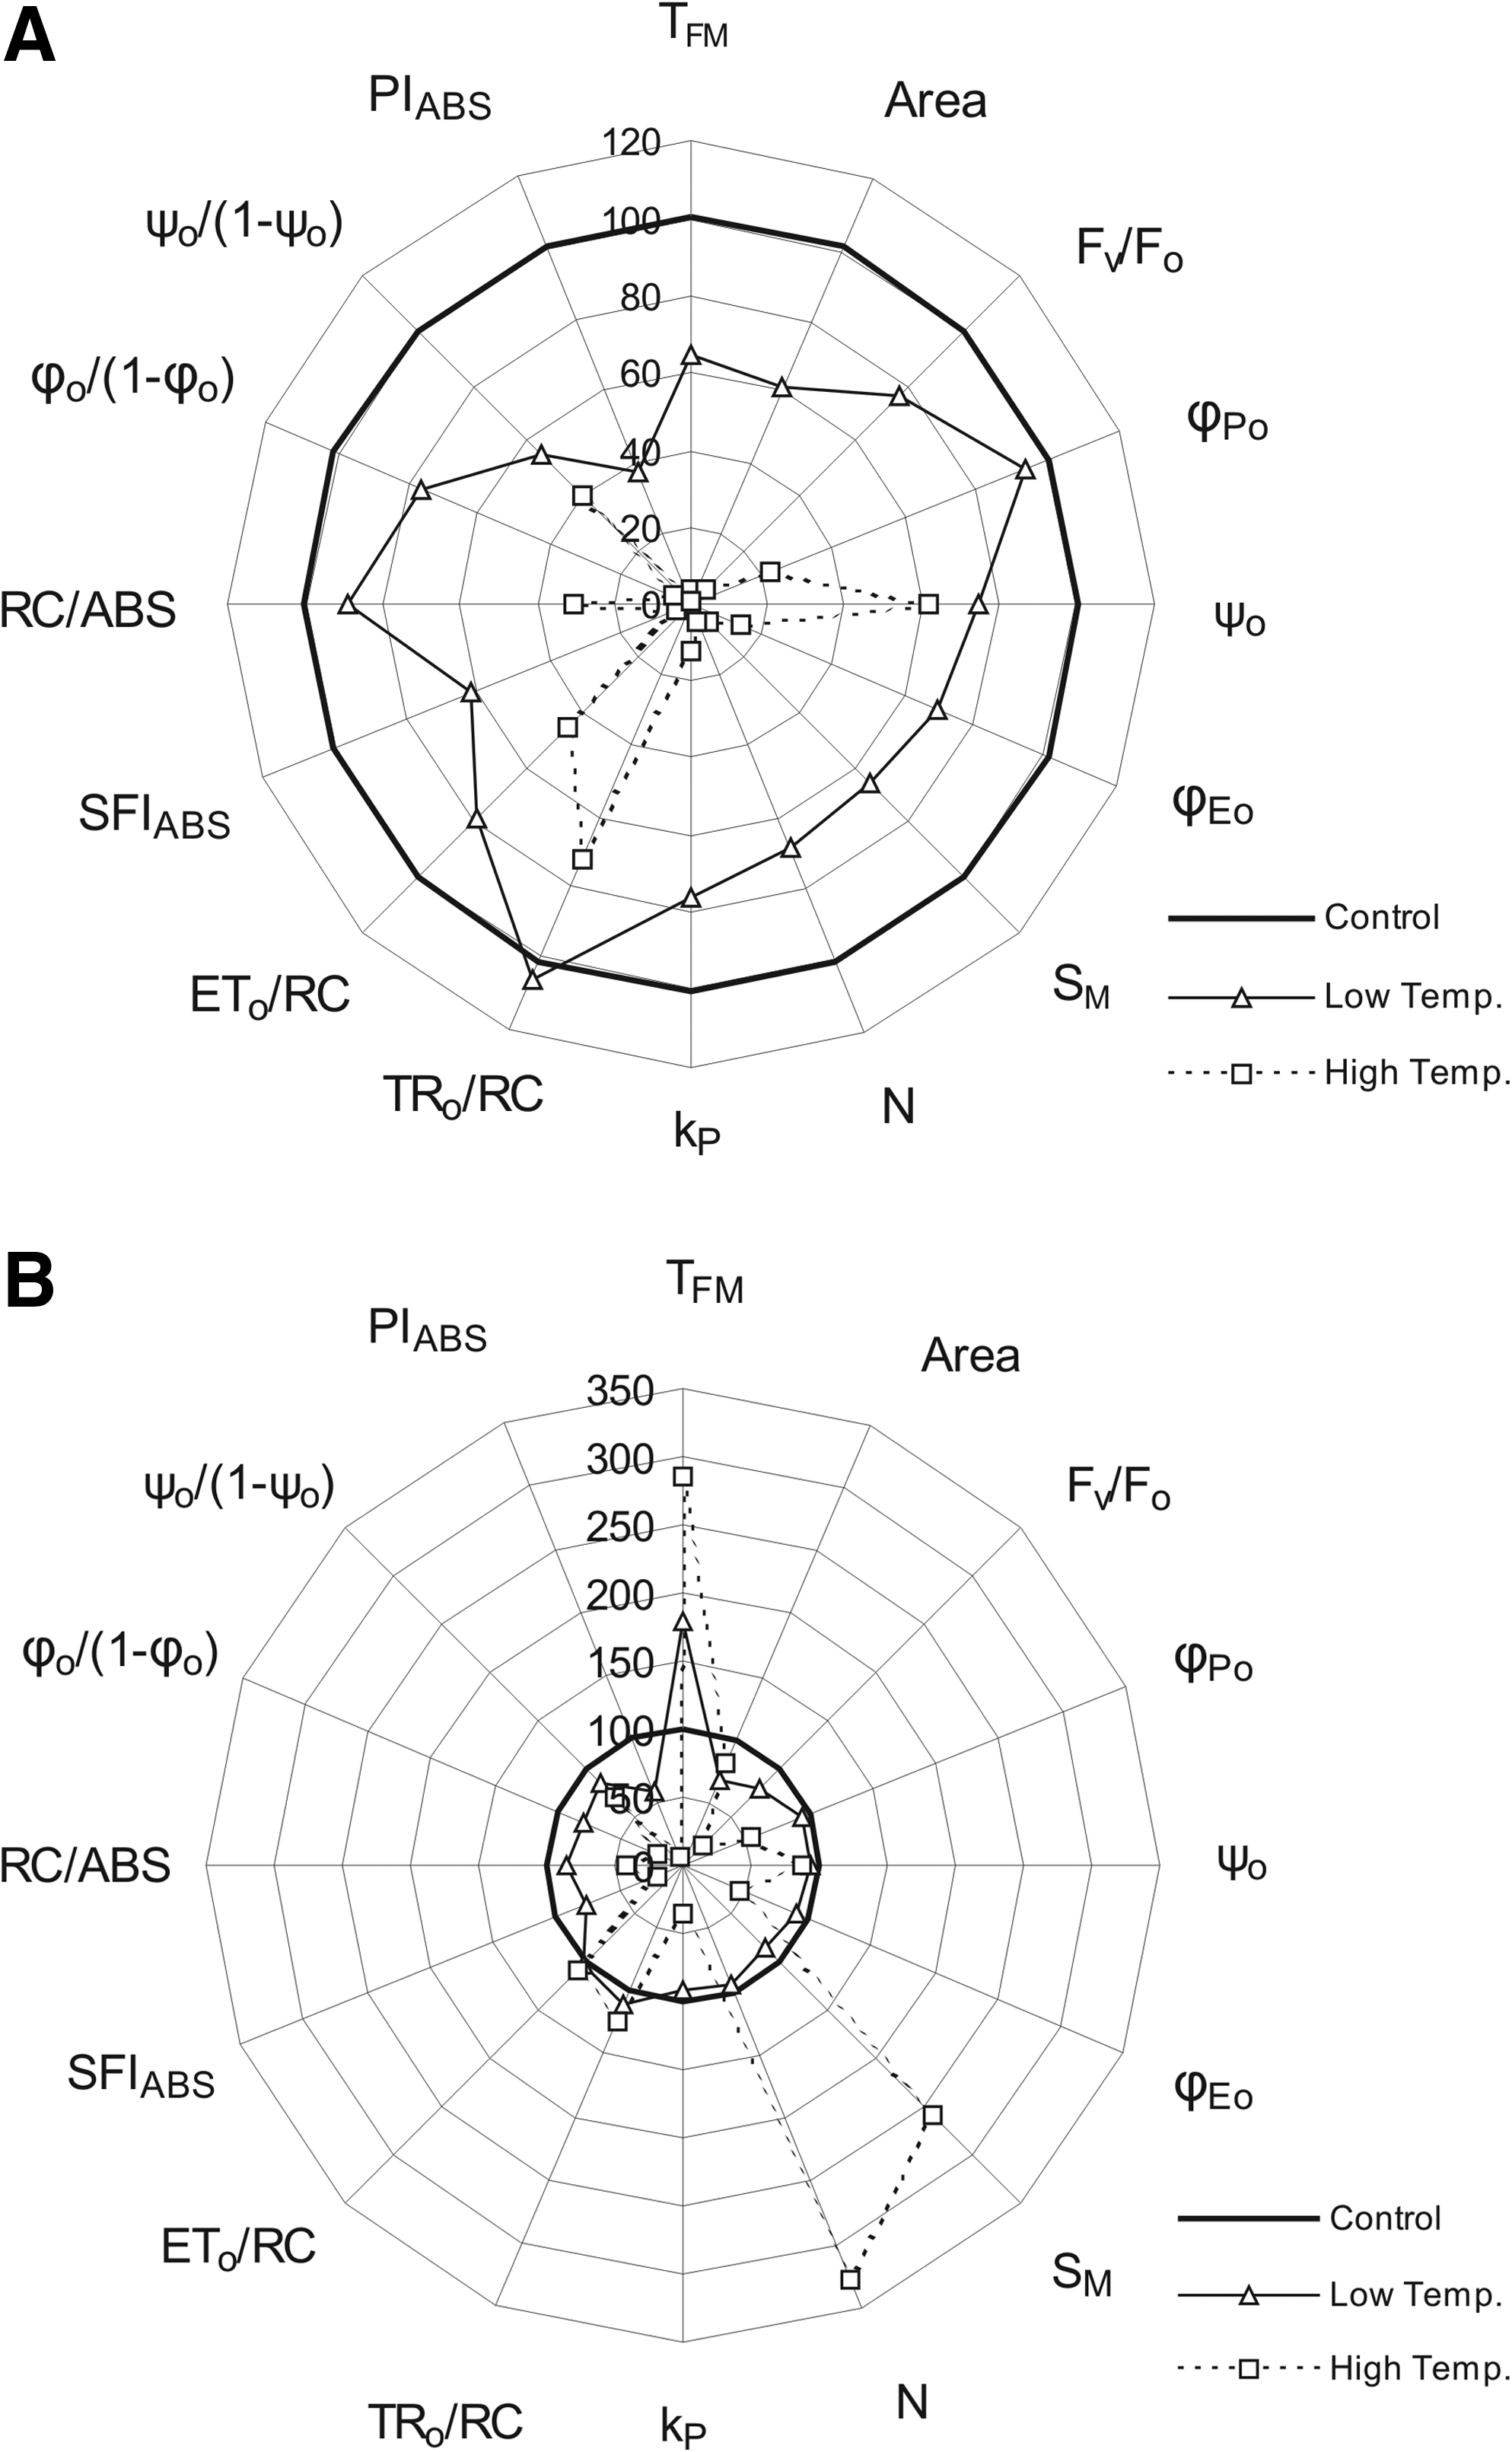
Radar plot of chosen calculated chlorophyll a fluorescence parameters of cv. A. Abiad after 1 day (
Under high-temperature stress, all analyzed fluorescence parameters of cultivar A. Abiad were lower than those of plants grown under optimal temperature (Fig. 1A). Only ψ o and TR o /RC exceeded 60% of the respective values in control plants.
In cultivar A. Abiad plants grown under low temperature for 7 days only, TFM was substantially higher than in control plants. The values of the other parameters were the same or slightly lower as in control plants (Fig. 1B).
After 7 days of growing under high-temperature stress, the values of TFM, SM, and N were much higher in cultivar A. Abiad than in control plants. On the other hand, the values of many other parameters, including Fv/Fo, φ Po , φ Eo , kP, SFIABS, RC/ABS, φ o /(1−φ o ) and PIABS, were much lower in A. Abiad plants under high temperature grown for 7 days than in control plants (Fig. 1B).
After 1-day exposure of high- and low-temperature stress, the values of most of the studied fluorescence parameters of cultivar A. Aswad were very similar to those of plants grown under optimal temperature. Only the ψ o /(1−ψ o ) and PIABS values in A. Aswad plants grown under low temperature were lower (80%) and higher (60%), respectively, in comparison with control plants (Fig. 2A).
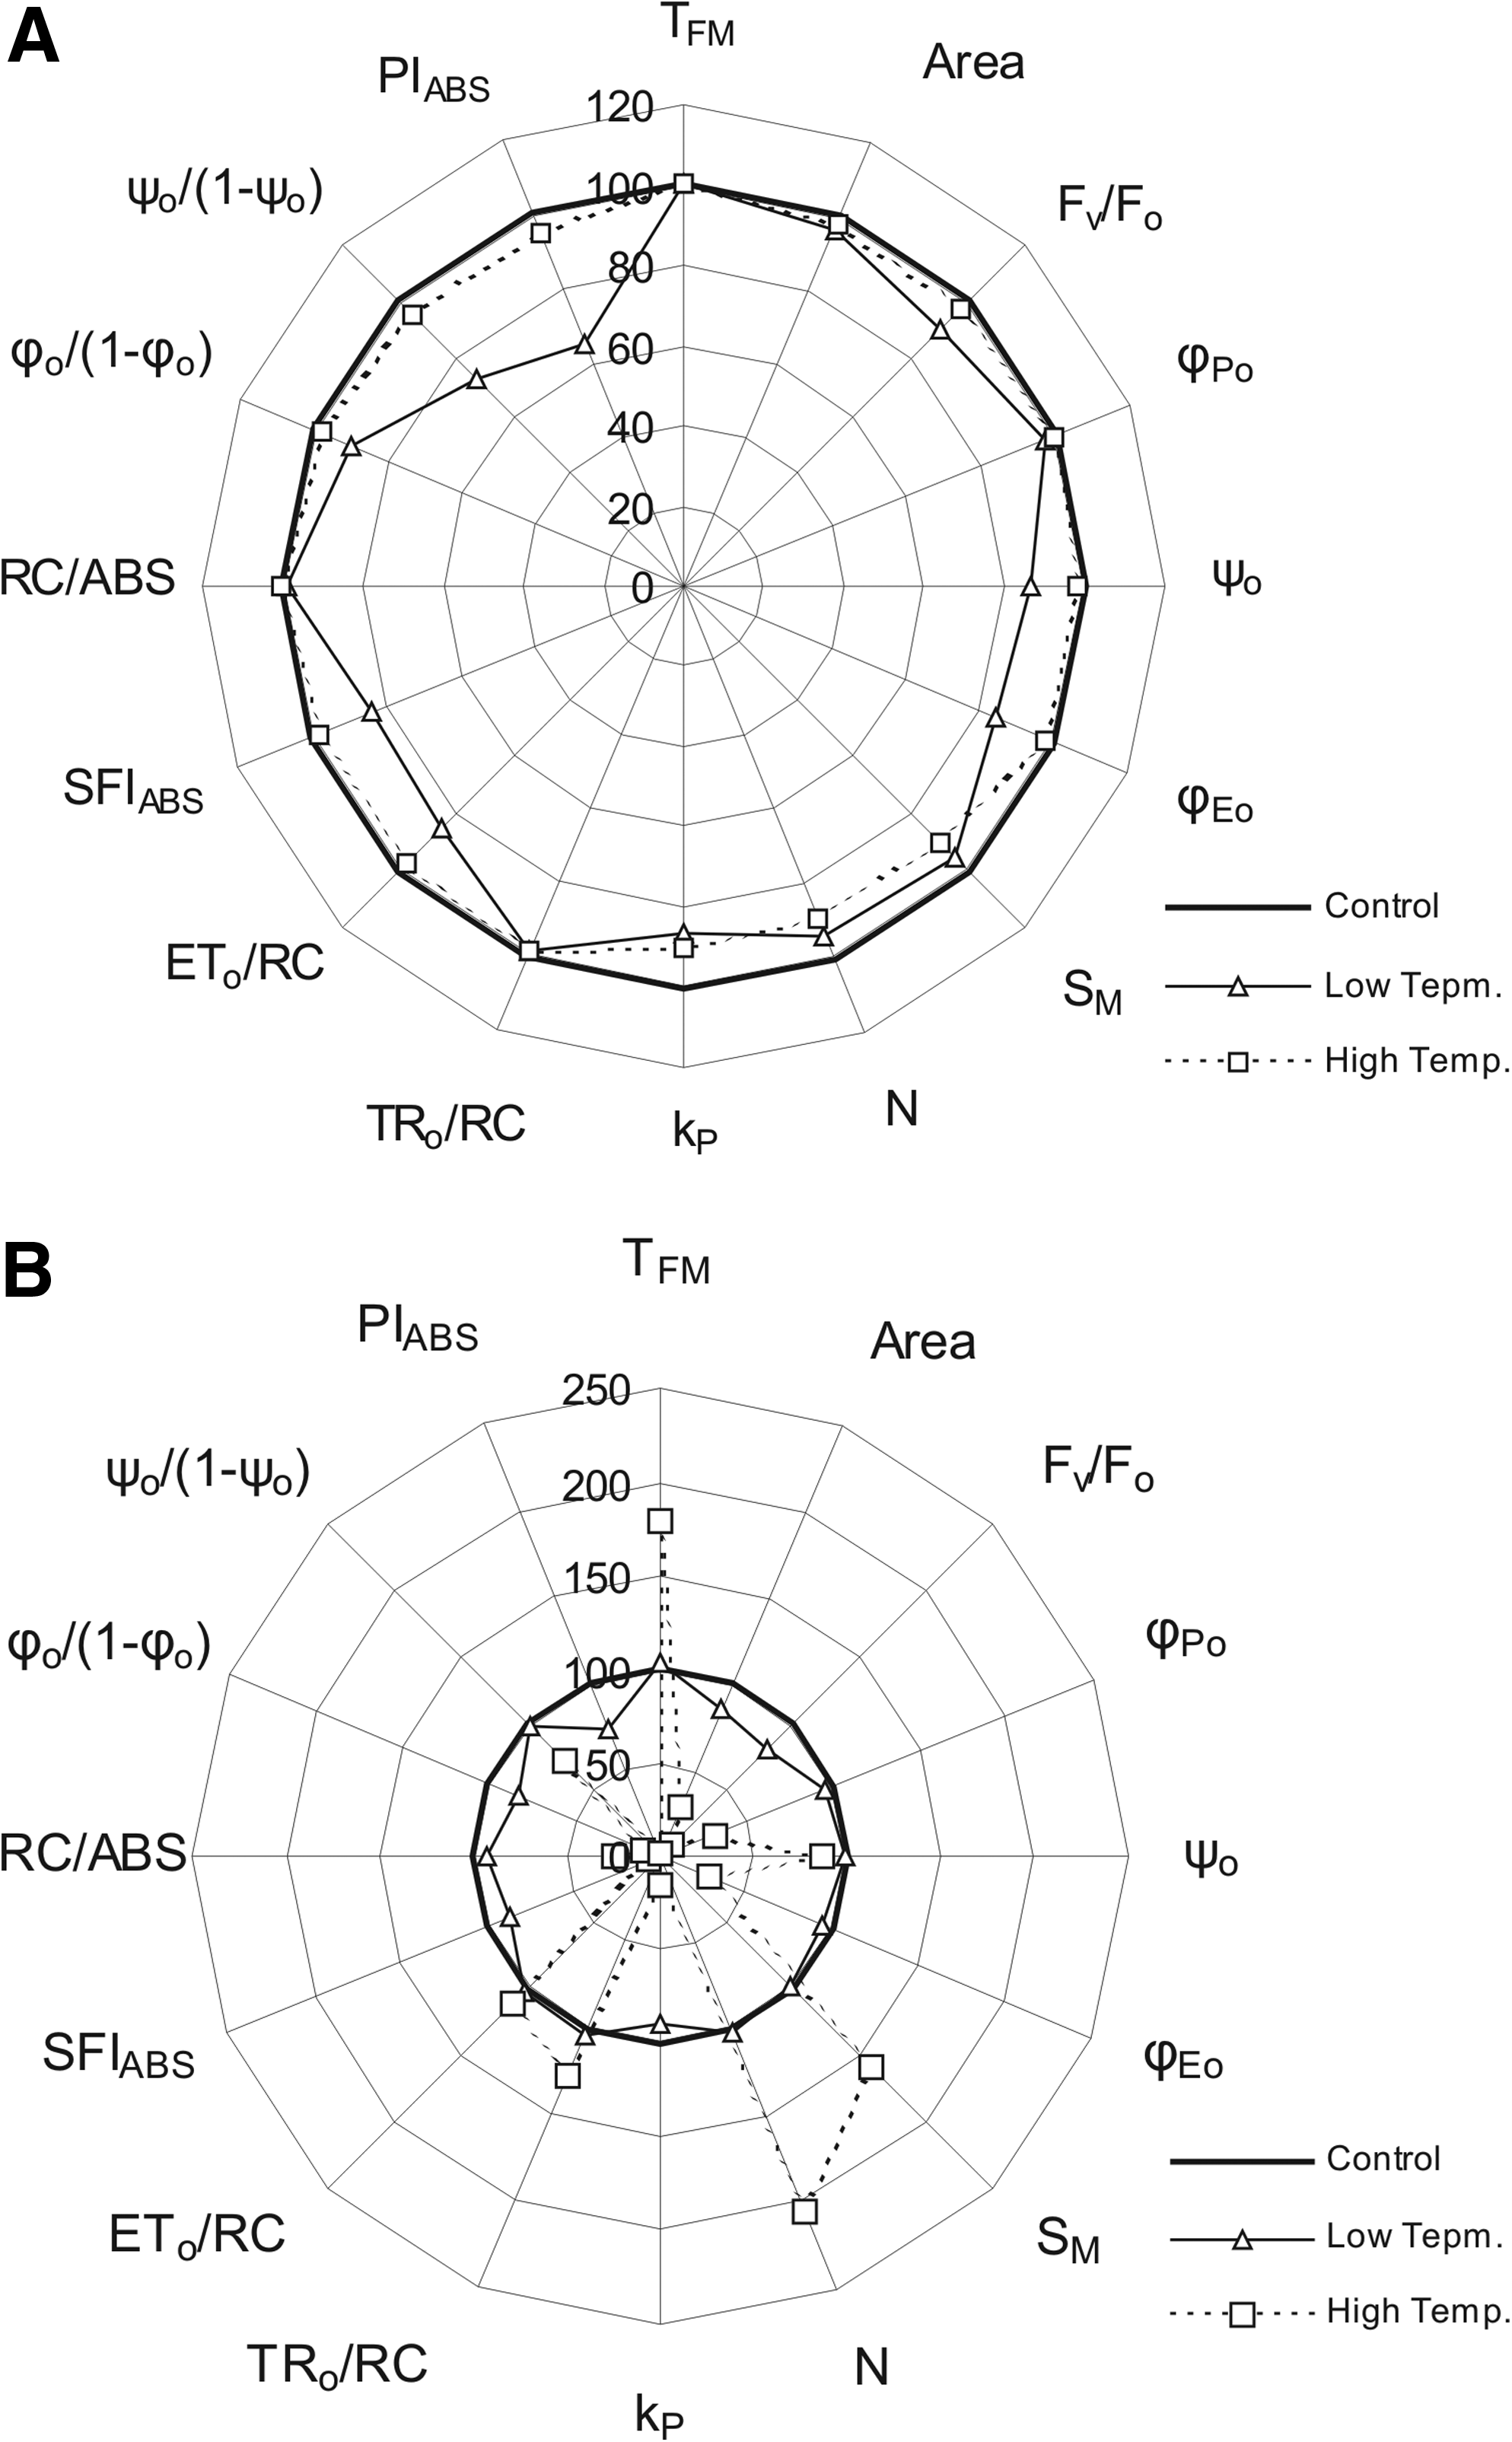
Radar plot of chosen calculated chlorophyll a fluorescence parameters of cv. A. Aswad after 1 day (
All studied parameters of barley cultivar A. Aswad grown under low-temperature stress for 7 days, shown in Figure 2B, were almost the same or slightly lower than the respective parameters determined in control plants.
After 7 days of high-temperature stress, only TFM, SM, TR o /RC, and N values were higher in cultivar A. Aswad than in control plants (Fig. 2B). On the other hand, the values of parameters such as Area, Fv/Fo, φ Po , φ Eo , kP, SFIABS, RC/ABS, and φ o /(1−φ o ) were much lower in cultivar A. Aswad exposed to high temperature for 7 days than in control plants (Fig. 2B).
After 1 day of low-temperature treatment, the transient fluorescence curves of both cultivars were almost the same as those of control plants (data not shown). But, after 1 day of high-temperature stress, the transient fluorescence curve for cultivar A. Abiad was flat without clear OJIP phases, whereas the transient curve for A. Aswad was similar to those obtained for control plants (data not shown).
The transient fluorescence curves of both cultivars grown under low temperature for 7 days resembled those of control plants except for the last phases, which were lower than in control plants (Fig. 3). The transient fluorescence curves of both cultivars grown under high temperature for 7 days, changed dramatically compared to that of control plants; the first phases were much higher and the last phases were much lower than in control plants, the curves were almost flat (Fig. 3) and resembled the transient fluorescence curve of A. Abiad, grown under high temperature for 1 day (data not shown).

Transient chlorophyll a fluorescence induction curves of two Syrian landraces (cvs. Arabi Abiad and Arabi Aswad) grown under low- and high-temperature stresses for 7 days.
After 1 day of growth under low temperature, the calculated phenomenological energy flux parameters, that is, ABS/CS o , TR o /CS o , ET o /CS o , and DI o /CS o , for both cultivars were similar to those determined in control plants, except for the value of DI o /CS o in cultivar A. Abiad, which was slightly higher than in control plants (Fig. 4). On the other hand, under high-temperature stress (1 day after treatment), the analyzed parameters of phenomenological energy fluxes changed significantly in cultivar A. Abiad; ABS/CS o , DI o /CS o and the number of silent reaction centers increased, whereas TR o /CS o and ET o /CS o decreased considerably. On the contrary, the above parameters did not vary significantly in cultivar A. Aswad (Fig. 4).
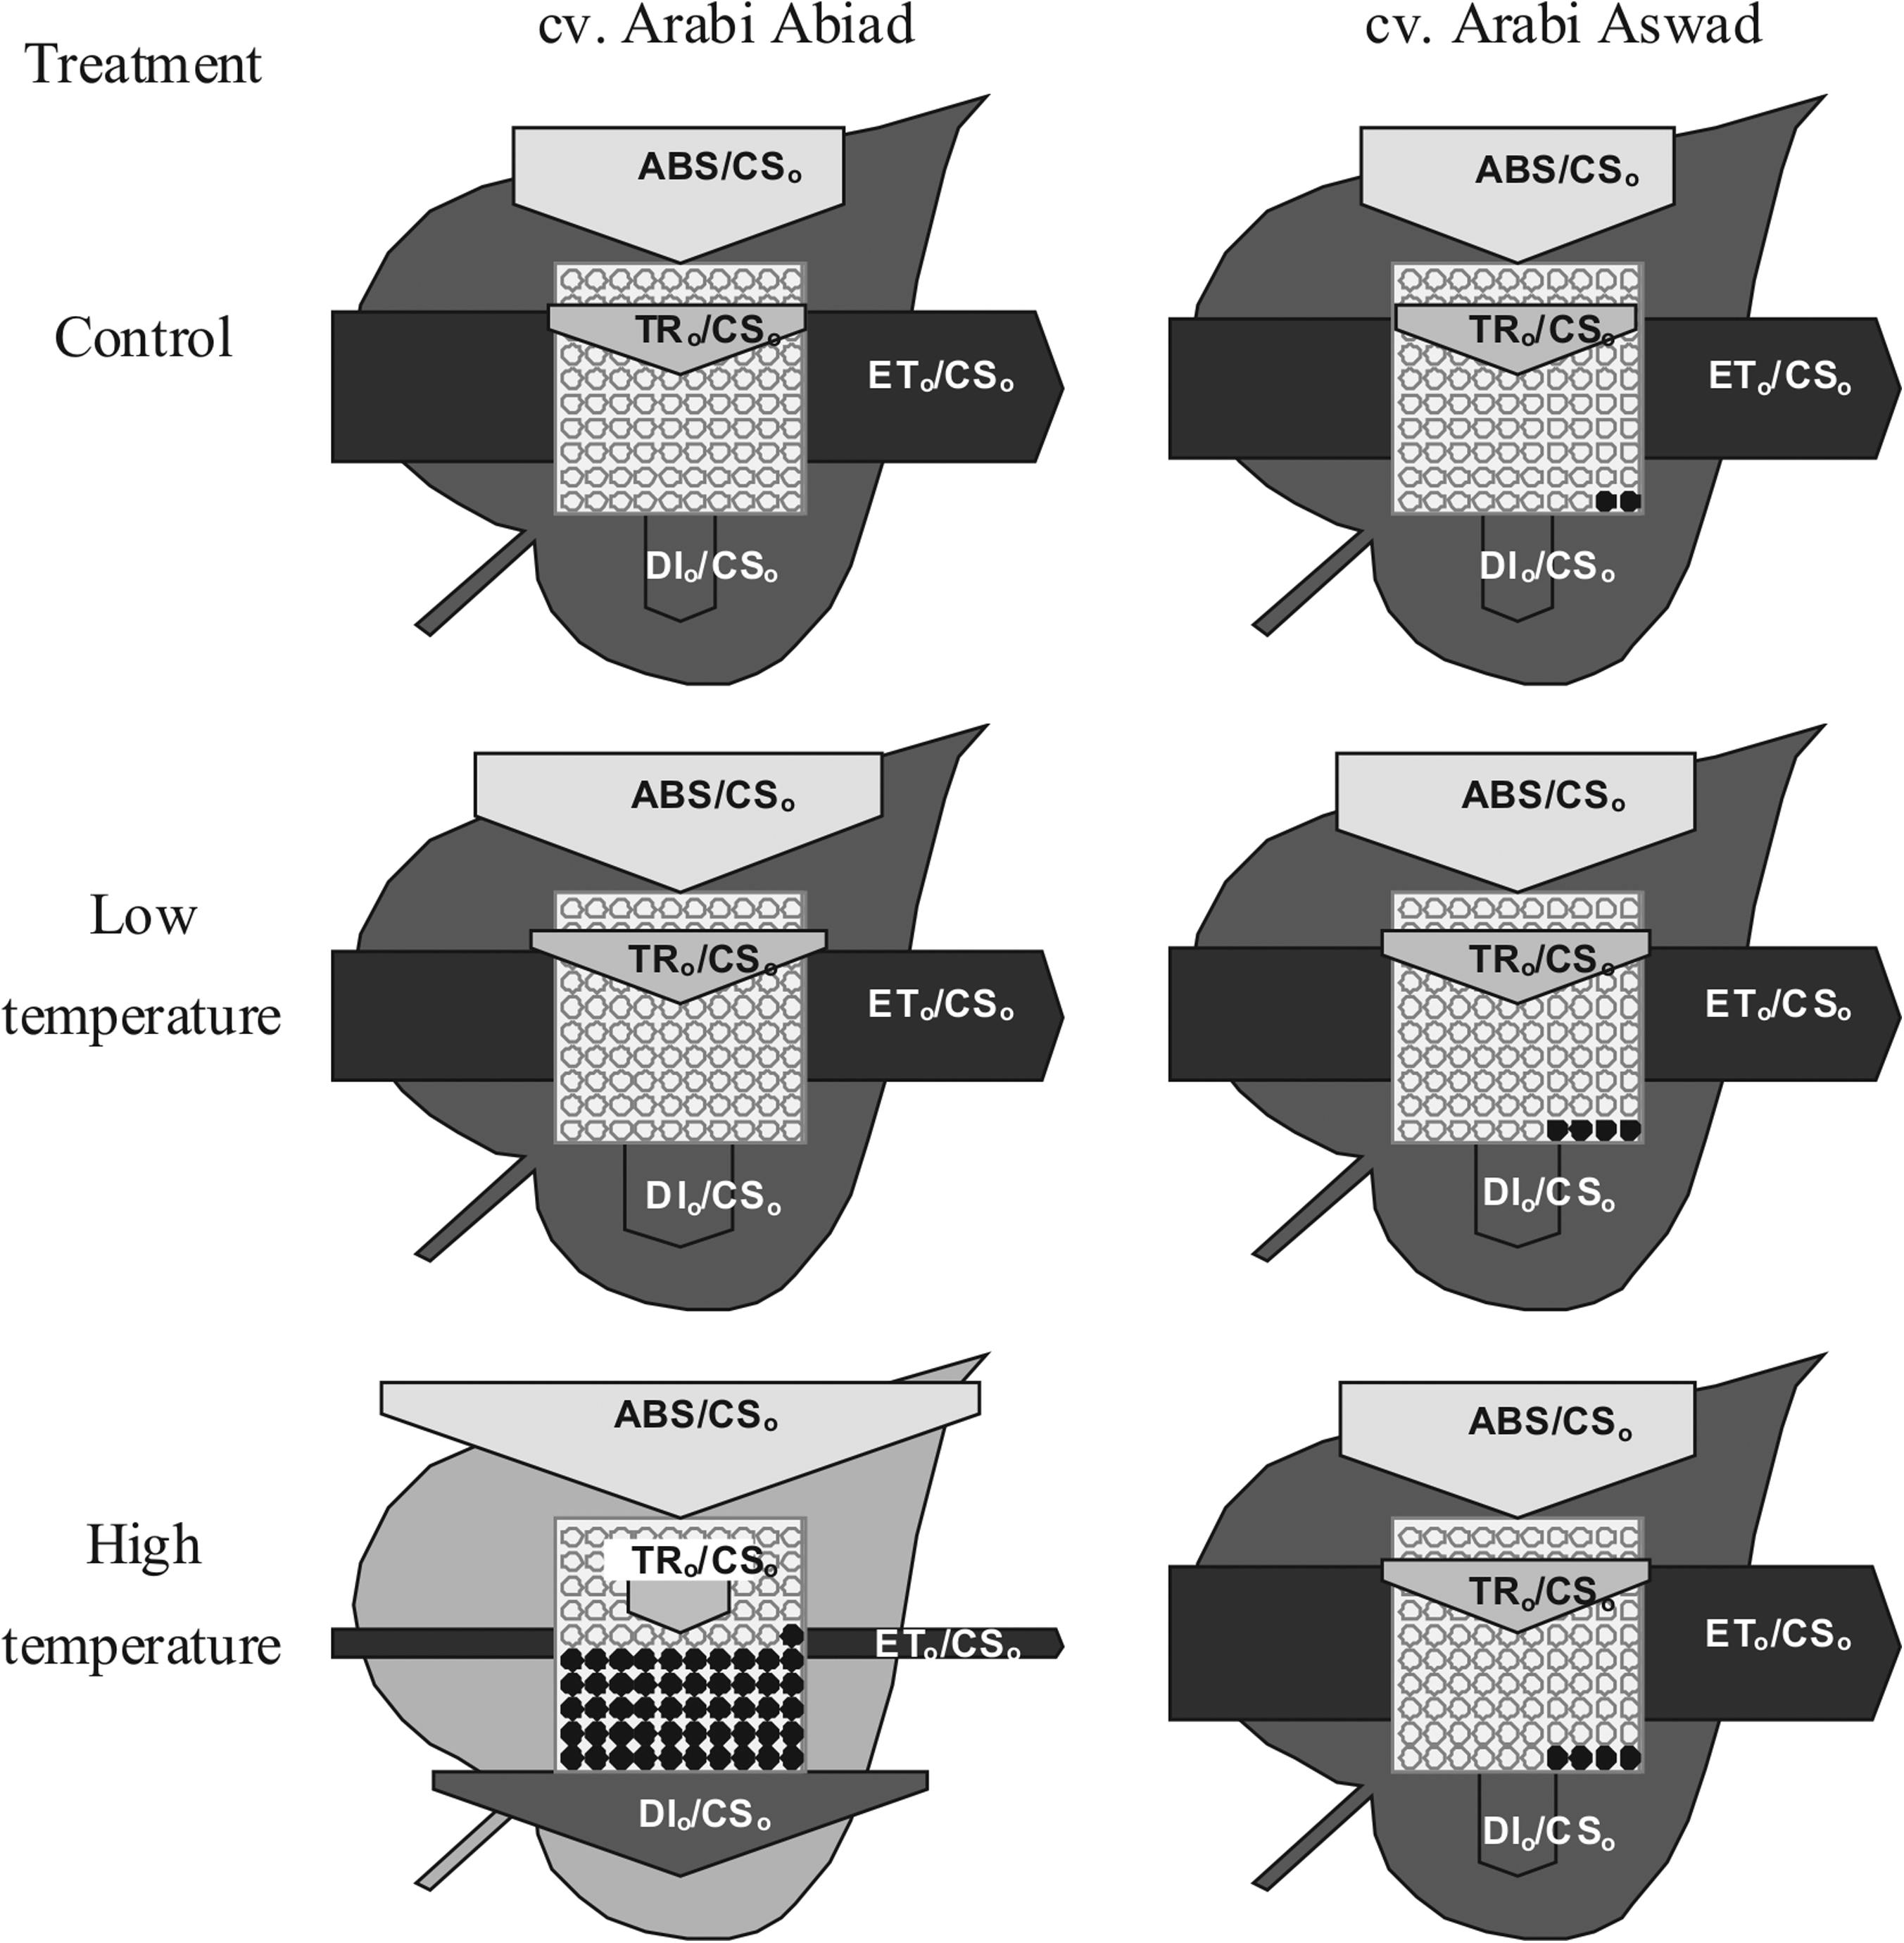
Leaf model showing phenomenological energy fluxes per excited cross section (CS) of barley cvs. Arabi Abiad and Arabi Aswad grown without stress (control) and after 1 day of low- and high-temperature treatment. ABS/CSo, absorption flux per CS approximated by Fo; TRo/CSo, trapped energy flux per CS; ETo/CSo, electron transport flux per CS; DIo/CSo, dissipated energy flux per CS. Each relative value is represented by the size of proper parameters (arrow), empty circles represent reducing QA reaction centers (active), full black circles—nonreducing QA reaction centers (inactive or silent). Color intensity of leaves is proportional to its chlorophyll content calculated by Biolyzer software.
Under prolonged low-temperature treatment (7 days), both studied cultivars exhibited similar phenomenological energy fluxes as control plants (Fig. 5), while under high temperature, experimental plants had higher values of ABS/CSo, DI o /CS o and the number of silent reaction centers and lower values of TR o /CS o and ET o /CS o (Fig. 5). However, these changes were more noticeable in cultivar A. Aswad.
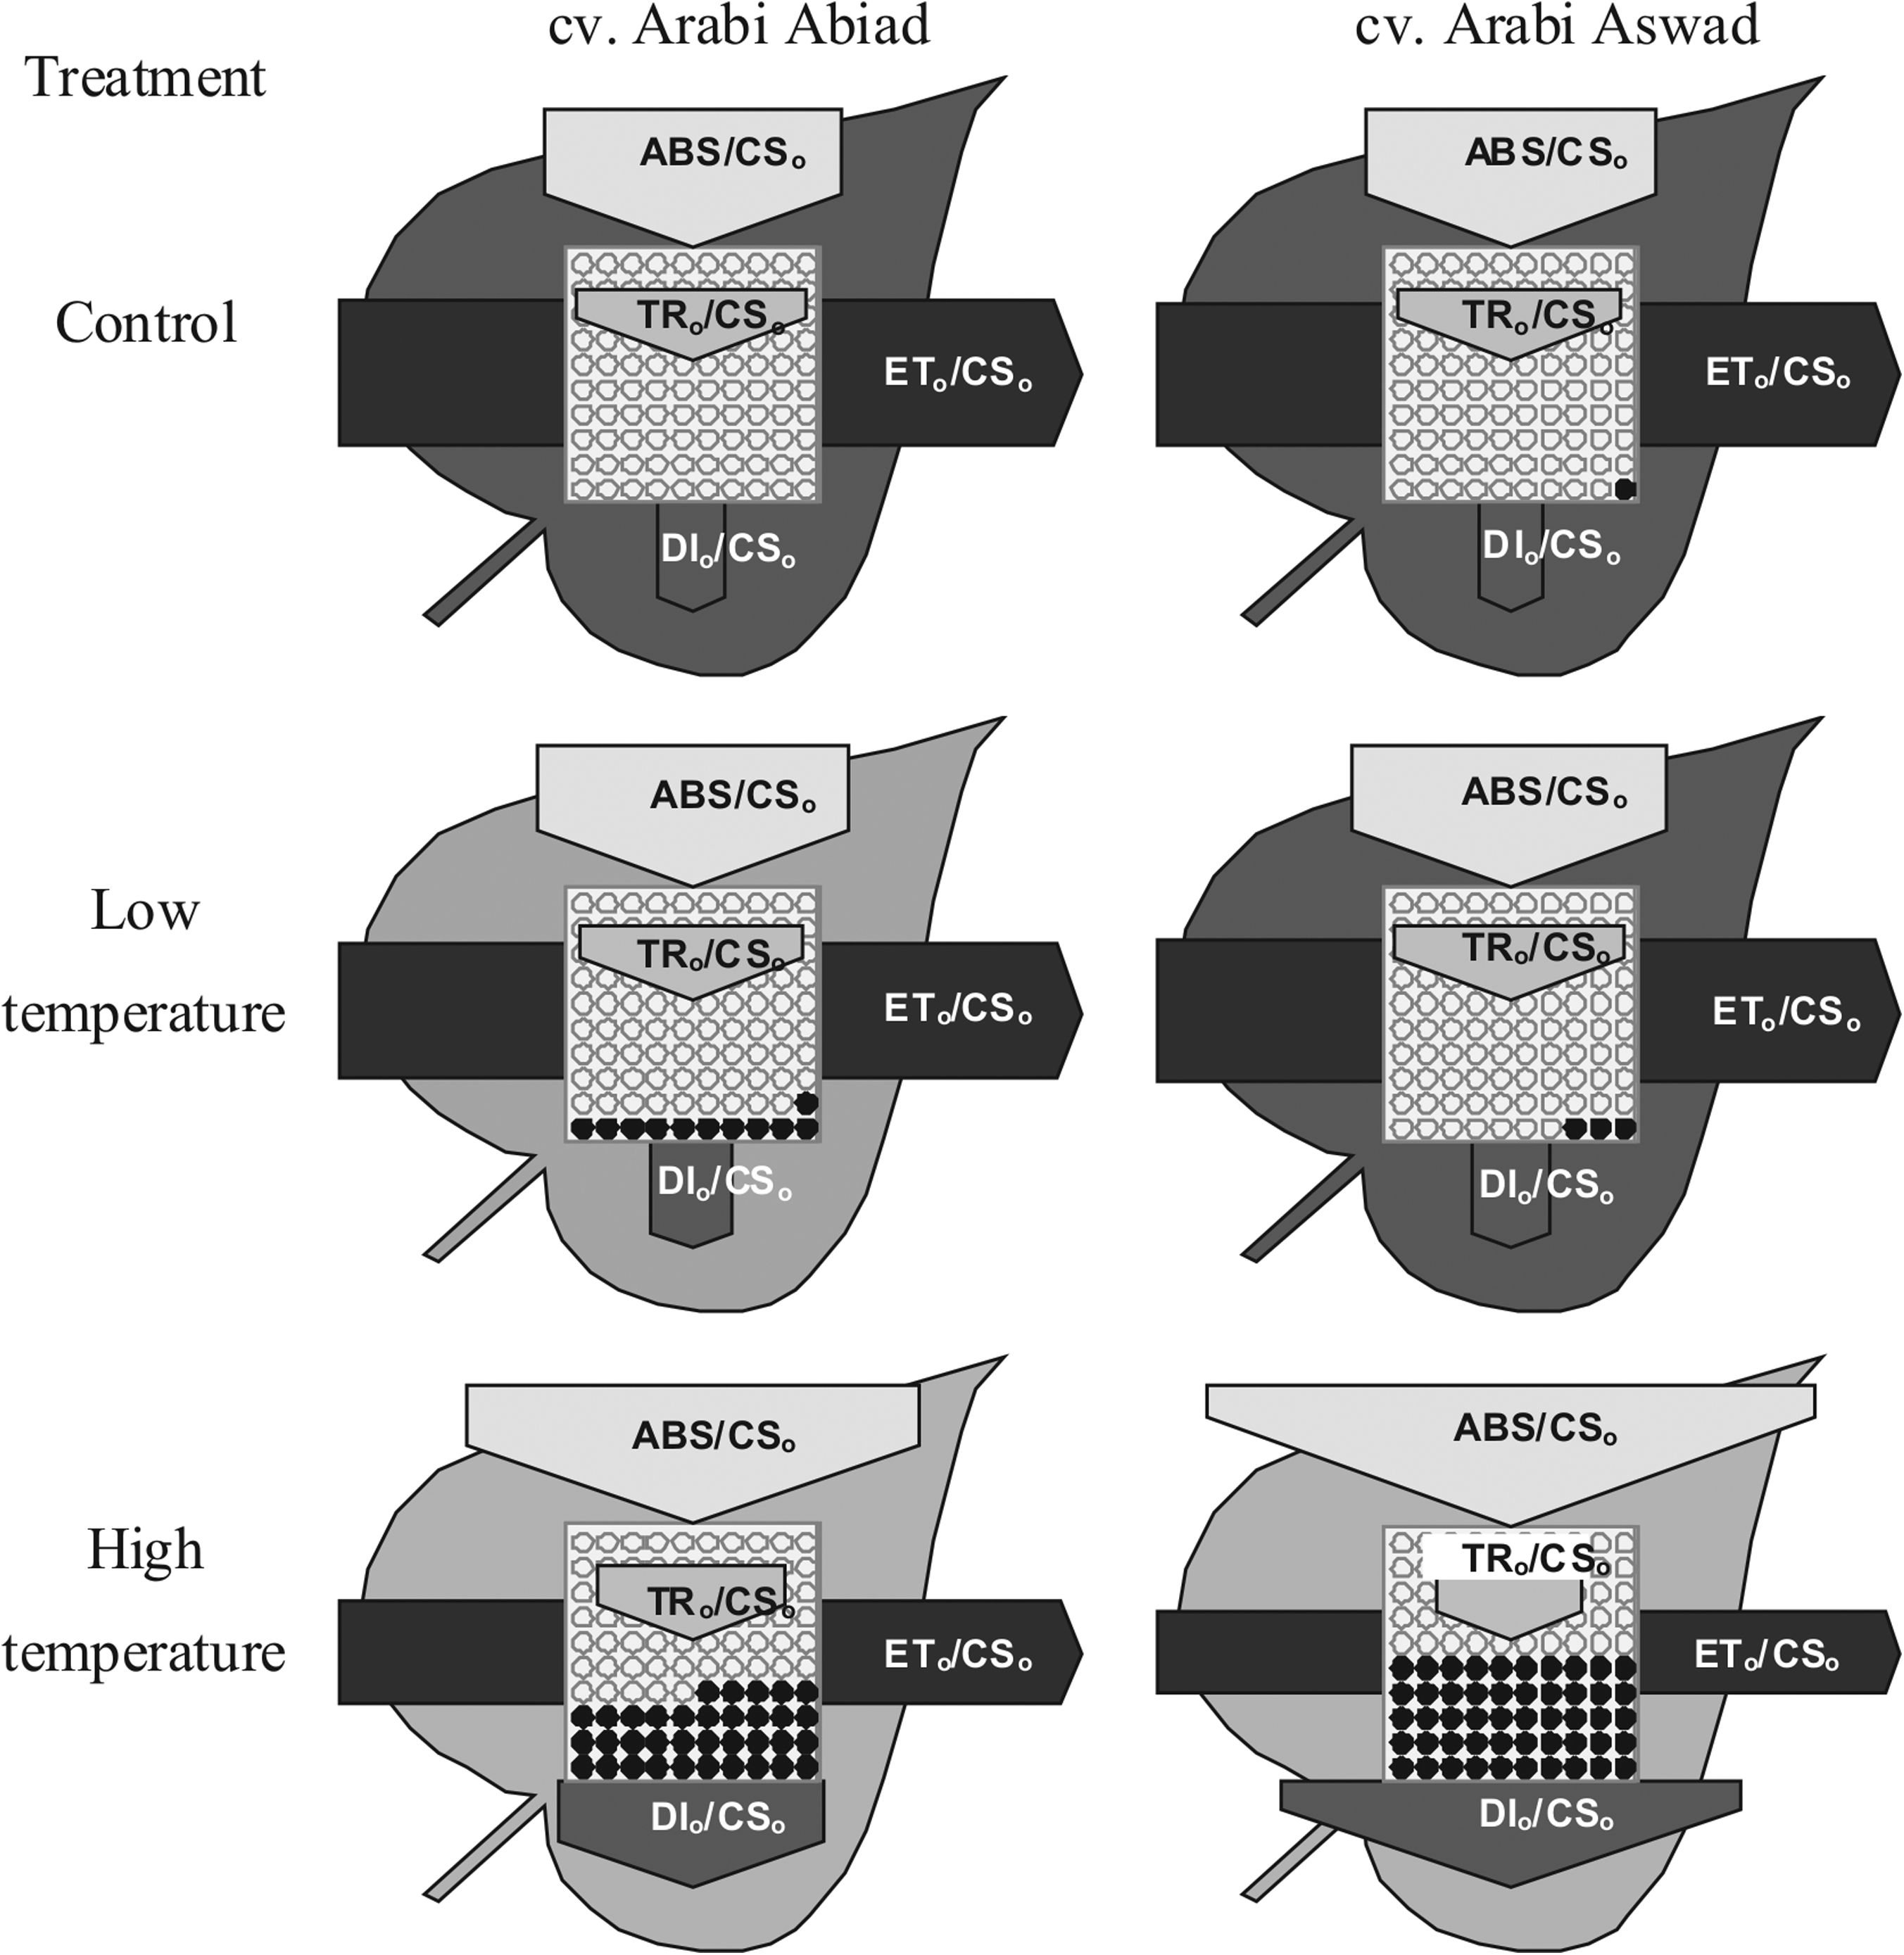
Leaf model showing phenomenological energy fluxes per excited cross section (CS) of barley cvs. Arabi Abiad and Arabi Aswad grown without stress (control) and after 7 days of low- and high-temperature treatment. ABS/CSo, absorption flux per CS approximated by Fo; TRo/CSo, trapped energy flux per CS; ETo/CSo, electron transport flux per CS; DIo/CSo, dissipated energy flux per CS. Each relative value is represented by the size of proper parameters (arrow), empty circles represent reducing QA reaction centers (active), full black circles—nonreducing QA reaction centers (inactive or silent). Color intensity of leaves is proportional to its chlorophyll content calculated by Biolyzer software.
In the present finding, no clear visual differences among cultivars were observed at low temperature even at day 7 (figures not shown). But interestingly, under high temperature, change in leaf color (yellowing of leaf, mostly affecting the first leaf of the seedlings) was noticed by naked eyes in both the cultivars after 7 days of stress treatment (Fig. 6).

Comparative performance of two Syrian barley landraces (cvs. Arabi Abiad and Arabi Aswad) under high temperature stress (7-day treatment).
Discussion
Low temperature stress has a negative effect on the photosynthetic apparatus (Öuist et al., 1987). It also inhibits sucrose synthesis, which leads to restriction of phosphate recycling and photophosphorylation (Labate and Leegood, 1988). This, in turn, lowers the ADP/ATP ratio, causing the reduction of photosynthetic electron transport (Savitch et al., 1997), which also increases the probability of photoinhibition (Godde and Bornman, 2004).
The barley cultivar A. Aswad showed higher tolerance to low temperature than the cultivar A. Abiad after 1 day, which suggests that cultivar A. Aswad is able to keep its photosynthetic capacity at high level when grown at lower temperatures and/or during the winter (Adams et al., 2001). This reaction could involve better regulation of thermal energy dissipation, for example, stimulation of the xanthophyll cycle (Demmig-Adams et al., 1996) and increment of PsbS protein content (Li et al., 2000). This might be involved in the inhibition of the generation of reactive oxygen species, that is, superoxide (suppressed by diminished water splitting) and singlet excited oxygen (suppressed by thermal energy dissipation in the PSII antennae) in the investigated cultivars after 1 day of growth under low temperature. Another reason for the better tolerance to low temperature of barley cultivar A. Aswad could be an adaptation mechanism, which is related to the maintenance of membrane fluidity at low temperatures (Morgan-Kiss et al., 2006). In the present study it was reflected in the values of most of the measured parameters, which were similar to those noted in control plants (Fig. 2A).
After 7 days of low temperature stress, cultivar A. Abiad showed higher values of TFM which is an alternative way of determining the size of the nonreduced plastoquinone pool (Lichtenthaler et al., 2004), and both cultivars exhibited low values of the performance index, which indicates that they are relatively sensitive to this kind of stress applied over a prolonged period of time (Figs. 1B and 2B). This was confirmed by an analysis of the transient fluorescence curves (Fig. 3), which revealed lower values of FM (point P on the OJIP curve).
The leaf model after 1 day (Fig. 4) and 7 days (Fig. 5) showed that low-temperature treatment significantly affected the energy flux, trapping, and electron transport ratios. However, the previously described increase in the TFM value noted in cultivar A. Abiad suggests that this cultivar is less tolerant to low-temperature stress than A. Aswad, as indicated by the prolonged time needed to reach a full reduction state of the primary electron acceptors and the significant reduction of PSII performance (P.I. values).
The tested cultivars showed suppression of the fluorescence rise under high temperature stress (Figs. 1–5). This could result from damage to the thylakoid component at a high temperature, leading to a decrease in PSII activity (Harding et al., 1990; Weng and Lai, 2005) and/or originates from chlorophyll a molecules released due to denaturation of chlorophyll-containing protein complexes and the released chlorophyll a dissolving in the lipids of thylakoid membranes leading to the formation of low-fluorescing aggregates (Ilık et al., 2003).
The TFM value of cultivar A. Aswad did not change, but it dramatically decreased in A. Abiad seedlings grown under high temperature for 1 day. After 7 days, TFM was higher in both the tested cultivars compared to control plants. TFM value was higher in cultivar A. Abiad than in A. Aswad, thus indicating that energy transfer from reaction centers to quinones was blocked under stress conditions (Reigosa and Weiss, 2001). A similar situation was observed with respect to low temperature stress, which suggests that cultivar A. Abiad is probably more sensitive to high temperature than A. Aswad, in particular, at the beginning of stress application. Apart from changes in TFM, also the values of the parameters SM—representing energy necessary for the closure of all reaction centers, and N—denoting how many times QA is reduced while fluorescence is being reached were higher after 7 days of exposure to high-temperature stress. The above values were similar in both barley cultivars. This suggests that plants exposed to this type of stress respond by prolonging the time needed to reach a full reduction state.
When plants were treated with high temperature (Fig. 3), we were not able to detect the K-step on the chlorophyll fluorescence curve, which is suggested to be as an indicator of heat-damaged oxygen-evolving complexes (Strasser et al., 2005). Under heat treatment a dramatic increase in membrane permeability, damage to PSII units, and a loss of oxygen evolving activity due to the destruction of the manganese cluster are usually observed, but PSII units are still able to perform limited electron transport (presence of the K-step). The increased permeability of thylakoid membranes involves not only peroxidative damage to the membranes, but also conformational changes in membrane proteins, the opening of ion channels, changes in lipid–lipid interactions, redistribution of specific lipids within thylakoid membranes (Havaux et al., 1996; Santarius, 1980) and the formation of nonbilayer phases (Gounaris et al., 1984; Kota et al., 2002). Moreover, changes in the K-step could be a result of imbalance between the donation rate of PSII and the reoxidation rate of QA− as TyrZ can donate one electron to P680+, but a second charge separation after electron transfer from QA to QB would lead either to an accumulation of P680+ or to fast charge recombination (Strasser, 1997).
High ABS/CS o (Fo) ratio observed in both barley cultivars grown under high temperature could result from the dissociation of LHCII from the reaction center complexes (Schreiber and Armond, 1978; Yamane et al., 1997), LHCII trimmer monomerization (Garab et al., 2002; Takeuchi and Thornber, 1994), dark reduction of QA which is related to a heat-induced shift of the redox equilibrium between QA and QB (Ducruet and Lemoine, 1985; Havaux, 1989) and facilitation of the back flow of electrons from the plastoquinone pool (Sazanov et al., 1998; Yamane et al., 2000).
The area above the chlorophyll fluorescence transient rise curve is a very useful parameter that shows all changes in Fo and FM that are not taken into account while comparing only the amplitude of changes, the extreme values of Fo and FM or their ratio (Fv). The pool of reduced electron acceptors in PSII (mostly QA) of both cultivars at both times of measurement of chlorophyll a fluorescence when seedlings were grown under low or high temperature, except for cultivar A. Aswad grown under both temperature stresses for 1 day (Figs. 1A and B and 3) was smaller compared to plants grown without stress. That was due to blocking of the transport of electrons from reaction centers to the pool of plastoquinones (Hansatech Instruments, 2000; Schreiber et al., 1989). A significant decrease in FM was also observed (Fig. 3), probably as a result of heat inactivation of the oxygen-evolving complex (Schreiber and Neubauer, 1987).
The maximum quantum yield of PSII (Fv/FM) is the quantitative efficiency of the quantum yield at all open centers of PSII and changes in Fv/FM are due to changes in the efficiency of nonphotochemical quenching (Maxwell and Johnson, 2000). It is frequently used as a comfortable and reliable indicator of the photosynthetic activity of plants. Its value oscillates around 0.83 in the majority of plants grown under stress-free conditions (Angelini et al., 2000; Björkman and Demmig, 1987). In our experiment, seedlings of cultivar A. Abiad grown under high temperature for 1 day and plants of both cultivars grown under both extreme temperatures for 7 days had significantly lower Fv/FM (φ Po ) values, in comparison with control plants, which is indicative of damage to PSII reaction centers (Figs. 1 and 2). Lower efficiency of water splitting and oxygen evolution from PSII (Fv/Fo) in both cultivars and at both times of measurement (Figs. 1 and 2), was also lower than that in control plants (Murkowski, 2002).
Our results show that the PIABS parameter was most affected by different types of stress treatments, including temperature stress (Table 1). The performance index was introduced by Strasser et al. (1999), Srivastava et al. (1999), and Tsimilli-Michael et al. (2000). It is defined as the product of expressions of the [pi/(1−pi)] form, where pi (
The relatively higher sensitivity of barley cultivar A. Abiad to high temperature, compared with A. Aswad, was clearly demonstrated by changes in the investigated fluorescence parameters, including changes in the time course of transient fluorescence curves noted after 1 day and 7 days, as well as changes in phenomenological energy fluxes after plant growing under high temperature conditions for 1 day.
Conclusions
We conclude that high-temperature stress negatively influenced the PSII activity of barley seedlings of both cultivars, which were found to be relatively tolerant of low temperature. This confirms the adaptation of these landraces to low temperature during the first growth stage at the homeland and explains why it has been cultivated for more than 3,000 years and preferred by local farmers.
Our experiment enabled to select the parameters of chlorophyll a fluorescence that showed changes to the highest degree under specific temperature stresses. It seems that phenomenological parameters (energy absorption, trapping, and electron transport) are directly shifted shortly after the application of temperature stress (1 day), whereas the effects of this stress become visible after 7 days, when the greatest changes in fluorescence ratios and yield values are observed. The earliest effects of stress exposure on PSII activity were reported in the case of high-temperature treatment.
The maximal efficiency of PSII (φ Po =Fv/FM) changed following the damage of PSII structure, that is, after 7 days of stress application; therefore, this parameter could not be recommended for early detection of plant stress responses.
It is always been a vital and advanced information for a plant manager to know the fact that the plants are suffering from stress before actual appearance of visible stress symptoms. In such crucial time, protective measures could be taken to save the plants or, in particular, could prevent the yield loss. In the present study, no apparent visual differences among cultivars were observed at low temperature even after 7 days of stress (figures not shown). However, in the case of high-temperature treatment, change in leaf color (yellowing of leaf, mostly affecting the first leaf) was noticed by the naked eye in both the cultivars at day 7 after stress application (Fig. 6). More clear stress symptoms at the whole plant level would gradually appear in the next few days. The change in chlorophyll a fluorescence parameter is one the first reactions of plants' photosynthetic apparatus toward any fluctuations in plant growth environment/stress, and thus, it expresses the actual physiological state of the plant much ahead of any other parameters (e.g., enzymatic, morphological, or anatomical features) start to express stress symptoms. In the present investigation, A. Aswad, seems to be more temperature stress-tolerant than the cultivar A. Abiad, as it (A. Aswad) did not show significant changes in its photosynthetic efficiency soon after stress application (1 day). Only long-term stress application could bring some changes or damage in its photosynthetic apparatus. That is the sole reason of recommending chlorophyll a fluorescence as a useful tool for the early detection of temperature stress in barley.
Footnotes
Acknowledgments
We thank Mr. Richard D. Poole (Marketing Manager, Hansatech Instruments Limited) for his technical support.
Author Disclosure Statement
The authors declare that no conflicting financial interests exist.