
Abstract
Abstract
Several approaches exist for the quantification of proteins in complex samples processed by liquid chromatography-mass spectrometry followed by fragmentation analysis (MS2). One of these approaches is label-free MS2-based quantification, which takes advantage of the information computed from MS2 spectrum observations to estimate the abundance of a protein in a sample. As a first step in this approach, fragmentation spectra are typically matched to the peptides that generated them by a search algorithm. Because different search algorithms identify overlapping but non-identical sets of peptides, here we investigate whether these differences in peptide identification have an impact on the quantification of the proteins in the sample. We therefore evaluated the effect of using different search algorithms by examining the reproducibility of protein quantification in technical repeat measurements of the same sample. From our results, it is clear that a search engine effect does exist for MS2-based label-free protein quantification methods. As a general conclusion, it is recommended to address the overall possibility of search engine-induced bias in the protein quantification results of label-free MS2-based methods by performing the analysis with two or more distinct search engines.
Introduction
A widely accepted and conservative requirement for a protein to be observed in a complex sample is that at least two different peptide sequences need to be identified by the search algorithm that match this protein uniquely (Bradshaw et al., 2006; Carr et al., 2004; Omenn et al., 2005). As such, each observed protein is associated with two or more peptide sequences, each of which can be identified from one or more MS2 spectra. MS2-based label-free methods then exploit the information computed from these spectrum identifications to estimate the abundance of the protein in the sample in a reproducible fashion. These methods provide a highly efficient approach for quantification, since they can be directly applied to the data acquired for identification purposes. Alternative approaches, on the other hand, including label-free MS1-based approaches and methods employing different types of labeled peptides, require substantially more experimental and computational effort to obtain protein quantification (Vaudel et al., 2010).
Here we evaluated the effect of using different search algorithms on the quantification of proteins observed in a complex sample by examining the reproducibility of the protein quantification in technical repeat measurements of the same sample. We investigated both the differences between search engines in protein quantification in one measurement, as well as the effect of the search engine on the reproducibility of quantification across repeated measurements.
Various algorithms have been proposed to perform MS2-based label-free quantification that all rely on different aspects of the MS2 spectra, including the number of spectra acquired per peptide, the number of peptides identified per protein, and the fragmentation intensity patterns in each spectrum (Colaert et al., 2011a). We examined the search algorithm effect on three representative MS2-based label-free quantification methods: the Normalized Spectral Abundance Factor (NSAF; Paoletti et al., 2006), the Exponentially Modified Protein Abundance Index (emPAI; Ishihama et al. 2005), and the normalized Spectral Index (SIn; Griffin et al. 2010). The first method is based on spectrum counting, the second on peptide counting, and the third exploits both spectrum counting information as well as information contained in the intensities of the fragment ion peaks in the MS2 spectra.
Materials and Methods
The three algorithms studied here are spectral counting implemented as the NSAF, peptide counting implemented as the emPAI, and the SIn. All of these methods estimate protein abundances from the MS2 spectra of the corresponding identified peptide sequences. Only peptide sequences that match a protein uniquely are used for computing the abundance estimations.
NSAF counts the MS2 spectra identified per protein by the search algorithm. This count is then normalized for protein length and sample abundance. The protein abundance index (PAI) calculates the number of different observed modified peptides divided by the number of observable peptides for a protein as a measure of abundance. For the observed peptides we counted different modified versions of the same peptide, but counted the same peptide sequence observed with different charge states only once. An observable peptide is here defined as a tryptic peptide (no missed cleavages) with a mass that falls in the range of all the peptides identified in this study. We did not filter the observable peptides based on predicted retention time. This PAI value is then exponentially modified (10PAI–1) to derive the emPAI score. The protein abundance is subsequently calculated after normalizing the emPAI score for a protein by dividing it by the sum of the emPAI scores for all identified proteins. Finally, SIn calculates a spectral index by taking the sum of the matched b and y fragment ion intensities across all spectra identified by the search algorithm for the protein. Fragment ion peaks were searched with an error tolerance for MS2 peak detection equal to 0.5 Da. When more than one peak is found in this error-defined interval, then the highest peak is selected. This spectral index is then first divided by the sum of all protein spectral indexes, and subsequently divided by the length of the protein to correct for protein size, yielding a protein abundance value. All quantifications are handled in their log2 normalized form.
These three methods were applied to a well-characterized, publicly-available data set downloaded from the Tranche data-sharing website (https://proteomecommons.org/tranche/examples/nci-cptac/). The data set originates from the National Cancer Institute (NCI)-funded Clinical Proteomic Technology Assessment for Cancer (CPTAC) group. This consortium set up a study in which different labs analyzed the same sample to test inter-laboratory comparability. For this analysis, we selected the CPTAC sample consisting of yeast digests (60 ng/mL) spiked in with 6.7 fmol/mL of the equimolar mixture of 48 human proteins (Sigma UPS-1), which was processed in triplicate on an LTQ-OrbiTrap mass spectrometer (Rudnick et al. 2010). MS2 files were created using the DTA supercharger program (Mortensen et al. 2010).
These MS2 files were analyzed by Mascot (version 2.3.01), X!Tandem (version TORNADO [2010.01.01]), and OMSSA (version 2.1.9). The protein database consisted of the yeast subset of the UniprotKB/Swiss-Prot protein database (version 15.14), supplemented with the 48 protein sequences of the UPS-1 mixture. The proteins were virtually digested with the trypsin enzyme with one missed cleavage allowed. Precursor mass tolerance was set to 10 ppm and fragment ion mass tolerance to 0.5 Da. Only doubly- and triply-charged tryptic peptides with at most one missed cleavage were considered for identification. Variable modifications were set to: acetylation of the N-terminus, oxidation of methionine, pyro-glutamate formation for N-terminal Gln, carbamidomethyl cysteine formation, and pyro-carbamidomethyl cysteine formation for N-terminal cysteine. No fixed modifications were set. These settings were the same for Mascot, X!Tandem, and OMSSA. For Mascot we used a local installation, while X!Tandem and OMSSA were applied using the searchGUI tool (Vaudel et al., 2011), with default values for all other user-defined search parameters. Peptide identifications were obtained at 1% false discovery rate (FDR), calculated using a shuffled version of the target protein database. The selection was made by loading the result files of each of the search engines into our in-house peptideShaker (http://code.google.com/p/peptide-shaker/) tool and exporting the peptide lists, which include only rank 1 peptide identifications that satisfy the 1% FDR threshold. Proteins were considered identified by a search algorithm when at least two unique peptides from this protein were identified by the search algorithm.
Results
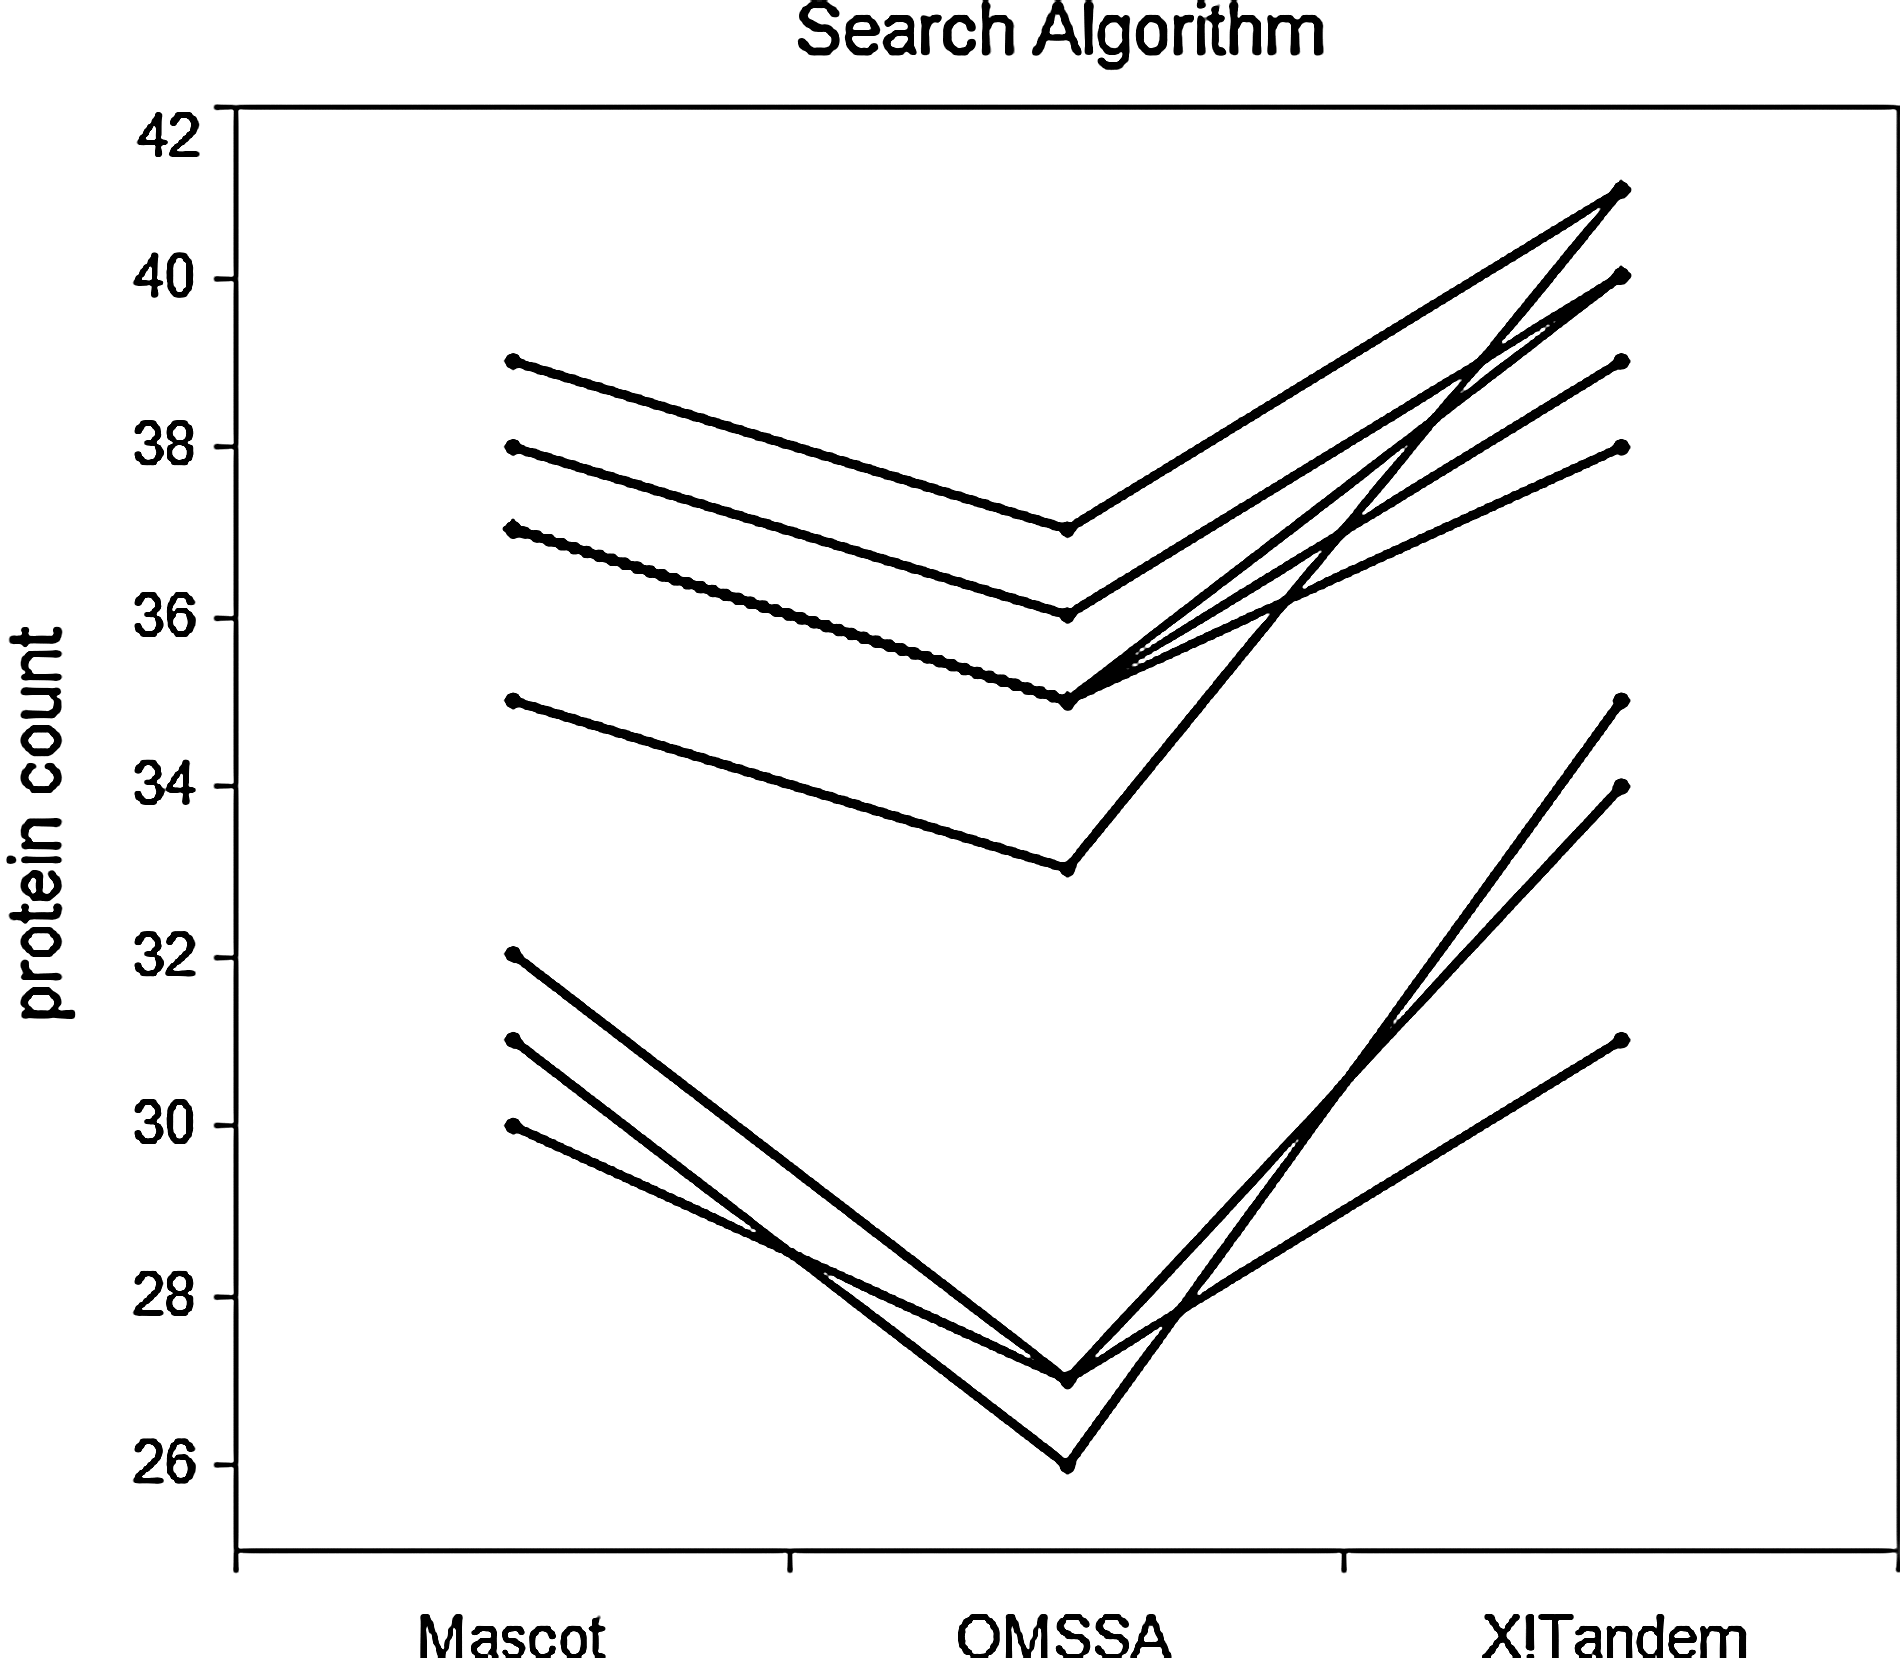
Figure 1 shows the number of proteins identified by each of the search algorithms in each of the samples, connected by a line. As reported in other studies, a significant difference in peptide/protein identification sensitivity is observed for the different search algorithms (Balgley et al., 2007; Kapp et al., 2005). We will therefore evaluate the impact of this search algorithm effect on label-free MS2-based quantification of proteins observed by the search algorithms under consideration using NSAF, emPAI, and SIn.

Number of proteins observed by each of the search algorithms in each of the samples. A protein is observed in a sample if at least two (potentially modified) peptide sequences that uniquely match the protein are identified.
Effect on protein quantification in a single repeat
We evaluated the search algorithm effect by comparing protein quantifications computed by different search algorithms on the same, single repeat. In this experimental setting the same LC-MS and the MS2 data are thus provided to each search engine and downstream quantification algorithm. For each combination of two search algorithms we considered the intersection of all proteins quantified by both algorithms and looked for a search algorithm effect by computing the Wilcoxon signed-rank test between the two protein quantification distributions, paired by protein. A p value ≤0.01 indicates a significant search algorithm effect (the two distributions are not sampled from the same underlying distribution). For NSAF and emPAI we observed that all search algorithm comparisons showed a p value <<0.01. For SIn, 11 out of 27 comparisons showed a p value >0.01, without a clear preference for a certain comparison. The application of different search algorithms thus results in different protein quantifications in most cases for SIn, and in all cases for NSAF and emPAI.
Looking at these protein pairs we observed large differences for many proteins. For NSAF and emPAI, on average 9.4% of the proteins (this was similar for both quantification methods) observed by any combination of two search engines showed a fold change larger than 1.5, and about 0.9% exhibited a fold change larger than 2. For Sin, however, about 18% of the overlapping proteins showed a change larger than 1.5-fold, and about 10% had a fold change larger than 2. Clearly, different search engines give rise to different protein abundance estimations, and the effect is significantly larger for the SIn method.
Effect on UPS protein quantification reproducibility in a single sample
Figure 2 shows the number of UPS proteins identified by each of the search algorithms in each of the samples. We observe a search algorithm ranking that is similar to that seen in Figure 1.
Number of UPS proteins observed by each of the search algorithms in each of the samples. A protein is observed in a sample if at least two (potentially modified) peptide sequences that uniquely match the protein are identified.
Given that these UPS proteins are spiked into the sample at the same concentration, we expect the label-free MS2-based quantification of these proteins to be similar. We can evaluate this by computing the variance of the UPS protein quantifications for each search algorithm in each of the samples. In order to compare the variances between search algorithms we computed the coefficient of variation (CV), normalizing for different mean quantification results between the search algorithms.
Figure 3 shows the CV in percent for the various search algorithms across all samples. Each subplot corresponds to the results for a different protein quantification method. Table 1 presents the average CV in percent. None of the differences in average %CV between the search algorithms were significant (p>> 0.05) as computed by the Wilcoxon signed-rank test for paired data. So for this experiment we did not observe any noticeable search algorithm effect.

Three plots, one for each quantification method, that show the %CV values for comparing UPS protein quantifications in each of the samples, for each of the search algorithms (M, Mascot; X, X!Tandem; O, OMSSA).
Effect on protein quantification reproducibility over all the samples
Label-free MS2-based quantification methods are typically employed to compare relative protein abundances among several samples (e.g., for finding markers for specific diseases by comparing patient and control samples). Even though we have shown that there is a search algorithm effect for protein quantification in a single sample, this does not necessarily imply that the same issue occurs when comparing quantifications across multiple samples, as long as the variability of the relative quantification among the samples is not increased by the application of a specific search algorithm. To evaluate this we considered the observed variability of protein quantification over all nine CPTAC samples (i.e., we used only those proteins that were identified in all nine samples by a given search engine). The total number of proteins was 382, 377, and 362, for X!Tandem, Mascot, and OMSSA, respectively. The overlap in selected proteins for the different search engines was high: 375 proteins overlap between X!Tandem and Mascot, 362 overlap between X!Tandem and OMSSA, and 361 overlap between Mascot and OMSSA.
For each selected protein we computed the %CV of the distribution of all nine quantifications. Next we compared these %CV values between the search algorithms. Figure 4 shows the %CV of the proteins identified by each of the search algorithms. There is one set of boxplots for each protein quantification method. We can see that the differences in reproducibility between search algorithms are minor for NSAF, with OMSSA showing a barely perceptibly higher variation than Mascot and X!Tandem. For the emPAI quantification method, X!Tandem shows the highest variation and OMSSA the lowest. In the case of SIn, it is again OMSSA that shows the larger %CV values. The Wilcoxon signed-rank test between the %CV values for each of the search methods was used to evaluate the significance of the observed differences. Figure 5 presents the p values for each of the comparisons. From this figure we observe a search engine effect on the reproducibility of the quantification of proteins using label-free MS2-based methods. Low p values (p<0.01) are primarily observed for those comparisons involving OMSSA. For emPAI, however, we also observe a significant difference (p<0.05) when comparing X!Tandem's quantification reproducibility with Mascot's.
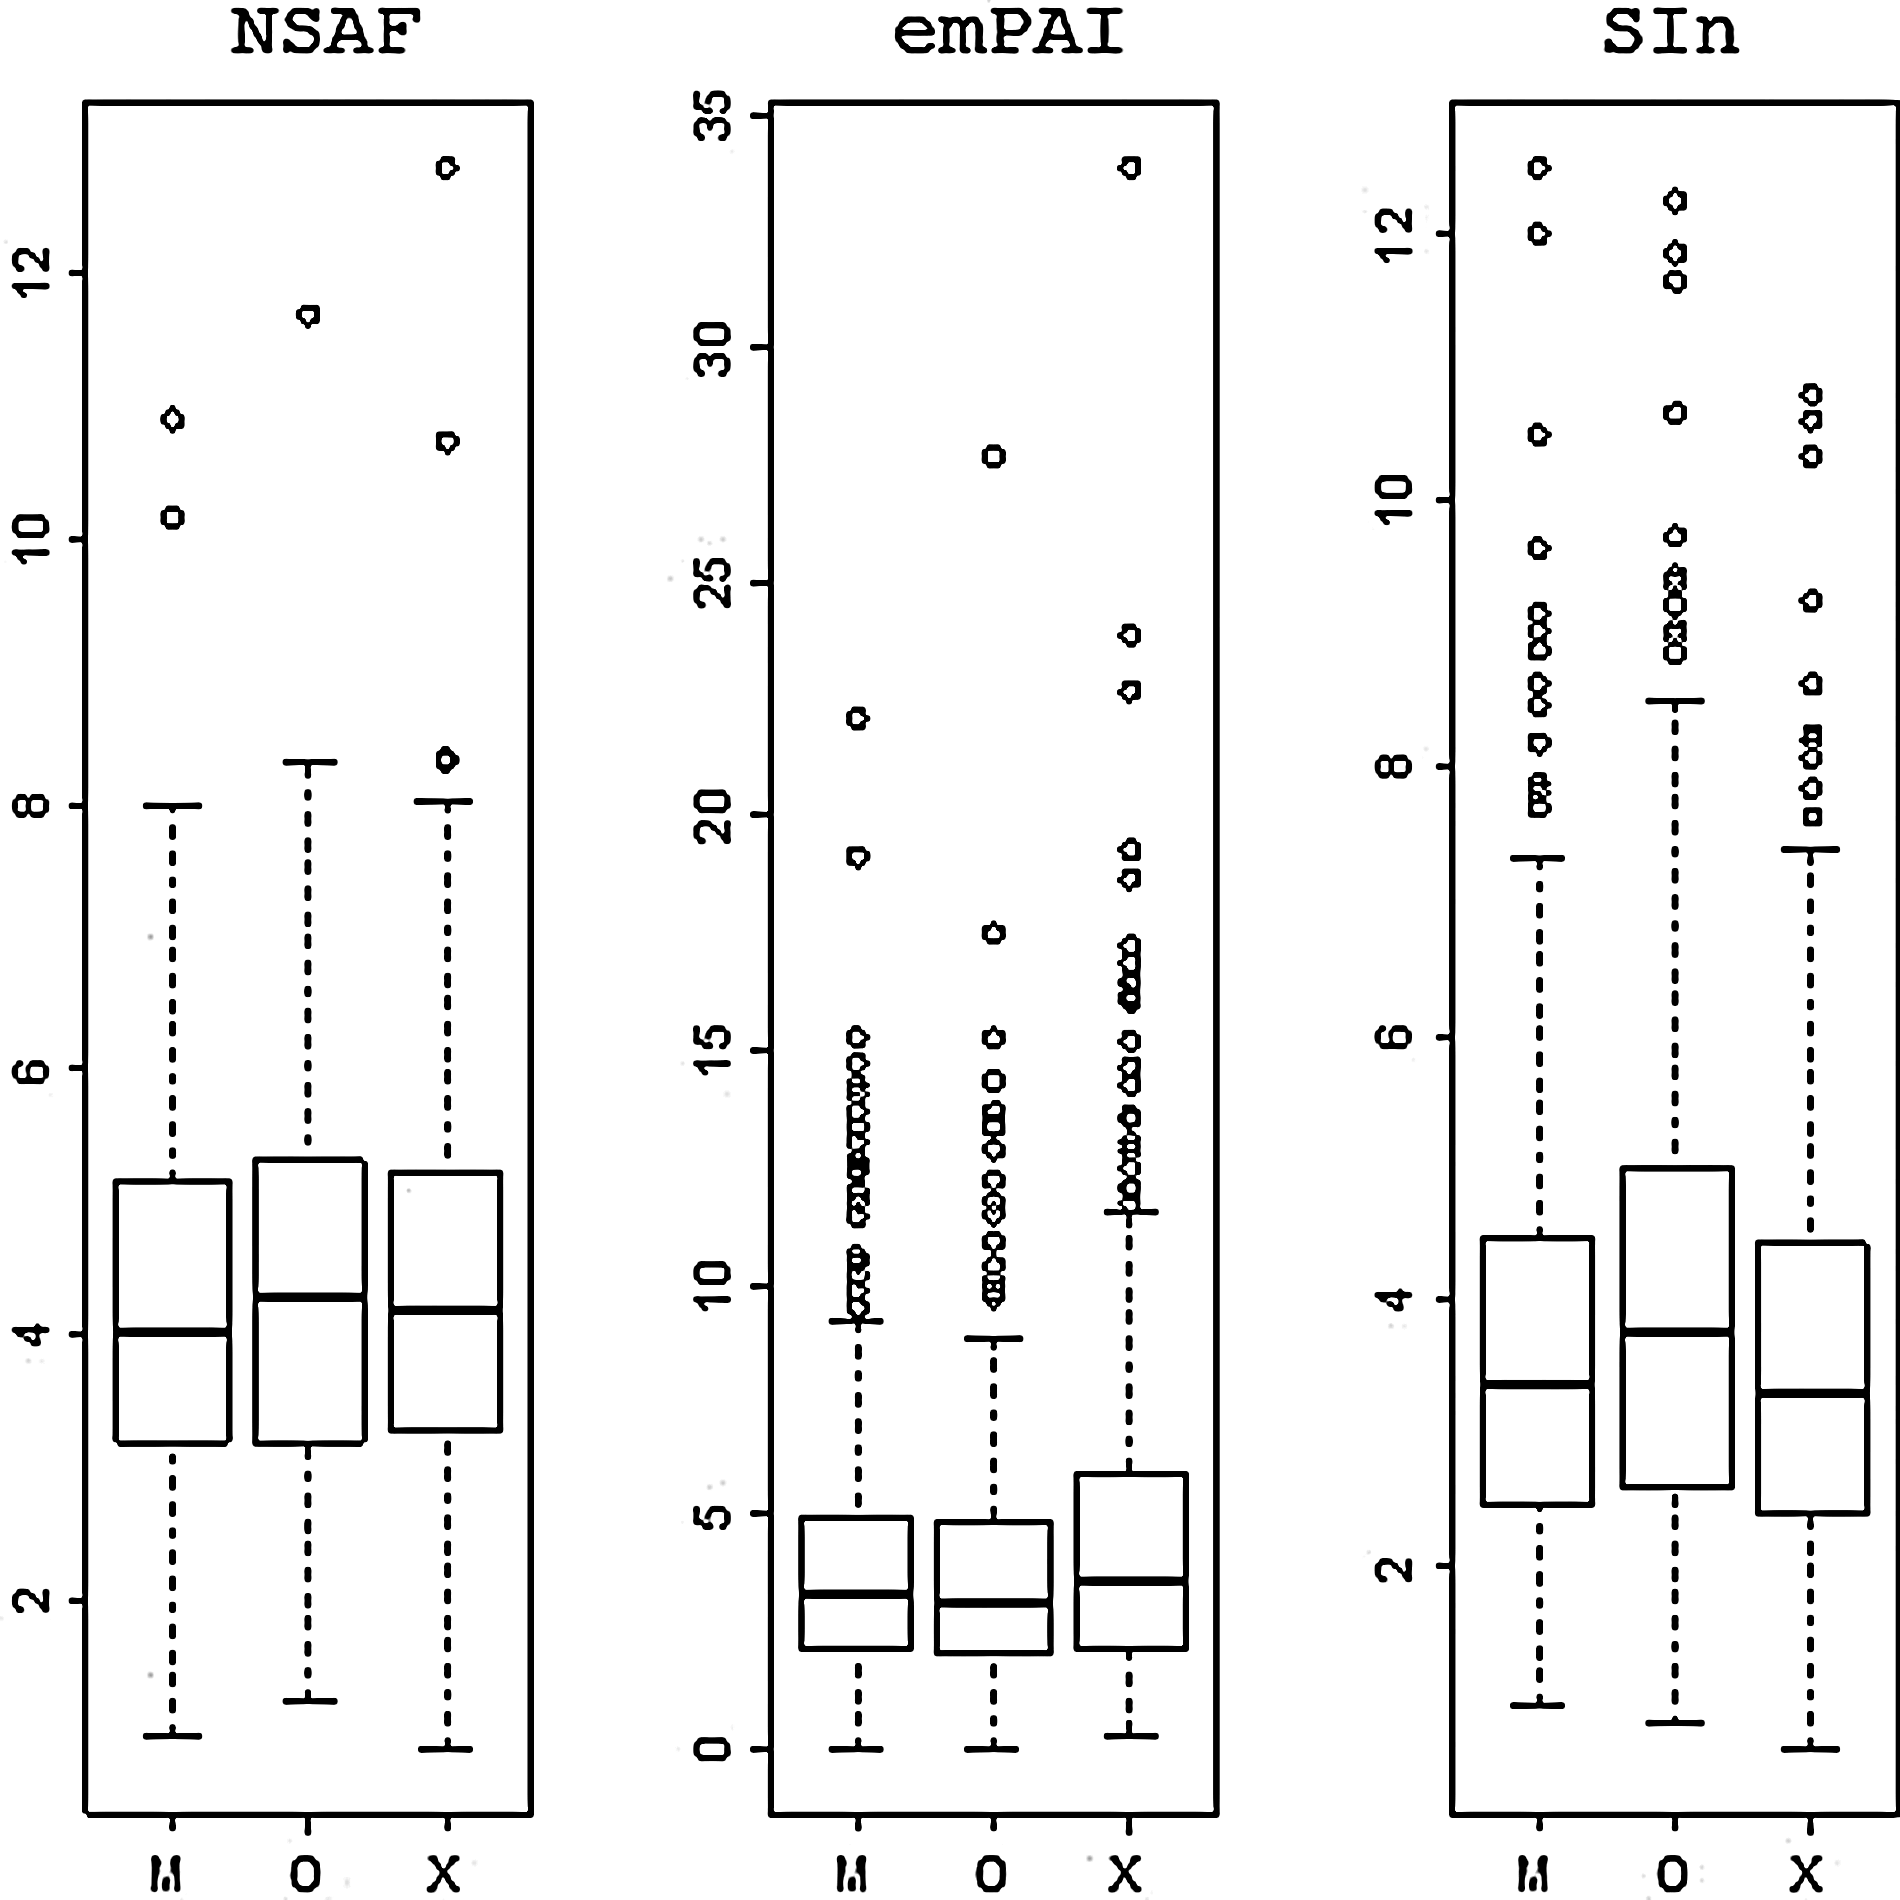
Three plots, one for each quantification method, that show the %CV values for comparing protein quantifications over the nine technical repeats, visualized as boxplots, one for each search algorithm (M, Mascot; X, X!Tandem; O, OMSSA).

Wilcoxon signed-rank test p values for comparing %CV values of technically repeated measurements for the proteins.
Figure 6 plots the same %CV values that measure protein quantification variability for each search algorithm and each quantification method on the y axis. The x axis represents the number of peptides identified by the search algorithm for a protein. Since the same protein can be identified by a different number of peptides in each of the nine samples, we selected the minimum peptide count for a protein over the nine samples for the x-axis number. For each scatterplot a linear trend line is computed through linear regression that shows the trend of the %CV as the number of peptides per protein increases. We observe that for NSAF and SIn this trend is decreasing, as can be expected. This means that by increasing the number of peptide identifications required to identify a protein, the label-free quantification reproducibility can be improved for NSAF and SIn. However, for emPAI we observe an increasing trend, so this conclusion cannot be generalized to all label-free methods. It may be that emPAI negates this effect because it uses sequence coverage rather than spectral counts or intensities as its primary metric.
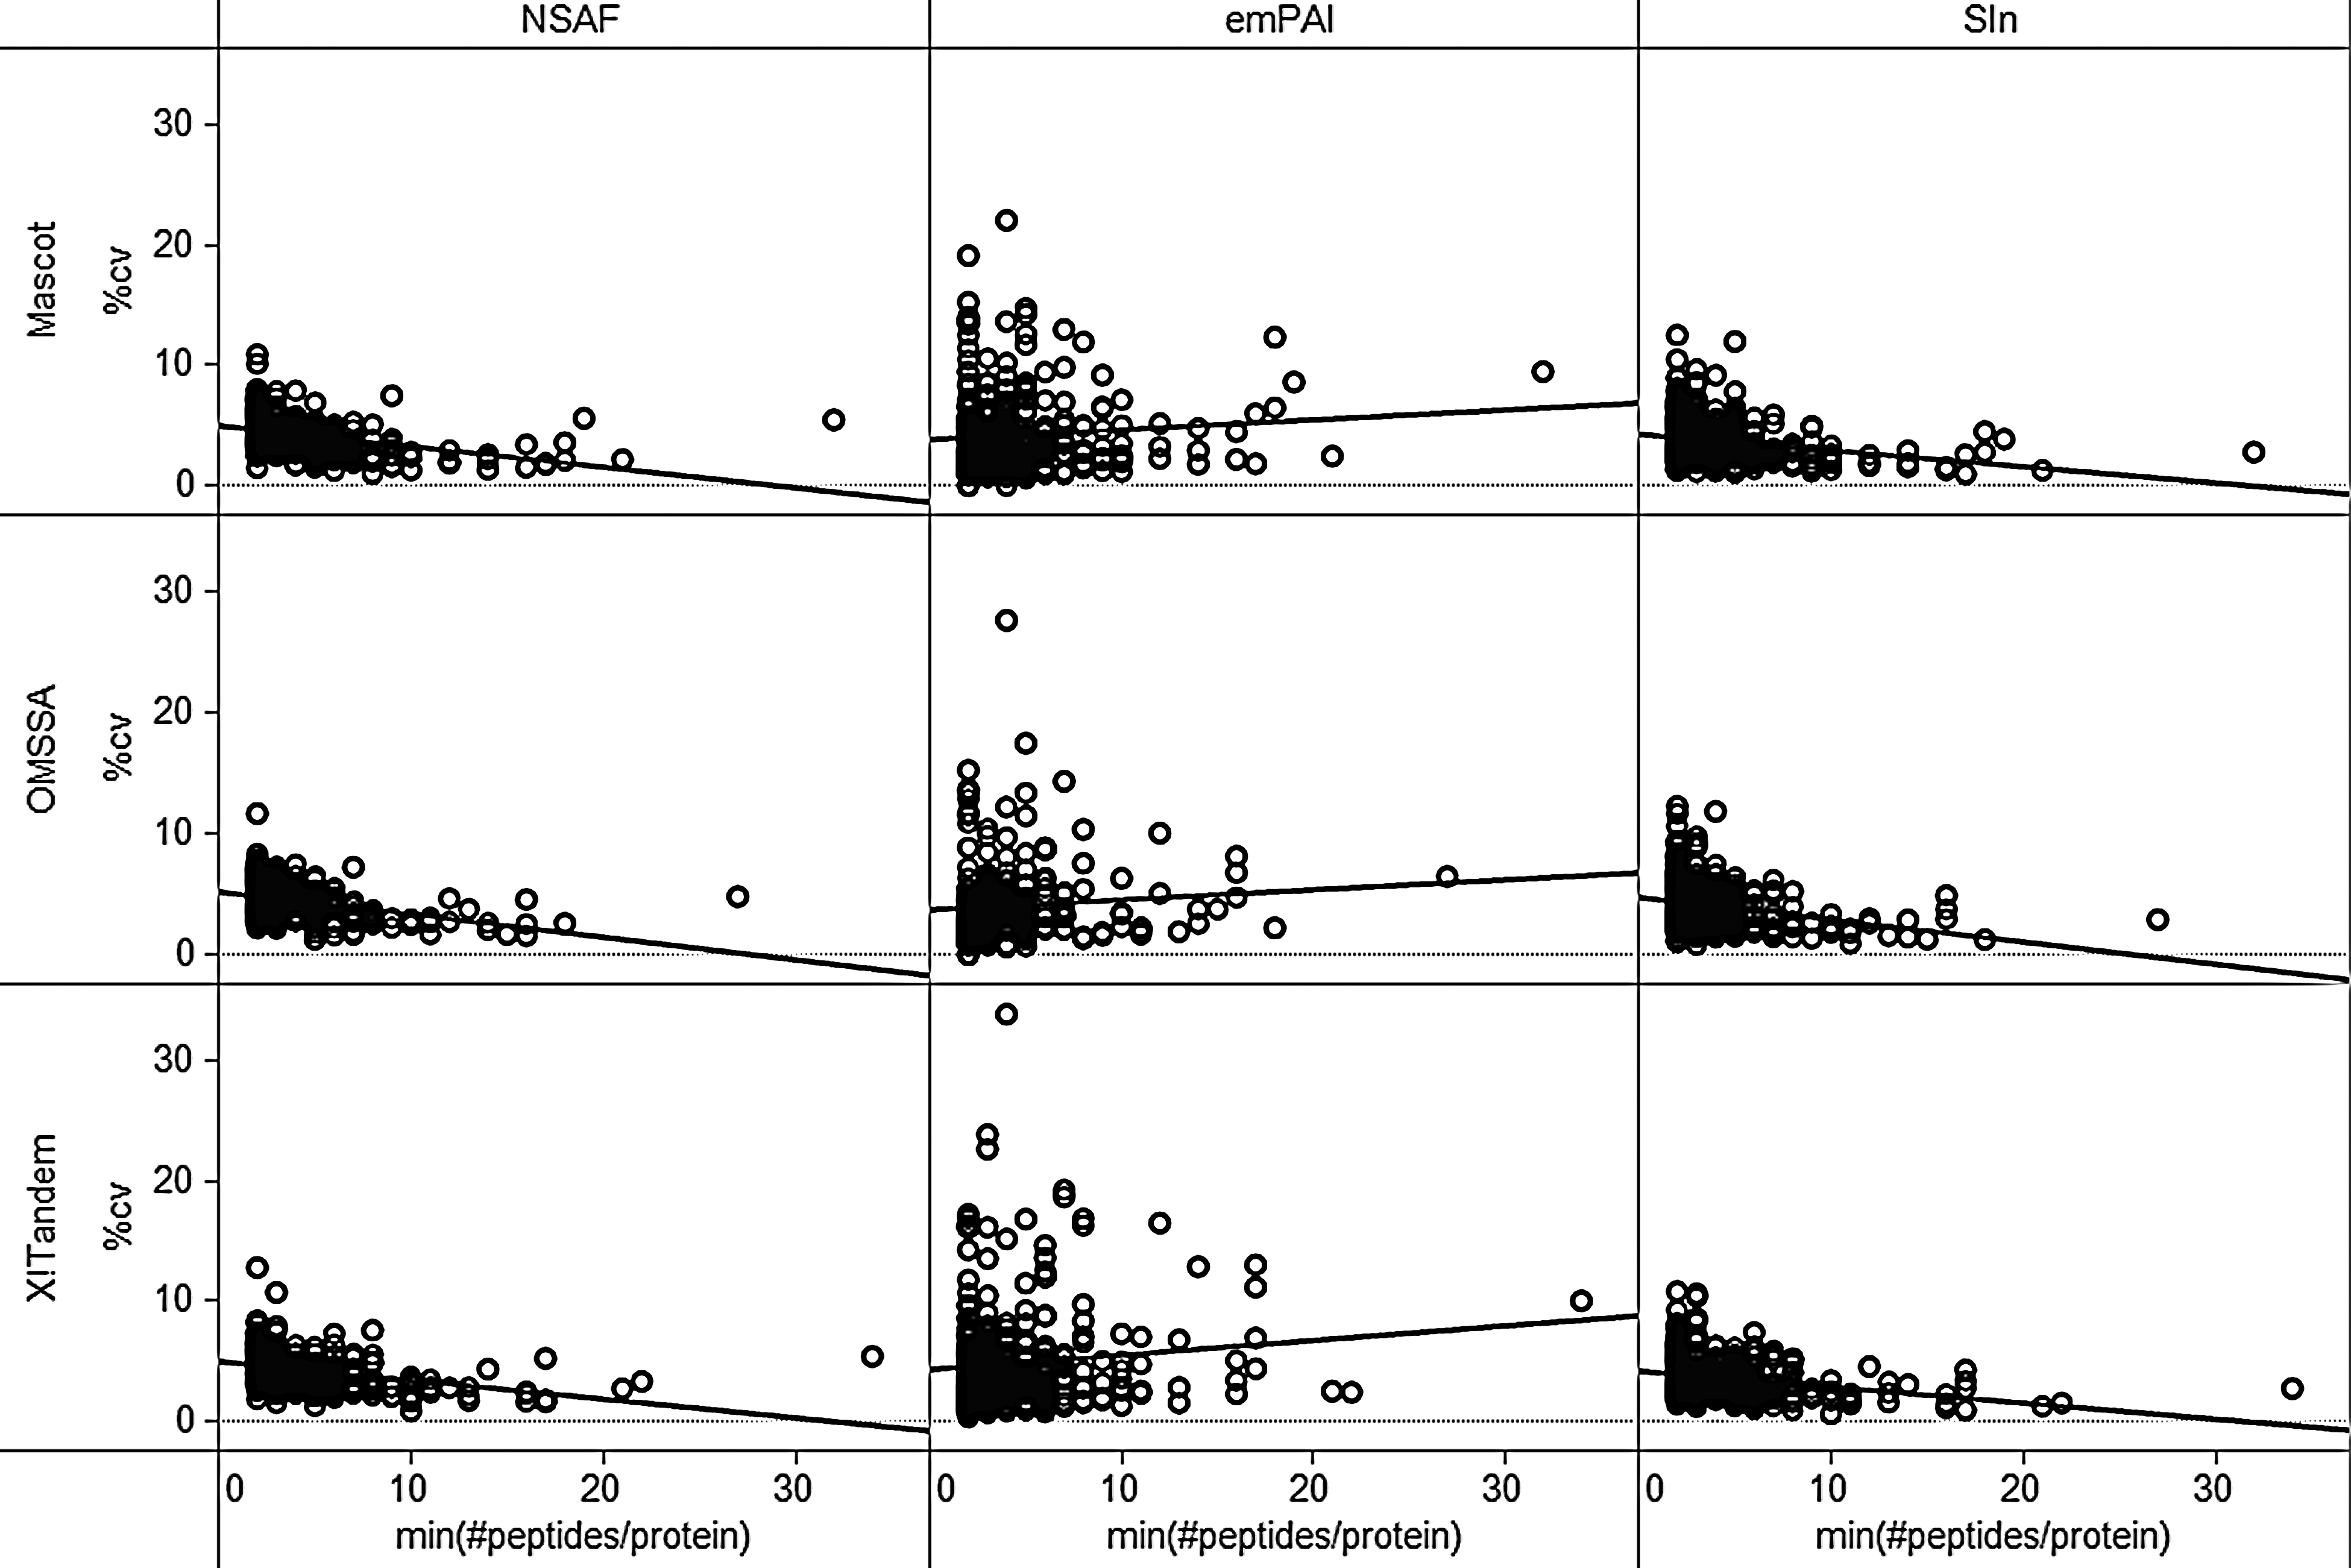
Nine scatterplots, one for each quantification method and search algorithm combination, that show the %CV of the protein quantifications over the nine technical repeats (y axis), against the minimum number of unique, potentially-modified peptide sequences identified for that protein by the search algorithm under consideration.
Conclusions
We have here evaluated the effect of using different search algorithms on the quantification of proteins using label-free MS2-based methods. We showed that a significant effect exists by comparing the quantifications computed based on the output from each of the search algorithms for the same protein in the same repeat. However, when looking at the average quantification of the UPS proteins identified in a single repeat, we did not observe any significant difference between the search algorithms. We then showed that the search algorithm effect also has an impact on the protein quantification reproducibility across multiple samples. As such, it seems that proteins of similar concentration (such as the equimolar spike-in of UPS-48 in this particular sample) suffer least from the search engine effect, while proteins at different abundances can behave quite differently, leading to higher coefficients of variance. This higher variance is most likely related to the limited ability of one search engine compared to another in identifying a relatively poor spectrum for a protein that has few other identified peptides. In these cases, the addition or removal of an additional identified (and quantified) peptide can negatively influence the reproducibility of the study. As such, the variations observed here can potentially be suppressed by focusing only on the shared peptides, as is done in the RIBAR method (Colaert et al., 2011b), or by averaging out the contributions of uniquely identified peptides (as is done by the xRIBAR method). If a particular search engine consistently picks up a peptide that another search engine does not identify, however, the search engine effect can remain despite the focus only on shared peptides. Additionally, it is worth noting that different quantification algorithms yield different reproducibility scores across technical replicates for different search engines. Indeed, while OMSSA deviates significantly from Mascot and X!Tandem for NSAF and SIn, with Mascot and X!Tandem agreeing quite well for these quantification algorithms, this latter agreement does not hold for emPAI, for which OMSSA compares more favorably to Mascot than either of these do to X!Tandem.
As a general conclusion, it is recommend to address the overall possibility of search engine-induced bias in the protein quantification results of label-free MS2-based methods by performing the analysis with two or more distinct search engines, and to trust only those regulated proteins that are shared by all approaches.
Footnotes
Acknowledgments
The authors acknowledge the support of Ghent University (Multidisciplinary Research Partnership “Bioinformatics: from nucleotides to networks”), and the PRIME-XS project, grant agreement number 262067, funded by the European Union 7th Framework Program. The authors would furthermore like to thank the participants in the CPTAC project for making their data publicly accessible. The computational resources (Stevin Supercomputer Infrastructure) and services used in this work were provided by Ghent University, the Hercules Foundation, and the Flemish Government–department EWI.
Author Disclosure Statement
The authors declare that no conflicting financial interests exist.