
Abstract
Abstract
Colorectal cancer (CRC) is a common malignant gastrointestinal cancer. Efforts for preventive and personalized medicine have intensified in the last decade with attention to novel forms of biomarkers. In the present study, microRNA and genetic analyses were performed in tandem for differential transcriptome profiling between primary tumors with or without nodes or distant metastases. Serial Test Cluster (STC) analysis demonstrated that 20 genes and two microRNAs showed distinctive expression patterns associated with the tumor, node, and metastasis (TNM) stage. The selected target genes were characterized by GO and Pathway analysis. A microRNA-target gene network analysis showed that miR-429 resided in the center of the network, indicating that miR-429 might serve important roles in the development of CRC. Real-time PCR and tissue microarrays showed that miR-429 had a dynamic expression pattern during the CRC progression stage, and was significantly downregulated in stage II and stage III clinical progression. The low expression of miR-429 was correlated with poor prognosis for CRC. Taken together, miR-429 warrant further clinical translation research as a candidate biomarker for CRC prognosis. Additional downstream targets and attendant gene function also need to be discerned to design a sound critical path to personalized medicine for persons susceptible to, or diagnosed with CRC.
Introduction
C
The transcriptome is the set of all RNA transcripts, including coding (mRNA, tRNA, rRNA) and noncoding RNA (microRNA, lncRNA), produced in one cell or in a population of a certain type of cell (Lu et al., 2005; Taft et al., 2010). Unlike the genome, the transcriptome is highly variable during cell development, and the interaction between transcripts weaves an important network of gene regulation (Lackner et al., 2012; Rhodes and Chinnaiyan, 2005). In tumor cells, normal transcriptional function has been disrupted, and the gene regulation network favors uncontrolled growth. Some have even called the cancer a disease of gene–network dysregulation (Rhodes et al., 2005). To date, hundreds of studies have reported the transcriptome profile of different aspects of cancer, including CRC (Nannini et al., 2009). Here we report a new approach that combines coding and noncoding (miRNA) transcriptome data from different progression states of CRC to visualize the dysregulated miRNA-target gene network and identify the main regulator of CRC progression.
MicroRNAs (miRNAs) are small noncoding RNAs that exert post-transcriptional repression during cell biogenesis, and it is believed that hundreds of target genes may be regulated by a single miRNA. Recent studies have shown that some miRNAs are involved in the carcinogenesis and progression of CRC. However, the relationship between aberrant miRNAs and the target genes of the different clinical stages of CRC remains poorly understood, and the interactions between different miRNAs via target genes networks in CRC have not been comprehensively reported.
In the present study, simultaneous microRNA and gene microarray profiling of the TNM-specific CRC and distant normal control samples was performed to analyze the attendant transcriptome. Additionally, a miRNA target-gene regulatory network was built based on the miRNA and gene profile data of different TNM stages of CRC. Stage-series design was applied in this experiment.
Material and Methods
Sample collection
CRC samples were collected from the Xiangya First, Second, and Third Hospitals between 2006 and 2008. Samples for the microarray experiment included five tumor and paired normal (>10 cm from the tumor and histological verified as cancer free) colorectal mucosa samples from the 4 TNM stage from 20 CRC patients. Biopsies were flash frozen with liquid nitrogen immediately after surgical resection. Samples for real-time PCR validation include the 20 cases used in the microarray experiment and an additional 141 cases (normal control: 44 cases; Stage I: 31 cases; Stage II: 38 cases; Stage IV: 32 cases). Tissue collection and the construction of tissue microarrays (TMA) have been described previously (Peng et al., 2009). Briefly, the TMA contained 336 dot matrices, including 103 cases of colorectal cancer, 103 cases of adjacent noncancerous mucosa (taken from 0.5–1.0 cm adjacent to primary tumor), 103 cases of distant morphological normal mucosa (>10 cm away from the primary tumor), and 27 lymphatic metastases. All samples were H&E stained and examined by two senior pathologists to confirm the histopathologic state, including TNM stage and metastasis. The TNM staging was performed based on the 7th edition of the AJCC TNM staging manual for CRC (Edge et al., 2010). Survival analysis was based on overall survival. All procedures were approved by the Xiangya Hospital Ethics Committee of the Central South University and were performed after obtaining the patient's informed consent.
miRNA and gene expression microarray
miRCURY LNA™ microRNA arrays v.9.2 (Exiqon, Vedbaek, Denmark) were employed to detect miRNA expression profiles, and each microarray chip was hybridized with a single sample. All procedures were carried out according to the manufacturer's protocol (Castoldi et al., 2006). Briefly, 1 μg of total RNA was extracted using TRIZOL Reagent (Invitrogen, Carlsbad, CA) and labeled using a miRCURY LNA™ microRNA Hy3/Hy5 power labeling kit (Exiqon). Chips with labeled samples were hybridized at 56°C overnight in a heat-shrunk hybridization bag (Phalanx Technologies, India) and then washed using a miRCURY LNA™ washing buffer kit (Exiqon). Human OneArray™ whole-genome DNA microarrays (Phalanx) were employed to detect gene expression profiles in the same set of samples used in the miRNA microarray experiment. Similarly, each microarray chip was hybridized with a single sample, and all procedures were carried out according to the manufacturer's protocol. Briefly, 5 μg of total RNA was used for Cy5-labeled aRNA preparation using a MessageAmp™ aRNA amplification kit (Ambion, Austin, TX). Chips with labeled samples were hybridized at 50°C overnight in a heat-shrunk hybridization bag (Phalanx) and then washed successively with 2X SSPE/0.2% SDS at 42°C for 5 min, 2X SSC at 42°C for 5 min, 2X SSC at room temperature for 5 min, and 0.2X SSC at room temperature for 15 min. Slides were scanned using a Genepix 4000B laser scanner (Axon, Rye Brook, NY) and fluorescent intensities were extracted from the generated images using Genepix Pro 6.0 software (Axon). Then, background subtraction and normalization were performed. Microarray hybridization, data extraction, and normalization were completed at KangChen Bio-tech (Shanghai, China). The microarray data were deposited in Gene Expression Omnibus (GEO) and assigned the accession number of GSE41015.
Bioinformatics analysis
Differential analysis and the dynamic expression model
The repeatability of the microarray within each class (normal, stage I, II, III, and IV) was examined by correlation analysis. Further analysis were performed based on those data with over 50% of intra-class correlation and a coefficient greater than 0.8 (Chen et al., 2007). A data filter >50% of the arrays and a gene signal >0 were selected. Data of the gene array, including 12 distant normal mucosa, 5 stage I, 4 stage II, 5 stage III, and 5 stage IV tumor samples (a total of 31 samples), and data from the miRNA array, including 15 distant normal mucosa, 5 stage I, 5 stage II, 5 stage III, and 5 stage IV tumor samples (a total of 35 samples) passed the correlation-based data filtering and went on for further analysis. Normalization was performed using per chip median normalization and the median array method (Lu et al., 2004). The RVM F-test was applied to screen the dynamic differentially expressed miRNA/genes for the normal and different TNM group. Serial test cluster analysis (STC) was applied to classify the different expression tendency models according to the different TNM stages. The detailed method was applied as previously described (Clarke et al., 2008; Luo et al., 2012; Miller et al., 2002; Ramoni et al., 2002; Wright and Simon, 2003; Tang et al., 2005).
GO and pathway analysis
Gene ontology (GO) analysis was applied to analyze the function of the differentially expressed genes according to the key functional classification of genes in the NCBI (Ashburner et al., 2000). Important pathways containing the differentially expressed genes were also performed by the Kyoto Encyclopedia of genes and Genomes (KEGG) (Draghici et al., 2007; Kanehisa et al., 2004; Yi et al., 2006).
miRNA–GO network
The miRNA—GO Network was constructed based on the interactions between miRNAs and the function of a significant target gene (GO). The Targetscan online database version 5.1 was used to predict target genes (Lewis et al., 2005). Differentially expressed miRNAs were defined as primary nodes–networks. The significance of relationship between miRNAs and the target genes network was evaluated by the number of nodes in the network with a degree of connection greater than 20 (Joung et al., 2007). In this network, the red square represented miRNA, and their relationship was represented by edge, and the blue circle represents significant GO function.
Real-time quantitative PCR validation
Real-time PCR was performed using a SYBR-green-containing PCR kit (GenePharma, Shanghai, China). The primers for qRT-PCR to detect miRNA were designed based on the miRNA sequences provided by the Sanger Center miRNA Registry and were synthesized and purified by Shanghai Gene-Pharma. All RT-PCR was performed on the BIO-RAD IQ5 Multicolor Real-time PCR detection System (Bio-Rad, Hercules, CA). The 2−ΔΔCt method was used to calculate the relative expression of miRNA. Each experiment was performed in triplicate and repeated three times.
In situ hybridization (ISH) validation
The miR-429 miRCURY™ LNA custom detection probe (Exiqon) was used for in situ hybridization (ISH). The sequence 5’ to 3’ (enhanced with LNA) was ACGGTTTTACCAGACAGTATTA, with digoxigenin (DIG) at the 5’ and 3’ ends. Hybridization, washing, and scanning were carried out according to the manuals and protocols provided by the Exiqon Life Science Department. All microscopic images were captured with a BX51 system microscope (Olympus, Japan). The slides were then examined under a transmission light microscope. Staining intensity was scored as 0 (negative), 1+(weak), 2+(medium), or 3+(strong). Low expression was defined as an intensity of 0, 1, 2, or 3 with <10% stained cells or an intensity of 0 or 1 with <50% stained cells. High expression was defined as an intensity of 2 or 3 with >10% stained cells, or an intensity of 1, 2, or 3 with >50% stained cells.
Survival analysis
Survival curves were calculated for the 103 cases of CRC mentioned in the TMA. Twenty-nine of these patients were lost during the follow-up period, and 48 patients received follow-up. Overall survival curves were constructed using the Kaplan–Meier method, and the differences between the curves were compared using log-rank tests. Univariate analysis with the Cox proportional hazards model was used to determine each identified prognostic factor.
Statistical analysis
Differences between groups were tested with Student's t-test or a one-way analysis of variance (ANOVA) using the SPSS 13.0 program (SPSS, Inc. Chicago, USA). Associations between clinicopathological parameters and miR-429 expression levels were evaluated using the Pearson x2 test.
Results
Stage-series gene expression model
The gene expression data for normal and stages I, II, III, and IV samples were set up as five serial time points according to the stage-series theory of the CRC progression. A total of 2858 differentially expressed genes were obtained using the RVM F test (p<0.05 and FDR<0.05). Serial Test Cluster analysis (STC) was carried out to analyze the dynamic gene expression models for these genes. Twenty out of 80 default expression models were significant (p<0.05/80) (Fig. 1). Among them, models No.67 and No.41 had unique expression patterns that were analyzed further. No.67 was the most significant model that contained the largest number of genes (542 genes) (Fig. 1B). This model showed low expression in normal colorectal mucosa and sustained high expression in stages with advanced progression (I–IV). Therefore, the expression pattern of model No.67 was likely to represent a group of genes that distinguished between CRC and normal colorectal mucosal. GO analysis showed the top five most significant gene functions of this group of genes were multicellular organismal development, protein amino acid phosphorylation, meiosis, negative regulation of apoptosis, and positive regulation of microtubule polymerization. Pathway analysis showed the top five most significant pathways involved were metabolic pathways, nicotinate and nicotinamide metabolism, pyrimidine metabolism, TGF-beta signaling pathway, and the apoptosis pathway (p<0.01) (Fig. 1C and D).

Twenty dynamic gene expression models with histogram of significant GO and Pathway analyses.
Pattern No.41 showed another tendency in which expression was primarily elevated in stage IV where the primary tumor had produced distant metastases (Fig. 1E). The activation of these genes may have been closely related to tumor metastasis (Fig. 1F and G). GO analysis listed the top five functions for this group of genes as cell adhesion, ion transport, potassium ion transport, cytoskeleton organization, and cell-matrix adhesion and response to heat. Pathway analysis showed these genes were mainly involved in calcium signaling, focal adhesion, cardiac muscle contraction, and ECM-receptor interaction.
Stage-series miRNA expression model
miRNA expression pattern analysis was performed in exactly the same way as gene expression because our goal was to join the two data sets seamlessly into an integrated miRNA-target gene network. The RVM F-test and STC method were also applied to the miRNA data, demonstrating that 55 miRNAs were differentially expressed (p<0.05 and FDR <0.05). Two out of 80 default miRNA expression models, No. 18 and No. 59, were significant (p<0.05/80) (Fig. 2).
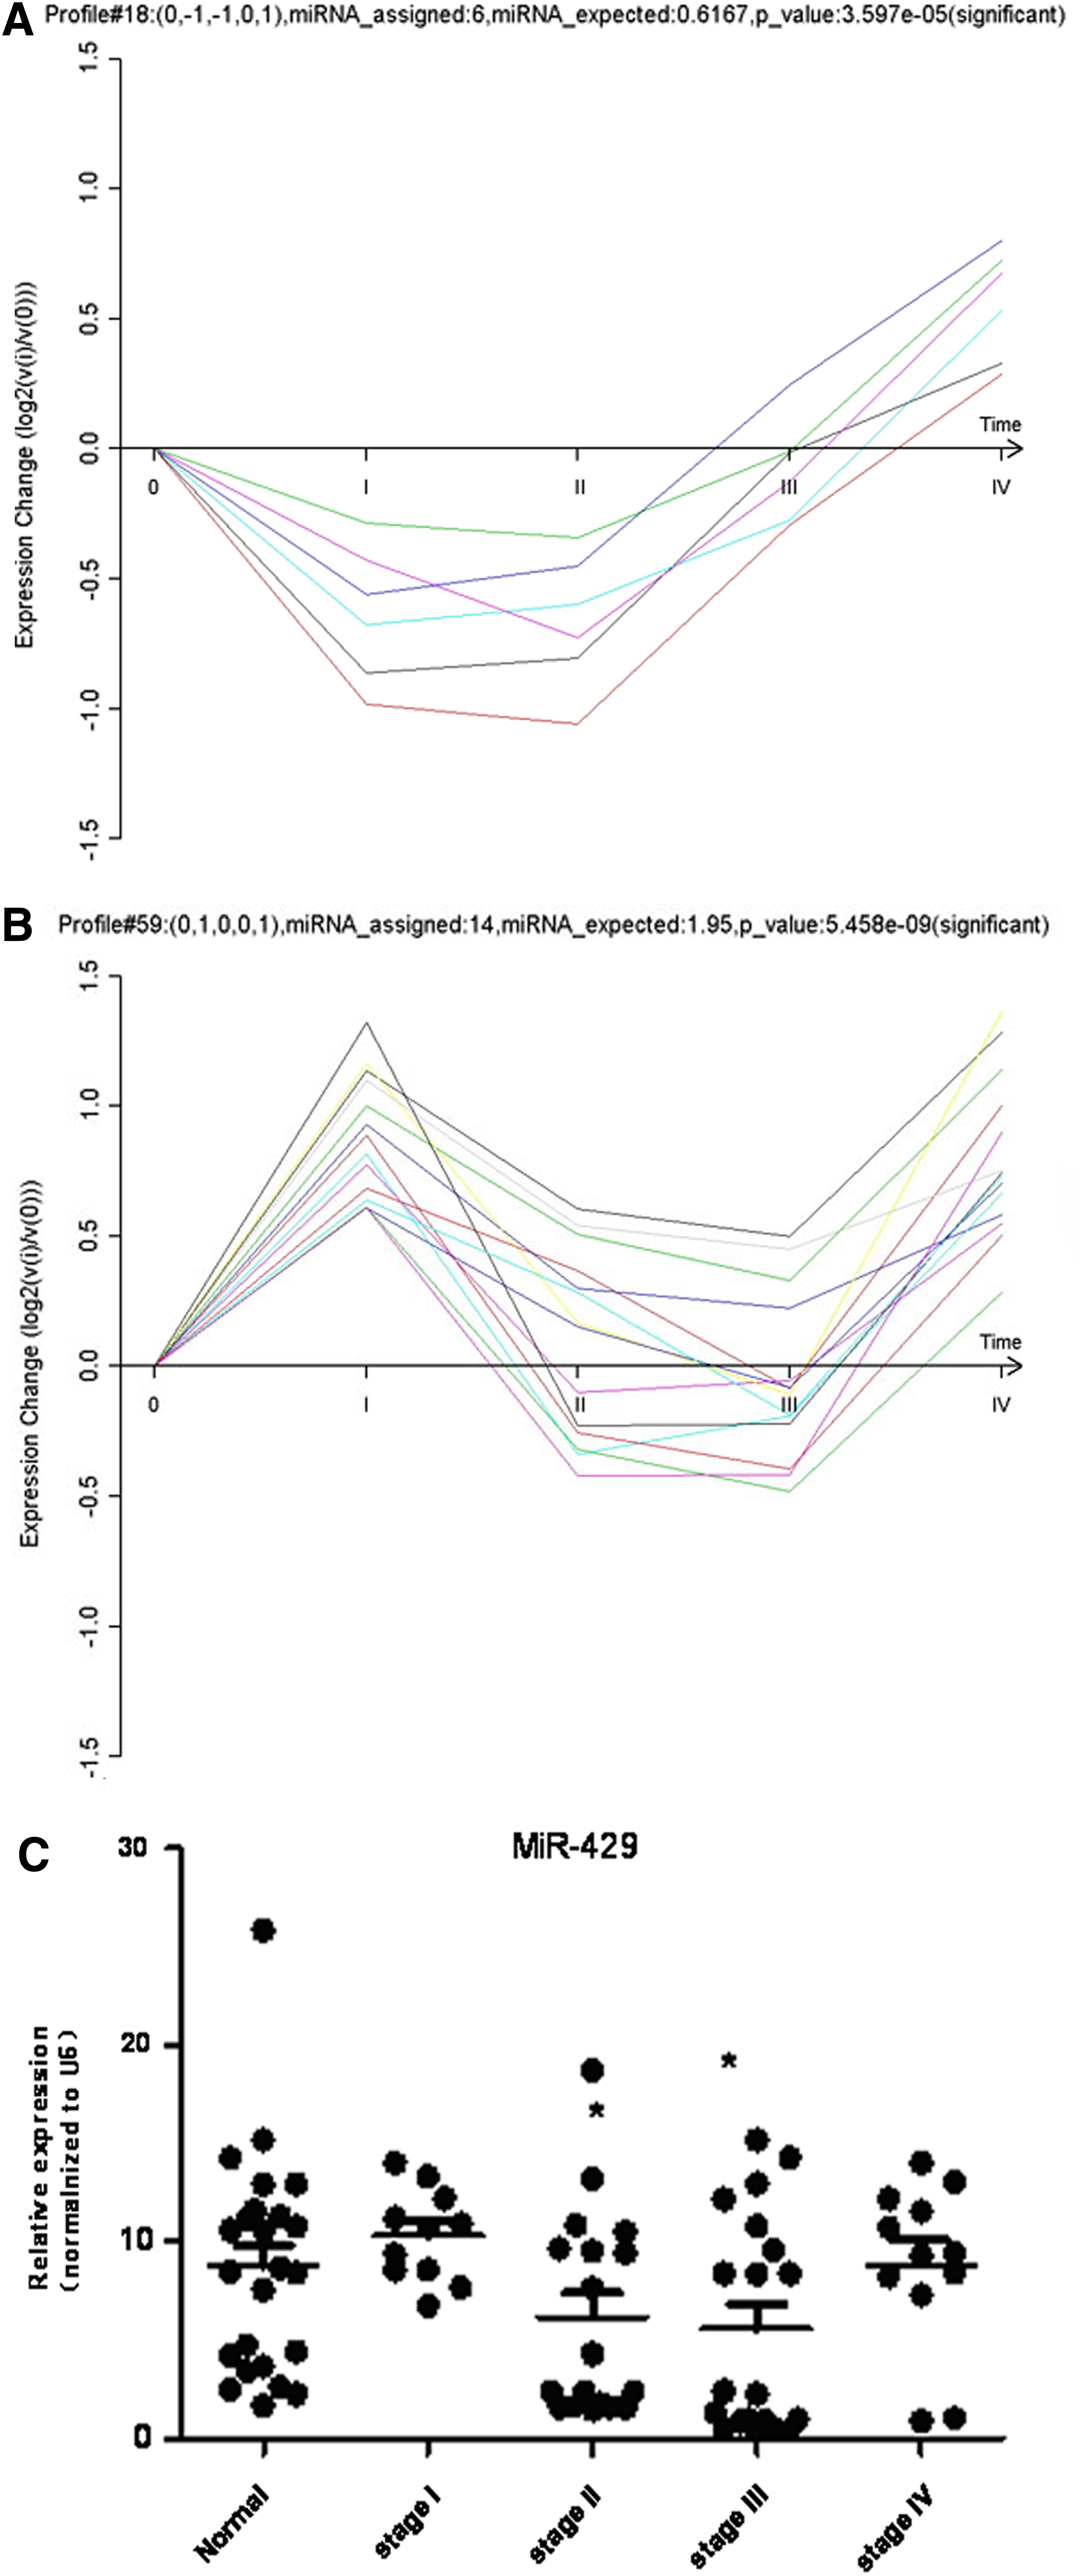
Two significant dynamic miRNA expression models and expression validation of miR-429.
miRNA-GO networks
The Targetscan algorithm was applied for the target predictions for the 42 miRNAs (the other 13 miRNAs were not available in the Targetscan database); there were 5930 miRNA target genes in total. Six hundred and five genes were obtained with the intersection of 5930 target genes and 2858 differentially expressed genes. GO analyses were carried out to analyze significant gene function. Fifty-one significant GO annotations were identified for 307 out of 605 genes using GO analysis (p<0.01 and FDR<0.05) (Fig. 3A). The top five related GO annotations for target genes regulated by miRNAs were multicellular organismal development, nervous system development, cell adhesion, cell cycle, and ubiquitin-dependent protein catabolic process. These miRNAs and related GO annotations were connected to build the miRNA-GO-network. The network concisely showed the relationship between the miRNAs and their related target gene function (Fig. 3B). The degree of the network showed that many miRNAs, including miR-429, miR-524-5p, miR-340, miR-124, miR-20b, miR-98, miR-206, miR-101, miR-302b, miR-518a-5p/527, miR-623, and miR-498, were involved with a large number of GO annotations (degree >20). The network implicated these miRNAs as a regulatory “hub” for CRC.

miRNA-GO Network and miRNA-Gene Network.
Validation of miR-429 expression in different stages of CRC
Based on the results from our bioinformatics analysis, we selected miR-429 for further validation. miR-429 had 38 degrees of connection (rank second in the miRNA-GO network) and significant GO annotations, such as angiogenesis, axon guidance, blood vessel development, calcium ion transport, and cell adhesion, implicated its close connection with CRC development. The samples used in the microarray and 141 additional clinical samples (normal control: 44 cases; Stage I: 31 cases; Stage II: 38 cases; Stage IV: 32 cases) were validated by real-time PCR. miR-429 belonged to miRNA expression model No. 59, and the real-time PCR results for this miRNA shown in Figure 2C were consistent with model No. 59. Relative to normal colorectal mucosa, there was no significant change in stages I and IV, but there was a significant difference between normal colorectal mucosa and stages II and III (p<0.05). ISH with the tissue microarray further confirmed our expression model. As shown in Figure 4, miR-429 expression in stage II and III was significantly lower than the paired distant normal mucosa (Fig. 4B, C, F, and G), whereas ISH showed no significant difference in stage I (Fig. 4A and E). In most stage IV cases (Fig. 4D and H), the expression of miR-429 in tumor remained at a normal or even higher level. In addition, the lymphatic metastasis corresponding to stage III and IV showed prominent downregulation of miR-429 (Fig. 4I and J).

ISH assay indicates the expression of miR-429 in CRC different TNM stages.
Correlation of miR-429 expression levels with clinicopathological characteristics
The correlation between miR-429 expression and the clinicopathological characteristics of the 103 patients was analyzed. As shown in Table 1, miR-429 expression in tissues was not associated with gender, tumor size, or lymphatic metastases. However, we noticed that the expression of miR-429 was associated with age (p<0.01); younger patients exhibited lower expression levels of miR-429. The expression of miR-429 was also associated with the degree of CRC differentiation (p<0.05); poorer differentiation resulted in the lower miR-429 expression. A reduced expression of miR-429 was also associated with tumor location. There were significant differences between primary tumors (CA) and adjacent mucosa (CB, 0.5 cm) (p<0.01) and primary tumors and distant normal mucosa (CC, 5 cm) (p<0.01). There were no significant differences between normal colorectal mucosa and stage I CRC (p>0.05), and normal and stage IV CRC (p>0.05). However, there were significant differences between normal and stage II CRC (p<0.05) and normal and stage III (p<0.01). The above results indicated that miR-429 expression probed by ISH was consistent with our real-time PCR results, and both agreed with the miR-429 expression profile identified with a microarray.
P<0.05.
Prognostic value of miR-429 expression in CRC
The association between the expression of miR-429 and the CRC outcome was further to investigated, survival curves were calculated for 103 cases of CRC from the TMA. Twenty-nine of these patients were lost during the follow-up period, while 84 patients received follow-up in the study. Of those, 64 patients exhibited low miR-429 expression, 19 of whom died, and 20 patients had high expression levels of miR-429, 5 of whom died. The mean follow-up period was 46.4±23.2 months, with a range from 3 to 96 months. Survival curves calculated by the Kaplan–Meier method and analysis using the log rank test showed that the survival rates of the patients with low expression of miR-429 (p=0.007) were significantly reduced (Fig. 5). Using a univariate analysis (Cox's proportional hazards model), the expression of miR-429 (p=0.000, 95% CI: 1.820–6.358) was determined to be significantly associated with prognosis.
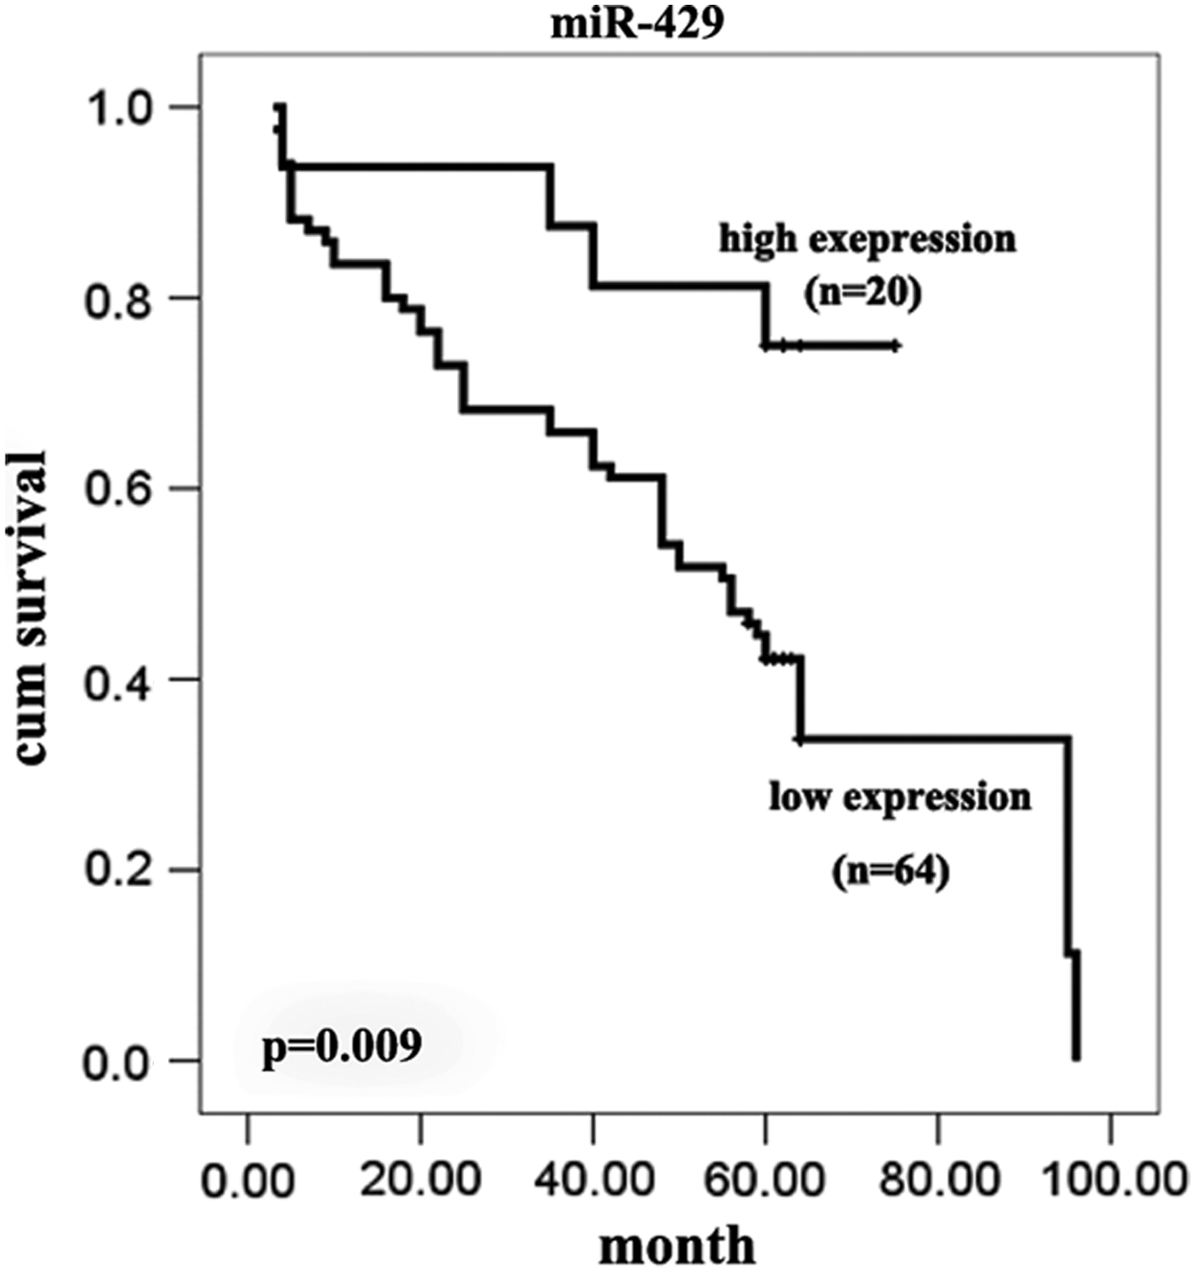
Kaplan–Meier survival curves according to expression levels of miR-429 in CRC.
Discussion
The TNM stage has been widely used for decades in clinical practice to define the pathological state and prognosis. However, its accuracy and precision are still limited for certain cases, and novel biomarkers are in demand for early detection and late-stage prognosis. Here, we employed a gene and miRNA expression microarray to analyze differential miRNA and gene expression according to the TNM stage of CRC progression. Using a network-based bioinformatics approach, we depicted the global interaction of the miRNA-target mRNA regulation network at the transcriptome level. These results were used to visualize the dynamic aspects of the CRC transcriptome and were helpful for novel biomarker discovery.
Stage-series design applied to this project perfectly matched the time sequence of CRC progression, or, in this case, the TNM stage. A similar method, the self-organizing map (SOM), has been widely applied in a related field (Nakayama et al., 2011). In our study, differentially expressed genes with dynamic expression patterns were well visualized in accordance with the CRC TNM stage, and various gene expression models represented different biological features. Combined with our understanding of tumorigenesis, we could extract relevant dynamic models, such as models No. 41 and 67, that might represent genes involved in the initiation or dissemination of CRC. As for model No. 67, the expression pattern of these genes showed a significant difference between normal and cancerous tissue. In conventional experimental designs, the difference between cancer and normal cells has been widely studied. Here, in a TNM-specified experimental design, a similar result once again indicated that the critical change, or a so called “transcriptome storm” (Tang et al., 2012), was taking place during the initiation of carcinogenesis because a large number of genes were becoming dysregulated (upregulated in this case) at a significant level. As for No. 41, the pattern was expressed in a different way; the changes were mostly focused in the last stage of CRC, and, in this case, upregulation occurred in stage IV.
Network-biology played an important role in deciphering large and complicated biological data sets (Albert, 2005; Barabasi and Oltvai, 2004). The biology of cancer, especially omic-base data, suggests a network-based structure in which gene products can be interrelated in a network fashion. The genome-wide integration of miRNA with gene expression data in relation to miRNA-target gene interactions is an innovative way to picture the aberrant landscape of post-transcriptional regulation (Cui et al., 2006; Huang et al., 2012; Li et al., 2011; Luo et al., 2012). In this project, we combined two types of data from the same group of patients to construct a miRNA-target genes network and to uncover candidate miRNAs. Analysis based on the intersection between significantly expressed miRNAs and their target genes based on Targetscan predication identified 605 differentially expressed genes that were the targets of miRNAs. The application of GO analysis demonstrated that the GO annotations multicellular organismal development, nervous system development, cell adhesion, cell cycle, and ubiquitin-dependent protein catabolic process were the primary gene functions performed by these target genes. In addition to the gene function issues, the degree (complexity) of the node (miRNA or GO) were also of primary concern because the weight of the importance of the regulator (in this case, the miRNA) increased as the degree number increased according to the theory of network biology. With the visualization of the miRNA-target genes network, we found that miRNA, including miR-429, miR-524-5p, miR-340, miR-124, and miR-20b, were the main regulators of the CRC post-transcriptional network. These results led us to propose miR-429 as our candidate miRNA-based biomarker for CRC.
Noncoding miRNAs play an important role in post-transcriptional regulation during cancer initiation and progression (Bartel, 2004; Essteller, 2011). miR-429, a member of the miR-200 family, was previously shown to inhibit the expression of the transcriptional repressors ZEB1/deltaEF1 and SIP1/ZEB2 and to regulate epithelial–mesenchymal transition (EMT), which represents an important early step during metastasis (Gregory et al., 2008). Downregulation of miR-429 may also be an important step in tumor progression, and previous studies have indicated that miR-429 is downregulated in a variety of cancers, including renal cell carcinoma (Hidaka et al., 2012), nasopharyngeal carcinoma (Luo et al., 2012), gastric cancer (Sun et al., 2011), endometrioid carcinomas (Wu et al., 2009), and breast cancer (Bockmeyer et al., 2011). In our study, the expression of miR-429 was significantly downregulated in most cases of CRC tissue, especially in stages II and III, relative to the adjacent or distant normal mucosa. These results are consistent with previous reports for cancers of other origin (Fig. 2C, Fig. 4A–C, Fig. 4E–G, Table 1). Survival analysis also indicated low expression of miR-429 is significantly associated with poor prognosis (p=0.009, Fig. 5). ISH analysis showed no correlation with the gender of the patient or the size of the tumor. However, bioinformatics analysis and further validation confirmed that the miR-429 expression pattern was dynamically varied (Fig. 2B and C). It is intriguing to note that expression of miR-429 in at least in some, though not all, cases of stage I CRC and in most cases of stage IV CRC return to normal or even higher levels (Fig. 2C, Fig. 4D and H). ISH correlation analysis also showed that the reduced expression of miR-429 was correlated with younger age and poor differentiation. To the best of our knowledge, CRC has a higher incidence in the older population, but younger CRC patients often had a poor grade of differentiation and thus a poor clinical outcome (Chan et al., 2010). In our study, the expression of miR-429 in 14 out of 15 patients who had poor differentiation was significantly downregulated (Table 1). Considering the EMT-related background and the TNM-specified dynamic expression pattern, miR-429 acted as a putative marker for poor differentiation and thus poor prognosis. Significant downregulation of miR-429, at least in part, was the result of EMT initiation during stages II and III of CRC, and re-expression emerged in stage IV as the EMT program gradually progressed. This notion remains a hypothesis that miR-429 may be re-programmed at a later stage of the EMT process in a time-series pattern.
In conclusion, by integrating miRNA and gene expression microarray and network-based bioinformatics analysis, a dynamic miRNA and gene expression model specific to TNM stage has been developed. MiRNA studies, performed via a target gene network delineated by the relationship between miRNA and target using the parameters of network biology, suggested that miR-429 may be a crucial regulator in CRC progression. Low expression of miR-429 was correlated with poor prognosis for CRC. Taken together, miR-429 may potentially be a putative biomarker for CRC prognosis. These observations warrant further clinical and molecular evaluation in independent studies of CRC progression, with a view to effects on additional downstream targets and attendant gene function.
Footnotes
Acknowledgments
This study was supported by grants from National Science Foundation of China No. 81172300, No.81101509; Hunan Province Natural Sciences Foundations of Hunan Province No.12JJ2054. All authors made a significant contribution to conception and design, acquisition of data, and/or analysis and interpretation of data; drafting the article or revising it critically for important intellectual content; and approved the final version to be published. The views expressed are entirely the personal opinions of the authors.
Author Disclosure Statement
The authors declare that there are no conflicting financial interests.