




Abstract
Abstract
MicroRNAs play important roles in most biological processes, including cell proliferation, tissue differentiation, and embryonic development, among others. They originate from precursor transcripts (pre-miRNAs), which contain phylogenetically conserved stem–loop structures. An important bioinformatics problem is to distinguish the pre-miRNAs from pseudo pre-miRNAs that have similar stem–loop structures. We present here a novel method for tackling this bioinformatics problem. Our method, named MirID, accepts an RNA sequence as input, and classifies the RNA sequence either as positive (i.e., a real pre-miRNA) or as negative (i.e., a pseudo pre-miRNA). MirID employs a feature mining algorithm for finding combinations of features suitable for building pre-miRNA classification models. These models are implemented using support vector machines, which are combined to construct a classifier ensemble. The accuracy of the classifier ensemble is further enhanced by the utilization of an AdaBoost algorithm. When compared with two closely related tools on twelve species analyzed with these tools, MirID outperforms the existing tools on the majority of the twelve species. MirID was also tested on nine additional species, and the results showed high accuracies on the nine species. The MirID web server is fully operational and freely accessible at http://bioinformatics.njit.edu/MirID/. Potential applications of this software in genomics and medicine are also discussed.
Introduction
MicroRNAs originate from precursor transcripts (pre-miRNAs), which contain phylogenetically conserved stem–loop structures (Lai et al., 2003). An important bioinformatics problem is to distinguish the pre-miRNAs from pseudo pre-miRNAs that have similar stem–loop structures. A common approach to tackling this bioinformatics problem is to transform the classification of real and pseudo pre-miRNAs to a feature selection problem.
Lim et al. (2003) reported some characteristic features in phylogenetically conserved stem–loop pre-miRNAs. Lai et al. (2003) considered hairpin structures predicted by mfold (Zuker, 2003) as well as the nucleotide divergence of pre-miRNAs. Xue et al. (2005) decomposed stem–loop hairpin structures into local structure–sequence features, and used these features in combination with a support vector machine to classify pre-miRNAs. Bentwich et al. (2005) proposed a scoring function for pre-miRNAs with thermodynamic stability and certain structural features, which capture the global properties of the hairpin structures in the pre-miRNAs. Ng and Mishra (2007) employed a Gaussian radial basis function kernel as a similarity measure for 29 global and intrinsic hairpin folding attributes, and characterized pre-miRNAs based on their dinucleotide subsequences, hairpin folding, nonlinear statistical thermodynamics, and topology. Huang et al. (2007) evaluated features valuable for pre-miRNA classification, such as the local secondary structure differences of the stem regions of real pre-miRNA and pseudo pre-miRNA hairpins, and established correlations between different types of mutations and the secondary structures of real pre-miRNAs. More recently, Zhao et al. (2010) considered structure–sequence features and the double helix structure with free nucleotides and base-pairing features. In general, the quality of selected features directly affects the classification accuracy achieved by a method.
In this article, we present a novel method, named MirID, for pre-miRNA classification. MirID accepts as input an RNA sequence, and predicts as output whether the RNA sequence is a pre-miRNA or not. MirID employs a feature mining algorithm for finding combinations of features suitable for building pre-miRNA classification models. These models are implemented using support vector machines (SVMs) (Cortes and Vapnik, 1995; Fan et al., 2005), which are combined to construct a classifier ensemble. The accuracy of the classifier ensemble is further enhanced by the utilization of an AdaBoost algorithm (Bindewald and Shapiro, 2006; Freund and Schapire, 1997; Schapire, 1999).
The study reported here expands upon our previous work (Zhong et al., 2012) where we outlined the algorithms utilized by MirID. This comprehensive study includes (1) a complete flowchart describing our feature mining algorithm; (2) a larger data set containing twenty-one species, as compared to the eleven species previously analyzed (Zhong et al., 2012), and new sequences; (3) new feature values mined from these new sequences and hence new (SVM) classification models obtained from the new data; (4) a thorough experimental study for evaluating the performance and behavior of the MirID algorithms; (5) a web server for online access as well as a downloadable tool for local use; and (6) discussion of potential applications of the software in genomics and medicine.
Materials and Methods
Datasets
Real pre-miRNAs and pseudo pre-miRNAs were collected from twenty-one species, some of which were studied previously while others have not been explored. This collection is comprehensive, covering a variety of species, from viruses to humans. Table 1 summarizes the datasets. The training set and testing set have roughly the same number of sequences. For example, refer to Schmidtea mediterranea in the table. We used 72 pre-miRNAs as positive training sequences and 73 pre-miRNAs as positive testing sequences. In addition, we used 201 pseudo pre-miRNAs as negative training sequences and 202 pseudo pre-miRNAs as negative testing sequences.
We downloaded the pre-miRNAs from miRBase (http://www.mirbase.org/) (Kozomara and Griffiths-Jones, 2011). These pre-miRNAs had between 60 and 120 nucleotides (nt). The pre-miRNAs were folded into secondary structures using RNAfold (Hofacker, 2003). As in Xue et al.,(2005), we collected the pseudo pre-miRNAs from GenBank (http://www.ncbi.nlm.nih.gov/genbank/) by selecting short sequences, having between 60 and 120 nt, from the protein-coding regions of the twenty-one species in Table 1. The pseudo pre-miRNAs were chosen in such a way that they had properties (stem–loop structures and free energies) similar to the real pre-miRNAs.
Feature selection
We selected 74 features from a (real or pseudo) pre-miRNA sequence and its secondary structure. These features included the hairpin loop size (Griesmer et al., 2011; Wang and Wu, 2006), the free energy of the secondary structure, its normalized free energy (Spirollari et al., 2009), GC content, the number of bulge loops (Sewer et al., 2005; Xue et al., 2005; Zheng et al., 2006), combined features such as the ratio between the number of base pairs and the sequence length (Zheng et al., 2006), the average size of symmetric and asymmetric internal loops (Sewer et al., 2005), and triplets of structure–sequence elements (Xue et al., 2005).
Triplets contain three consecutive structure elements, which are bases or base pairs (Liu et al., 2005), as well as the nucleotide in the middle of the elements. For example, Figure 1 shows the sequence and structure of a hypothetical pre-miRNA and its dot-bracket notation. Consider the first three dots (bases) and their corresponding nucleotides AAA in Figure 1. The middle nucleotide is A. Thus, the structure-sequence elements “A …” constitute a triplet. As another example, consider the first three brackets (base pairs) and their corresponding nucleotides UUG in Figure 1. The middle nucleotide is U. Thus, the structure-sequence elements “U(((” constitute a triplet.

The sequence and structure of a hypothetical pre-miRNA and its dot-bracket notation.
MirID algorithms
Central to MirID is a combinatorial feature mining algorithm, which uses a bagging approach (Breiman, 1996) to randomly generate N combinations of features (feature sets) from the 74 features at hand. (The default of N is set to 100.) Each feature set contains between 1 and 150 features, randomly chosen with replacement from the 74 features. Each feature set is used to build a classification model, implemented using support vector machines (SVMs). The polynomial kernel in the LIBSVM toolkit (Fan et al., 2005) is used here for the SVM implementation, which achieves the best performance among all kernel functions available in the LIBSVM toolkit. Using the training and testing sequences in Table 1, the accuracy of each classification model is calculated. Classification models with accuracies less than a threshold t are eliminated. (The default of t is set to 0.8.) A classifier ensemble is constructed from the remaining classification models. This ensemble works by taking the majority vote from the individual classification models. The ensemble is continuously refined through an iterative procedure to get the best ensemble. The procedure increments t by a step value in each iteration. (The default of step is set to 0.005.)
One important function of the combinatorial feature mining algorithm is to perform merge and split operations on existing feature sets to generate new feature sets. Figure 2 illustrates how these operations work. In Figure 2, S1 contains 7 features and S2 contains 3 features. These two feature sets are merged to form S3, which contains 10 features. Then a number is randomly generated (we assume this number is “6” in this example), and 6 features are randomly selected from S3 and assigned to S’1, and the remaining 4 features are assigned to S’2. The new feature sets S’1 and S’2 are then used to build new classification models. Figure 3 presents details of our feature mining algorithm, whose output is the best classifier ensemble.

Illustration of the merge and split operations on two feature sets.
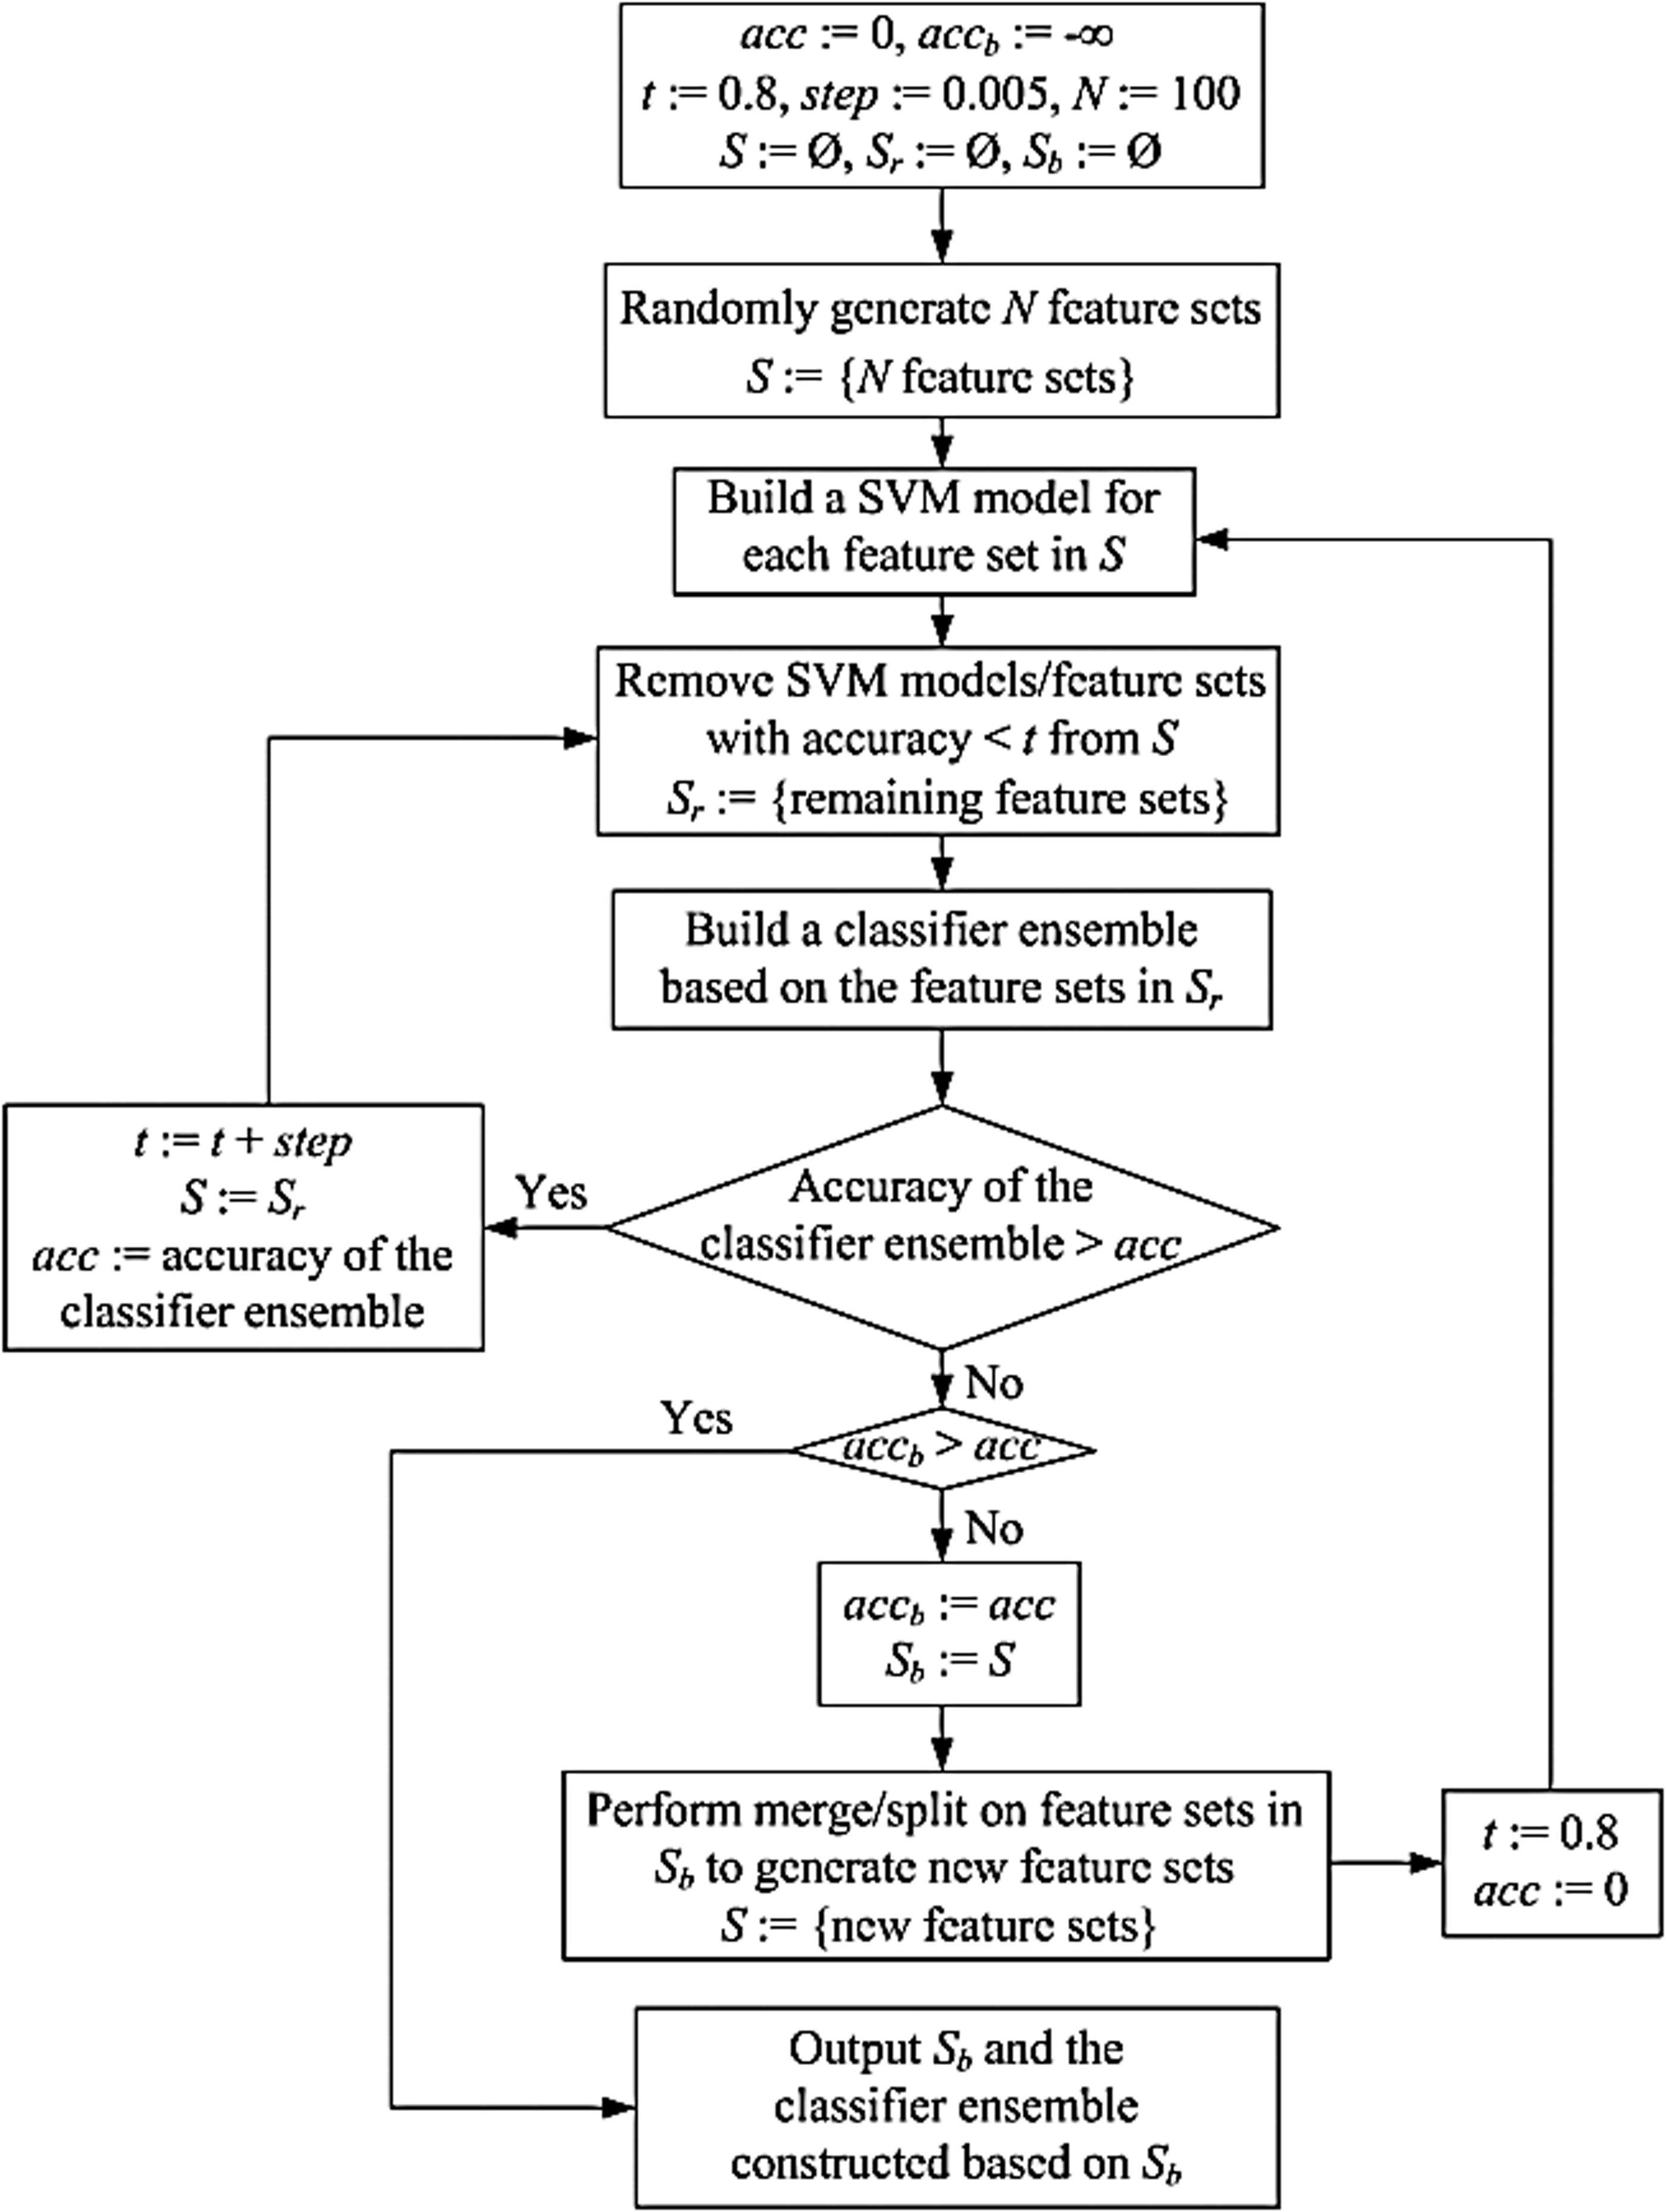
Algorithm for combinatorial feature mining.
We next applied AdaBoost (Bindewald and Shapiro, 2006; Freund and Schapire, 1997; Schapire, 1999) to the classifier ensemble, which is treated as a weak classifier and is continuously refined into a strong classifier through a procedure with K iterations. (The default of K is set to 20.) The strong classifier is able to predict whether an input RNA sequence is a pre-miRNA or not.
Results
Performance analysis of the MirID method
We carried out a series of experiments to evaluate the proposed MirID method. All the experiments were performed on a 2 GHz Pentium 4 PC having a memory of 2G bytes. The operating system was Cygwin on Windows XP and the algorithms were implemented in Perl. To understand the effect of boosting, we also considered using the combinatorial feature mining algorithm alone to classify pre-miRNAs, and referred to it as the CFM method.
We first evaluated how the number of initial feature sets, N, affects the performance of CFM and MirID. As N increases, more feature sets are generated initially. Thus, the feature mining algorithm constructs a classifier ensemble using more diverse feature sets. Hence the accuracy of the ensemble increases. On the other hand, as N increases, the inner loop in Figure 3 is run more times; as a consequence, the running time increases. MirID requires more time than CFM, due to the extra time spent in boosting. MirID in general is more accurate than CFM, indicating the benefit of including the AdaBoost algorithm.
We next evaluated how the threshold, t, used in the feature mining algorithm affects the performance of CFM and MirID. When t is very large (e.g., t>0.95), the accuracies of the methods drop sharply. This happens because the accuracies of most SVM classification models are less than 0.95 (i.e., 95%), and hence these SVM classification models are eliminated from further consideration early in the feature mining algorithm, cf. Figure 3. When t approaches 1, it is likely that the set Sb returned by the feature mining algorithm is an empty set, and therefore the classifier ensemble constructed based on Sb is also empty, yielding an accuracy of 0. As t increases, fewer feature sets qualify and the set Sr is smaller. As a result, the inner loop in Figure 3 is executed fewer times, and hence the running time decreases.
Then we evaluated how the value, step, used to increment the threshold t in each iteration of the inner loop in Figure 3 affects the performance of CFM and MirID. With the default values of N and t used in this study, the feature mining algorithm is able to produce a classifier ensemble with high accuracy. The value of step has little impact on the accuracies of the proposed methods. However, as step increases, fewer iterations of the inner loop in Figure 3 are executed, and as a consequence, the running time decreases.
We also conducted experiments to test different numbers of iterations, K, in the AdaBoost algorithm. It was found that when K is sufficiently large (e.g., K≥20), the behavior of the AdaBoost algorithm becomes stable, with the accuracy approaching 100%. On the other hand, when K is large, more running time will be needed.
Finally we compared CFM and MirID with two closely related methods, PMirP (Zhao et al., 2010) and TripletSVM (Xue et al., 2005). Table 2 shows the accuracies of these four methods on the twelve species available from the PMirP and TripletSVM web servers. The table shows that MirID is better than or as good as the existing tools on all the species except Gallus gallus and Oryza sativa. For Gallus gallus and Oryza sativa, PMirP achieves higher accuracies.
The unit of each number in the table is percentage (%).
The highest accuracy for each species is highlighted in boldface.
Web server
We have implemented MirID using Perl into a web server, accessible at http://bioinformatics.njit.edu/MirID. The web server accepts a testing sequence as input and classifies the testing sequence as a pre-miRNA or not. We pre-train our web server using the training sequences given in Table 1. In addition to the twelve species available from the PMirP and TripletSVM web servers (Xue et al., 2005; Zhao et al., 2010), we pre-train our web server using nine additional species (shown in Table 1 but not in Table 2). Our tool achieves high accuracies on these nine species, as shown in Table 3. (The PMirP and TripletSVM web servers were not pre-trained on these nine species, and hence we only show the results for CFM and MirID here.) MirID is more accurate than CFM, due to the AdaBoost algorithm.
The unit of each number in the table is percentage (%).
The highest accuracy for each species is highlighted in boldface.
Table 4 shows, for each species in Table 1, the number of feature sets produced by our feature mining algorithm. Table 5 shows the CPU time (in seconds) spent in pre-training the MirID web server. The training time depends on the number of feature sets, the number of features in each feature set, the number of iterations used by the feature mining algorithm, and the number of iterations used in the AdaBoost algorithm. Notice that this training is done once, and no more training is needed on the testing data. It takes less than a second to classify an unlabeled testing sequence.
Discussion
The MirID method was shown experimentally to be better than two existing tools, PMirP and TripletSVM, for the majority of the twelve species analyzed with these two tools. For nine additional species, MirID also performed well. The good performance of the MirID method is due to its novel feature mining and AdaBoost algorithms.
Both the feature mining and AdaBoost algorithms contain user-specified parameters. As indicated by our experimental results in the performance analysis section, changing these parameter values may affect the running time and accuracy of our method. The MirID web server adopts the default parameter values as used in this study, to achieve good and stable performance. The server is able to process sequences of a variety of species, from viruses to humans. It does not include bacteria, however. While there are small regulatory RNAs in bacteria, bacteria do not have true miRNAs (Gottesman, 2005; Tjaden et al., 2006). Bacterial miRNA will be added to our server when such data is validated and becomes available in public databases.
Currently, the MirID web server is capable of classifying one testing sequence at a time, predicting whether the testing sequence is a pre-miRNA or not. When multiple testing sequences must be classified, we suggest that the user run the tool locally in a batch mode. Instructions for downloading the tool and running the tool locally can be obtained from http://bioinformatics.njit.edu/MirID-download.
MicroRNAs play important roles in most biological processes, including cell proliferation, tissue differentiation, and embryonic development, to name a few (Aukerman and Sakai, 2003; Brennecke et al., 2003; Bushati and Cohen, 2007; Johnston and Hobert, 2003; Tang et al., 2009; Xu et al., 2009). They interact with target mRNAs at specific sites to induce cleavage of the message or inhibit translation (John et al., 2004). They can have multiple mRNA targets as they bind to the targets with partial complementarities in animals. In addition, an mRNA target can be regulated by multiple miRNAs at different loci with different effects. This adds to the complexity of finding out the mRNA targets in genomes (John et al., 2004).
The total number of microRNA discovered continues growing every day. According to the latest miRBase release (version 19, August 2012), accessible at http://www.mirbase.org, there are 2019 unique mature human miRNAs up from 894 in the version 14. There seems to be a correlation between the tissue specificity of a human miRNA and the number of diseases with which the miRNA is associated (Lu et al., 2008). The fact that microRNAs are found circulating in blood (Mitchell et al., 2008; Schöler et al., 2011) holds great promise for the development of diagnostic tools that can be used in multiple ways, from noninvasive pregnancy diagnostic tests to cancer diagnostics and treatment. A tool like MirID for predicting pre-miRNAs will contribute to our basic understanding of the roles played by microRNA in regulating many biological processes, and their contribution to disease development and progression.
A potential application for the MirID tool is in the area of individualized genomic analysis. With the advent of high-throughput sequencing technologies, millions of short reads can now be generated from a library of nucleotide sequences. These technologies have catalyzed a new era of personalized medicine based on individualized genomic analysis (Anderson and Schrijver, 2010). Determining levels of known and novel microRNA from small RNA sequencing data is an important subject in this new era (An et al., 2013). With next-generation sequencing platforms, several prostate-expressed microRNAs related to prostate cancer have been identified (Martens-Uzunova et al., 2012; Ostling et al., 2011; Ribas et al., 2009; Wang et al., 2011; Watahiki et al., 2011). As a consequence, exploring microRNAs and their functions continues to be a highly active area of research. The MirID tool developed from this work can be used to assess aggregated RNAseq reads for pre-miRNA secondary structure potential. The tool can be combined and integrated with other miRNA profiling tools (Friedlander et al., 2012; Hackenberg et al., 2011; Hendrix et al., 2010; Mathelier and Carbone, 2010) for applications to personalized medicine. We plan to investigate the integration of these tools and evaluate the effectiveness of the integrated pipeline system in the future.
Footnotes
Acknowledgments
We thank the reviewers for their thoughtful comments and constructive suggestions. This research was supported in part by the Intramural Research Program of the NIH, National Cancer Institute, Center for Cancer Research. The current findings were presented in part in preliminary form in the Proceedings of the 2012 IEEE International Conference on Bioinformatics and Biomedicine (Zhong et al.,  ).
).
Author Disclosure Statement
The authors declare that no conflicting financial interests exist.