




Abstract
Abstract
Hepatocellular carcinoma is the fifth most common cancer and the third leading cause of cancer-related deaths worldwide. The efficacy of novel combination treatments are increasingly evaluated with use of integrative biology research and development (R&D) strategies and methodological triangulation. We investigated the anti-tumor effect of ɛ-viniferin alone, and the putative synergy of ɛ-viniferin with vincristine on the growth of HepG2 cells in vitro. Growth inhibition and apoptosis induction were determined by MTT assay and annexin V/propidium iodide (PI), respectively. Morphological changes and DNA fragmentation were investigated under electron microscopy and by agarose gel electrophoresis, respectively. The results collectively showed that treating cells with ɛ-viniferin and vincristine significantly inhibited cell viability at lower doses as compared to each agent applied alone. IC50 values for ɛ-viniferin and vincristine were determined as 98.3 and 52.5 μM at 24 h, respectively. IC50 value of ɛ-viniferin in combination with vincristine was 15.8+11.25 μM (mean/SD) at 24 h. The viability of cells treated with 17.9 μM vincristine alone for 24 h was 79.62%; it reduced to 26.53% when 25 μM ɛ-viniferin was added in combination with vincristine (p<0.05). We found that combination of drugs promoted the sensitivity of cells against to vincristine treatment. The effect of combined use was in support of a synergistic pharmacodynamic effect. Moreover, low doses of the combination regimen induced phosphatidyl re-localization, morphological changes, and DNA fragmentation, and therefore caused apoptotic death. This study thus suggests that low concentrations of ɛ-viniferin and vincristine can enhance the anti-tumor effects efficiently by inducing HepG2 cell apoptosis. Further studies in other model systems are warranted with a view to potential future applications in the clinic of such combination regimens and their putative mechanism of action in the observed synergy reported here.
Introduction
H
Vincristine is effective against a wide range of cancer types due to interference with the mitotic spindle apparatus, causing cell death in mitosis (Phalen et al., 2013). Studies show that vincristine, an antimicrotubular drug, is used as in vitro in the HepG2 cell line (Jaszewska et al., 2010; Sun et al., 2009; Xu et al., 2011).
Many anticancer drugs have strong cellular cytotoxicity and side effects, indicating that strong anti-cancer drugs that have minimal or no cytotoxicity and side effects need to be developed, and would be highly desirable (Chung et al., 2004).
Dietary phytochemicals such as adjuvants have been suggested to play important roles in enhancing chemotherapeutic potential, owing to multitargeted chemopreventive properties and lack of substantial toxicity (Lee et al., 2013). ɛ-Viniferin is an antioxidant and formed from resveratrol by oxidative processes (Zghonda et al., 2011). Hepatoprotective and antioxidant properties and the ability to induce the apoptosis of leukemia B cells have been demonstrated for ɛ-viniferin (Santamaria et al., 2012).
Resveratrol and its oligomers, including ɛ-viniferin, have also been suggested to show anti-proliferative and pro-apoptotic effects on cancer cells such as human hepatoma HepG2 cells, and human colon cancer cells (Colin et al., 2008; Zghonda et al., 2011).
To increase the effectiveness of the stimulation of apoptosis in HepG2 cancer cells, it is aimed to combine the use of viniferin, an antioxidant, and vincristine, a chemotherapeutic drug. For this purpose, the synergistic effect of drugs after being used as alone or combined is determined and the levels of morphological and early or late apoptosis levels formed in HepG2 cell line are studied.
Material and Methods
Cell cultures and reagents
The human hepatocellular carcinoma cell line (HepG2) was obtained from the German Collection of Microorganisms and Cell Culture (DSMZ) (Leibniz Institute, Germany) and maintained in DMEM medium (Sigma, Germany), which was supplemented with 10% FBS (Gibco, UK), 100 U/mL penicillin/streptomycin, and 2 mM L-glutamine. Exponentially growing cultures were maintained in an incubator with a humidified atmosphere with 5% CO2/95% air at 37°C. Vincristine sulfate was purchased from Sigma-Aldrich (Germany), ɛ-viniferin was from Actichem (Montauban, France).
Cell viability
HepG2 cell viability was assessed by a tetrazolium dye method (3-(4,5-dimethylthiazol-2-yl)-2,5-diphenyl-2H-tetrazolium bromide, MTT), which is based on the ability of viable cells to convert from soluble yellow tetrazolium salt to blue formazan crystals (Mosmann, 1983). Briefly, cells (2×10⁴ cells/well) were seeded in 96-well plates. After 2 h of incubation, cells were treated with vincristine (8.95–286.5 μM) and ɛ-viniferin (12.5–400 μM), alone or in combination (4.48+6.25–143.2+200 μM). The cells were also treated with etoposide in various concentrations as a different chemotherapeutic agent. After 24 or 48 h of incubation time, 20 μL of 5 mg/mL MTT was added to each well, followed by incubation for an additional 2 h. The medium was removed and 200 μL of DMSO was added to dissolve formazan crystals. The absorbance of the wells were measured at 540 nm using a microplate reader (Bio-Tek, ELX 808 IU). The signal generated is directly proportional to the number of viable (metabolically active) cells in the wells. The values of the blank wells were subtracted from each well of treated and control cells.
Isobologram test
An isobologram test was used for determining whether the drugs combination effects either synergistically or antagonistically. We used multiple drug effect/combination isobologram analysis to study the efficacy of vincristine plus ɛ-viniferin combinations tested against the HepG2 cell line. The isobologram analysis evaluates the nature of the interaction of two drugs, for example, drug A and drug B at a given effect level. Operationally, the concentrations required to produce the given effect (e.g., IC50) are determined for drug A (ICx, A) and drug B (ICx, B) and indicated on the x and y axes of a two-coordinate plot, forming the two points (ICx, A, 0) and (0, ICx, B). The line connecting these two points is the line of additivity. Then, the concentrations of A and B contained in combination that provide the same effect, denoted as (CA, x, CB, x), are placed in the same plot. Synergy, additivity, or antagonism is indicated when (CA, x, CB, x) is located below, on, or above the line, respectively (Fraser, 1872).
Transmission electron microscopic observation (TEM)
After treatments with vincristine and ɛ-viniferin, alone or in combination, HepG2 cells were fixed in 2.5% (v/v) glutaraldehyde in 0.1 M phosphate buffer (pH 7.4), and left in PBS overnight at 4°C and treated with 2% (w/v) osmium tetraoxide. The cells were dehydrated gradually with 70, 90, 96, and 100% ice-cold ethanol, embedded in EPON 812 epoxy. They were thin-sectioned using a glass knife to a maximum thickness of 100 nm. The sections were stained with lead citrate and uranyl acetate and finally observed and recorded under a transmission electron microscope (FEI TECHNAI SPIRIT 120KV) (Johnson, 1979).
Apoptosis detection by staining with annexin V-FITC and propidium iodide
HepG2 cells (2×10⁶ cell/mL) were seeded 25 cm2 flask and treated with a dose of 50% mortality (IC50) and half of the dose of 50% mortality (IC50/2) of drugs. The cells were treated with either etoposide (IC50—55 μM and IC50/2—27 μM), vincristine (IC50—52.5 μM and IC50/2—26 μM), ɛ-viniferin (IC50—98.3 μM and IC50/2—49) alone or combination of ɛ-viniferin and vincristine (IC50—15.8+11.25 μM and IC50/2—7.9+5.6 μM, respectively) for 24 h. The cell suspensions were centrifuged and the pellets were washed twice with cold PBS. After that, the cells were re-suspended in binding buffer and 100 μL of cell suspension was stained with 5 μL of annexin V-FITC solution and 5 μL propidium iodide (PI) solution for 15 min at room temperature in the dark. Then, the cells were diluted with 400 μL of binding buffer and analyzed on a Becton–Dickinson FACS Aria flow cytometer using FACSDiva Version 6.1.1. software. At least 10,000 cells were analyzed per sample. The fraction of cell populations in different quadrants was analyzed using quadrant statistics. The X- and Y-axes indicate the fluorescence of annexin-V (green) and PI (red), respectively. Quadrant settings were based on the control cells (without treament).
DNA isolation and agarose gel electrophoresis
2×10⁶ cell/mL cells were grown in Petri dishes and incubated with etoposide (dose of 80% cell viability—7 μM, IC50—55 μM and higher dose—165 μM), vincristine (dose of 80% cell viability—6 μM, IC50—52.5 μM and higher dose—105 μM), ɛ-viniferin (dose of 80% cell viability—80 μM, IC50—98.3 μM and higher dose—196.6 μM) or combination of ɛ-viniferin and vincristine (dose of 80% cell viability—3.75+3.62 μM, IC50—15.8+11.25 μM and higher dose—31.6+22.5 μM, respectively) for 24 and 48 h. Control plates were also made with 0.05% DMSO at a similar period of time. After respective incubation times, cells were harvested by scraping and washed with PBS. Cells were then re-suspended in 200 μL binding/lysis buffer and incubated for 10 min at room temperature. The supernatant was kept after centrifugation at 13,000 rpm for 10 sec and mixed in DNA extraction buffer (10 mM Tris–HCl, 150 mM NaCl, 10 mM EDTA–NaOH, and 0.1% SDS, pH 8.0) on ice. After treatment of the homogenate with RNase (20 μg/mL, 37°C, 30 min) and proteinase K (100 μg/mL, 50°C, 60 min), DNA was extracted using a standard phenol–chloroform and chloroform extraction method. 3 μg of DNA were subjected to electrophoresis at 75 V for 1 h in 1.2% agarose gel stained with ethidium bromide. Separated DNA fragments were viewed under UV light (Kodak, UK).
Statistical analysis
MTT results are expressed as mean±standard deviation and were statistically analyzed using one-way ANOVA and –Tukey test.
Results
Synergy between ɛ-viniferin and vincristine on human hepatoma cells (HepG2)
The effects of ɛ-viniferin
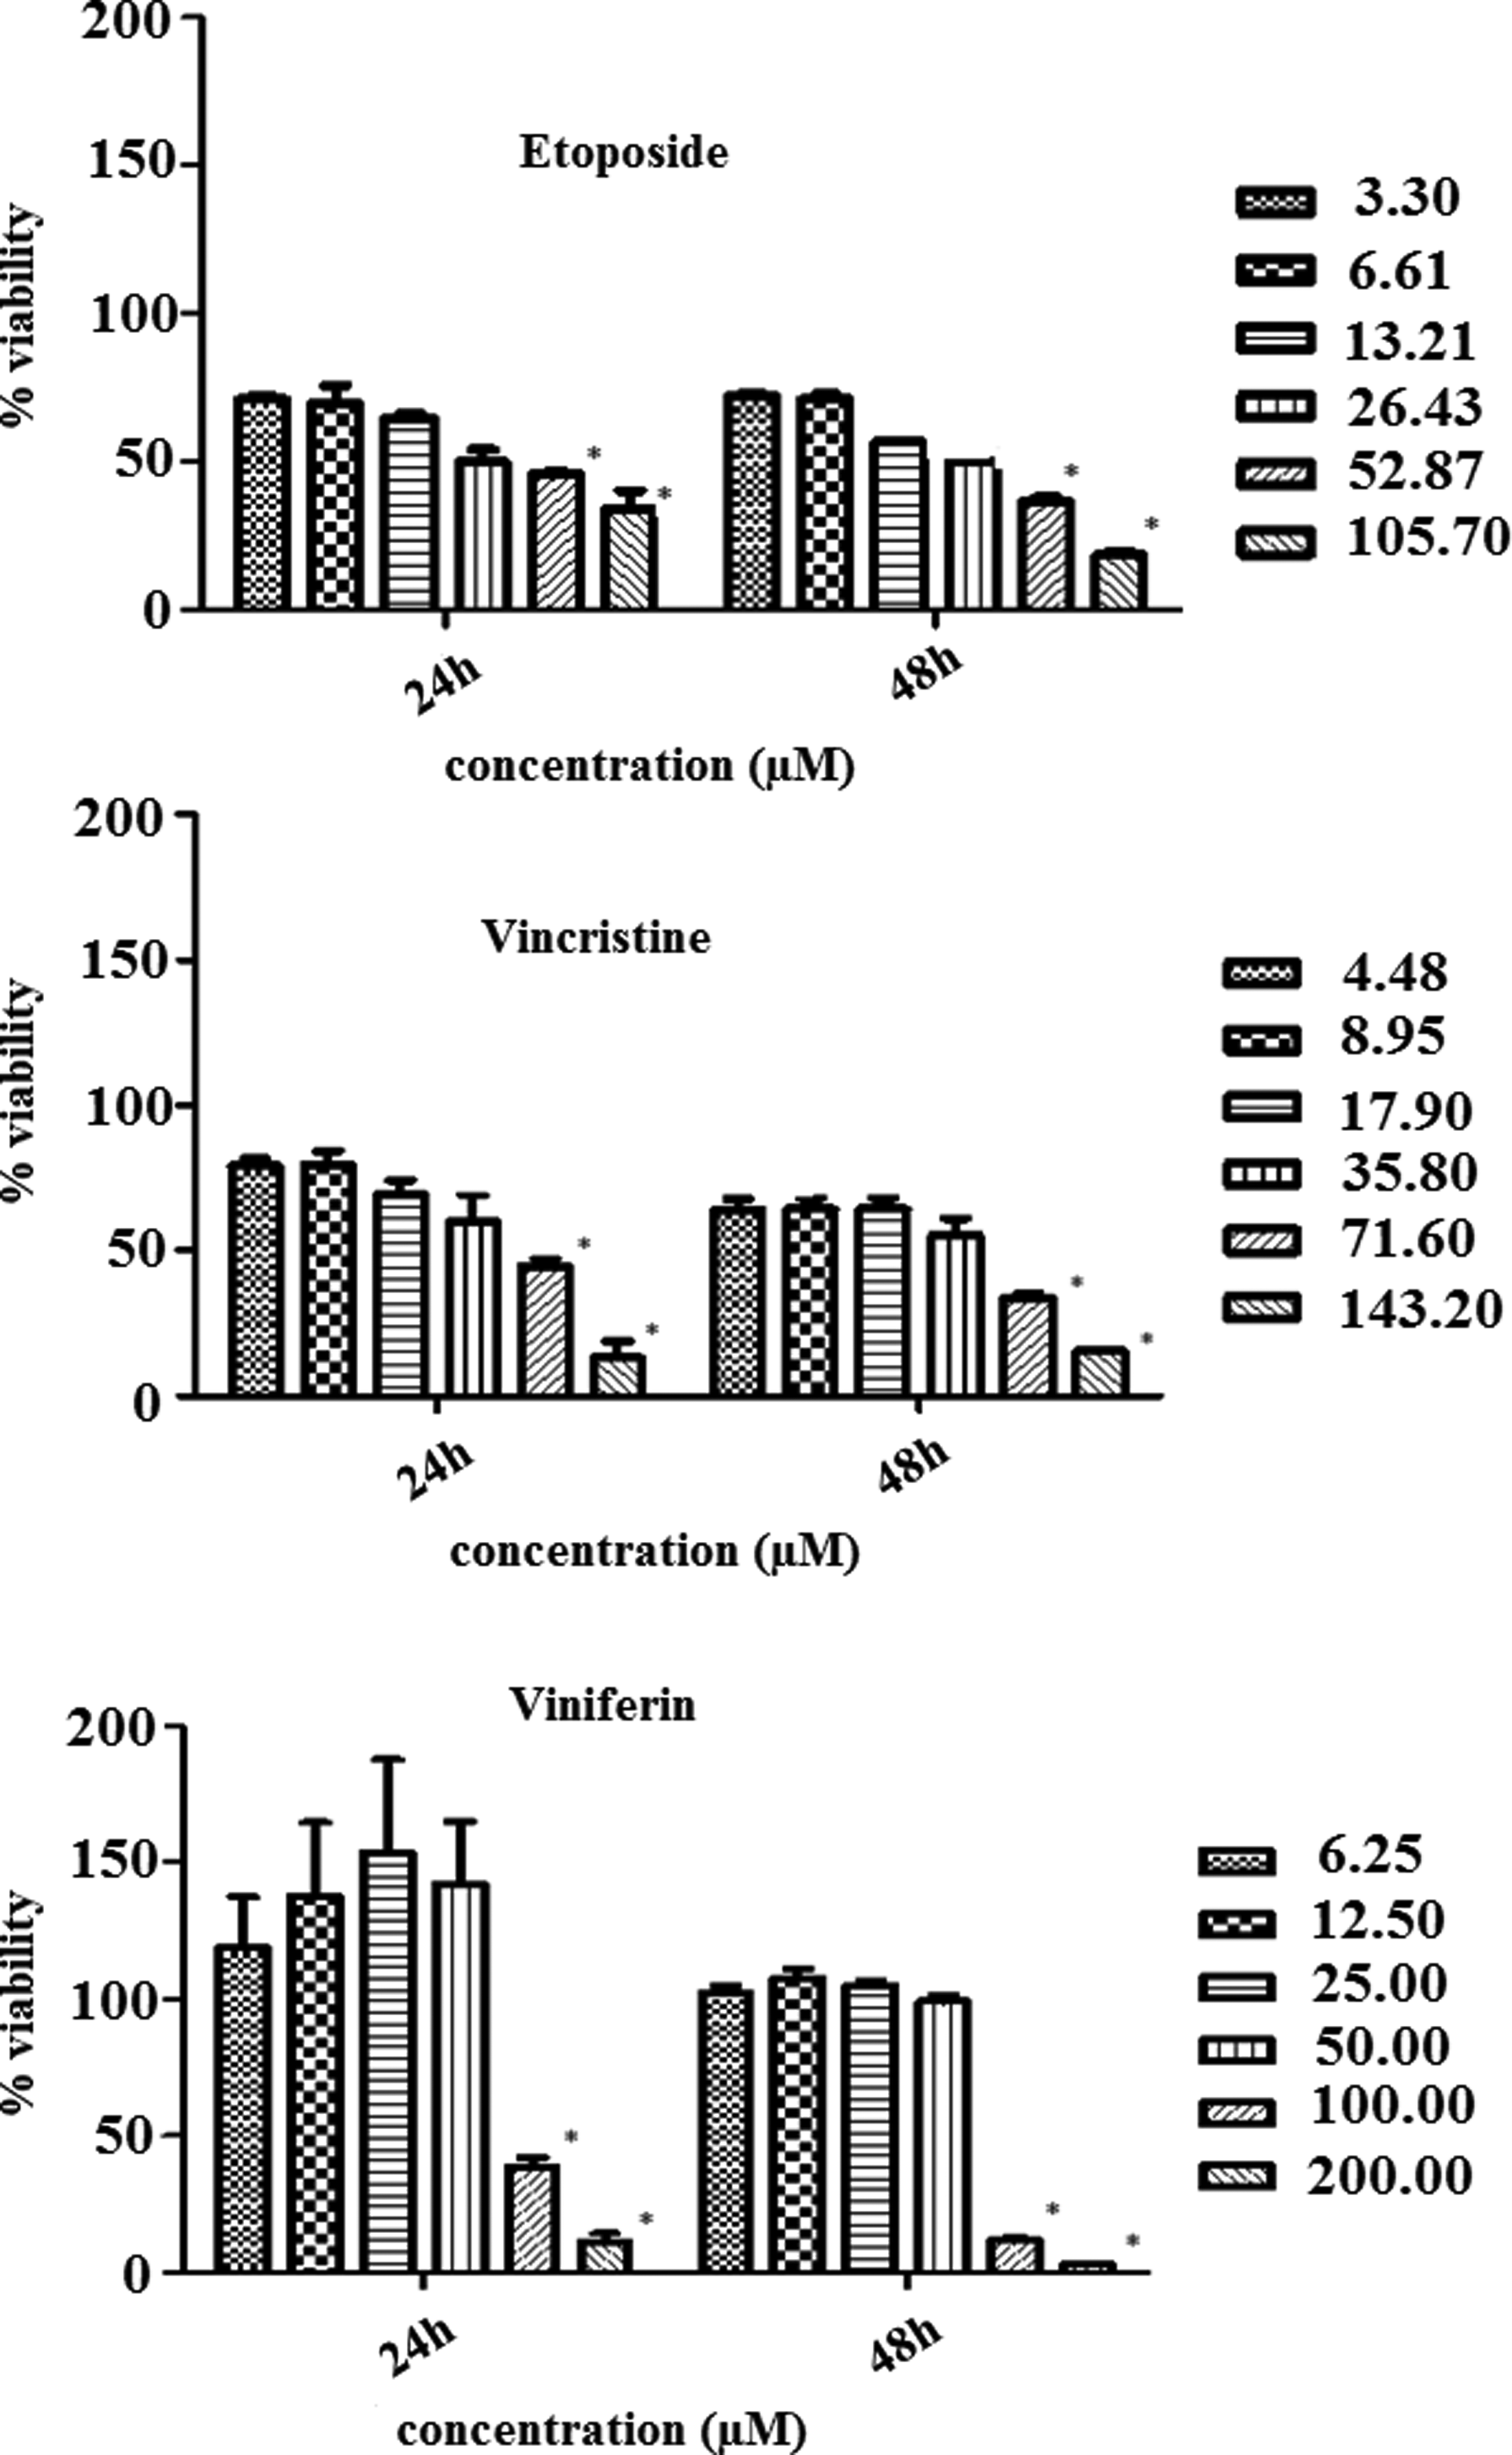
Treatment of HepG2 cells with either etoposide, vincristine, or ɛ-viniferin decreased the cell viability in a dose-dependent manner. The cells were cultured and treated with the compounds as described in Materials and Methods. Each experiment was done in triplicate. Bars indicate mean±standard deviation. All comparisons were made relative to untreated control cells (100 % cell viability). The significant differences were indicated as p<0.05 using one-way ANOVA.

HepG2 cell viability was inhibited at lower doses of combination of ɛ-viniferin and vincristine at 24 and 48 hours. Each experiment was done in triplicate. Bars indicate mean±standard deviation. All comparisons were made relative to untreated control cells (100% cell viability). The significant differences were indicated as p<0.05 using one-way ANOVA.
We investigated whether the addition of ɛ-viniferin with vincristine to HepG2 cells had any benefits, so that cells were incubated with various concentrations of the combination of ɛ-viniferin and vincristine for 24 and 48 h. As shown in Figure 2, a significant decrease of cell viability was observed in cells treated with a combination of ɛ-viniferin and vincristine, than ɛ-viniferin or vincristine alone-treated HepG2 cells. The viability of cells treated with 17.9 μM vincristine alone for 24 h was 79.62%; it reduced to 26.53% when 25 μM ɛ-viniferin was added in combination with vincristine (p<0.05). IC50 value of ɛ-viniferin in combination with vincristine was 15.8+11.25 μM at 24 h, respectively. In instances where incubation was combined with a drug for 48 h, the cell viability was increased slightly except 17.90+25 of [vincristine+viniferin] incubation.
The results indicated that when treating the HepG2 cells with ɛ-viniferin combined with vincristine, the IC50 value of combination for HepG2 cells were shifted 15.8+11.25 μM at 24 h.
Using the dose range in Figure 2, a normalized isobologram was created (Fig. 3). IC50 doses of combination of ɛ-viniferin and vincristine (15.8 and 11.25, respectively, at 24 h) are well below this line of additive, showing that treatment of HepG2 cells with ɛ-viniferin in combination with vincristine caused a synergistic effect.
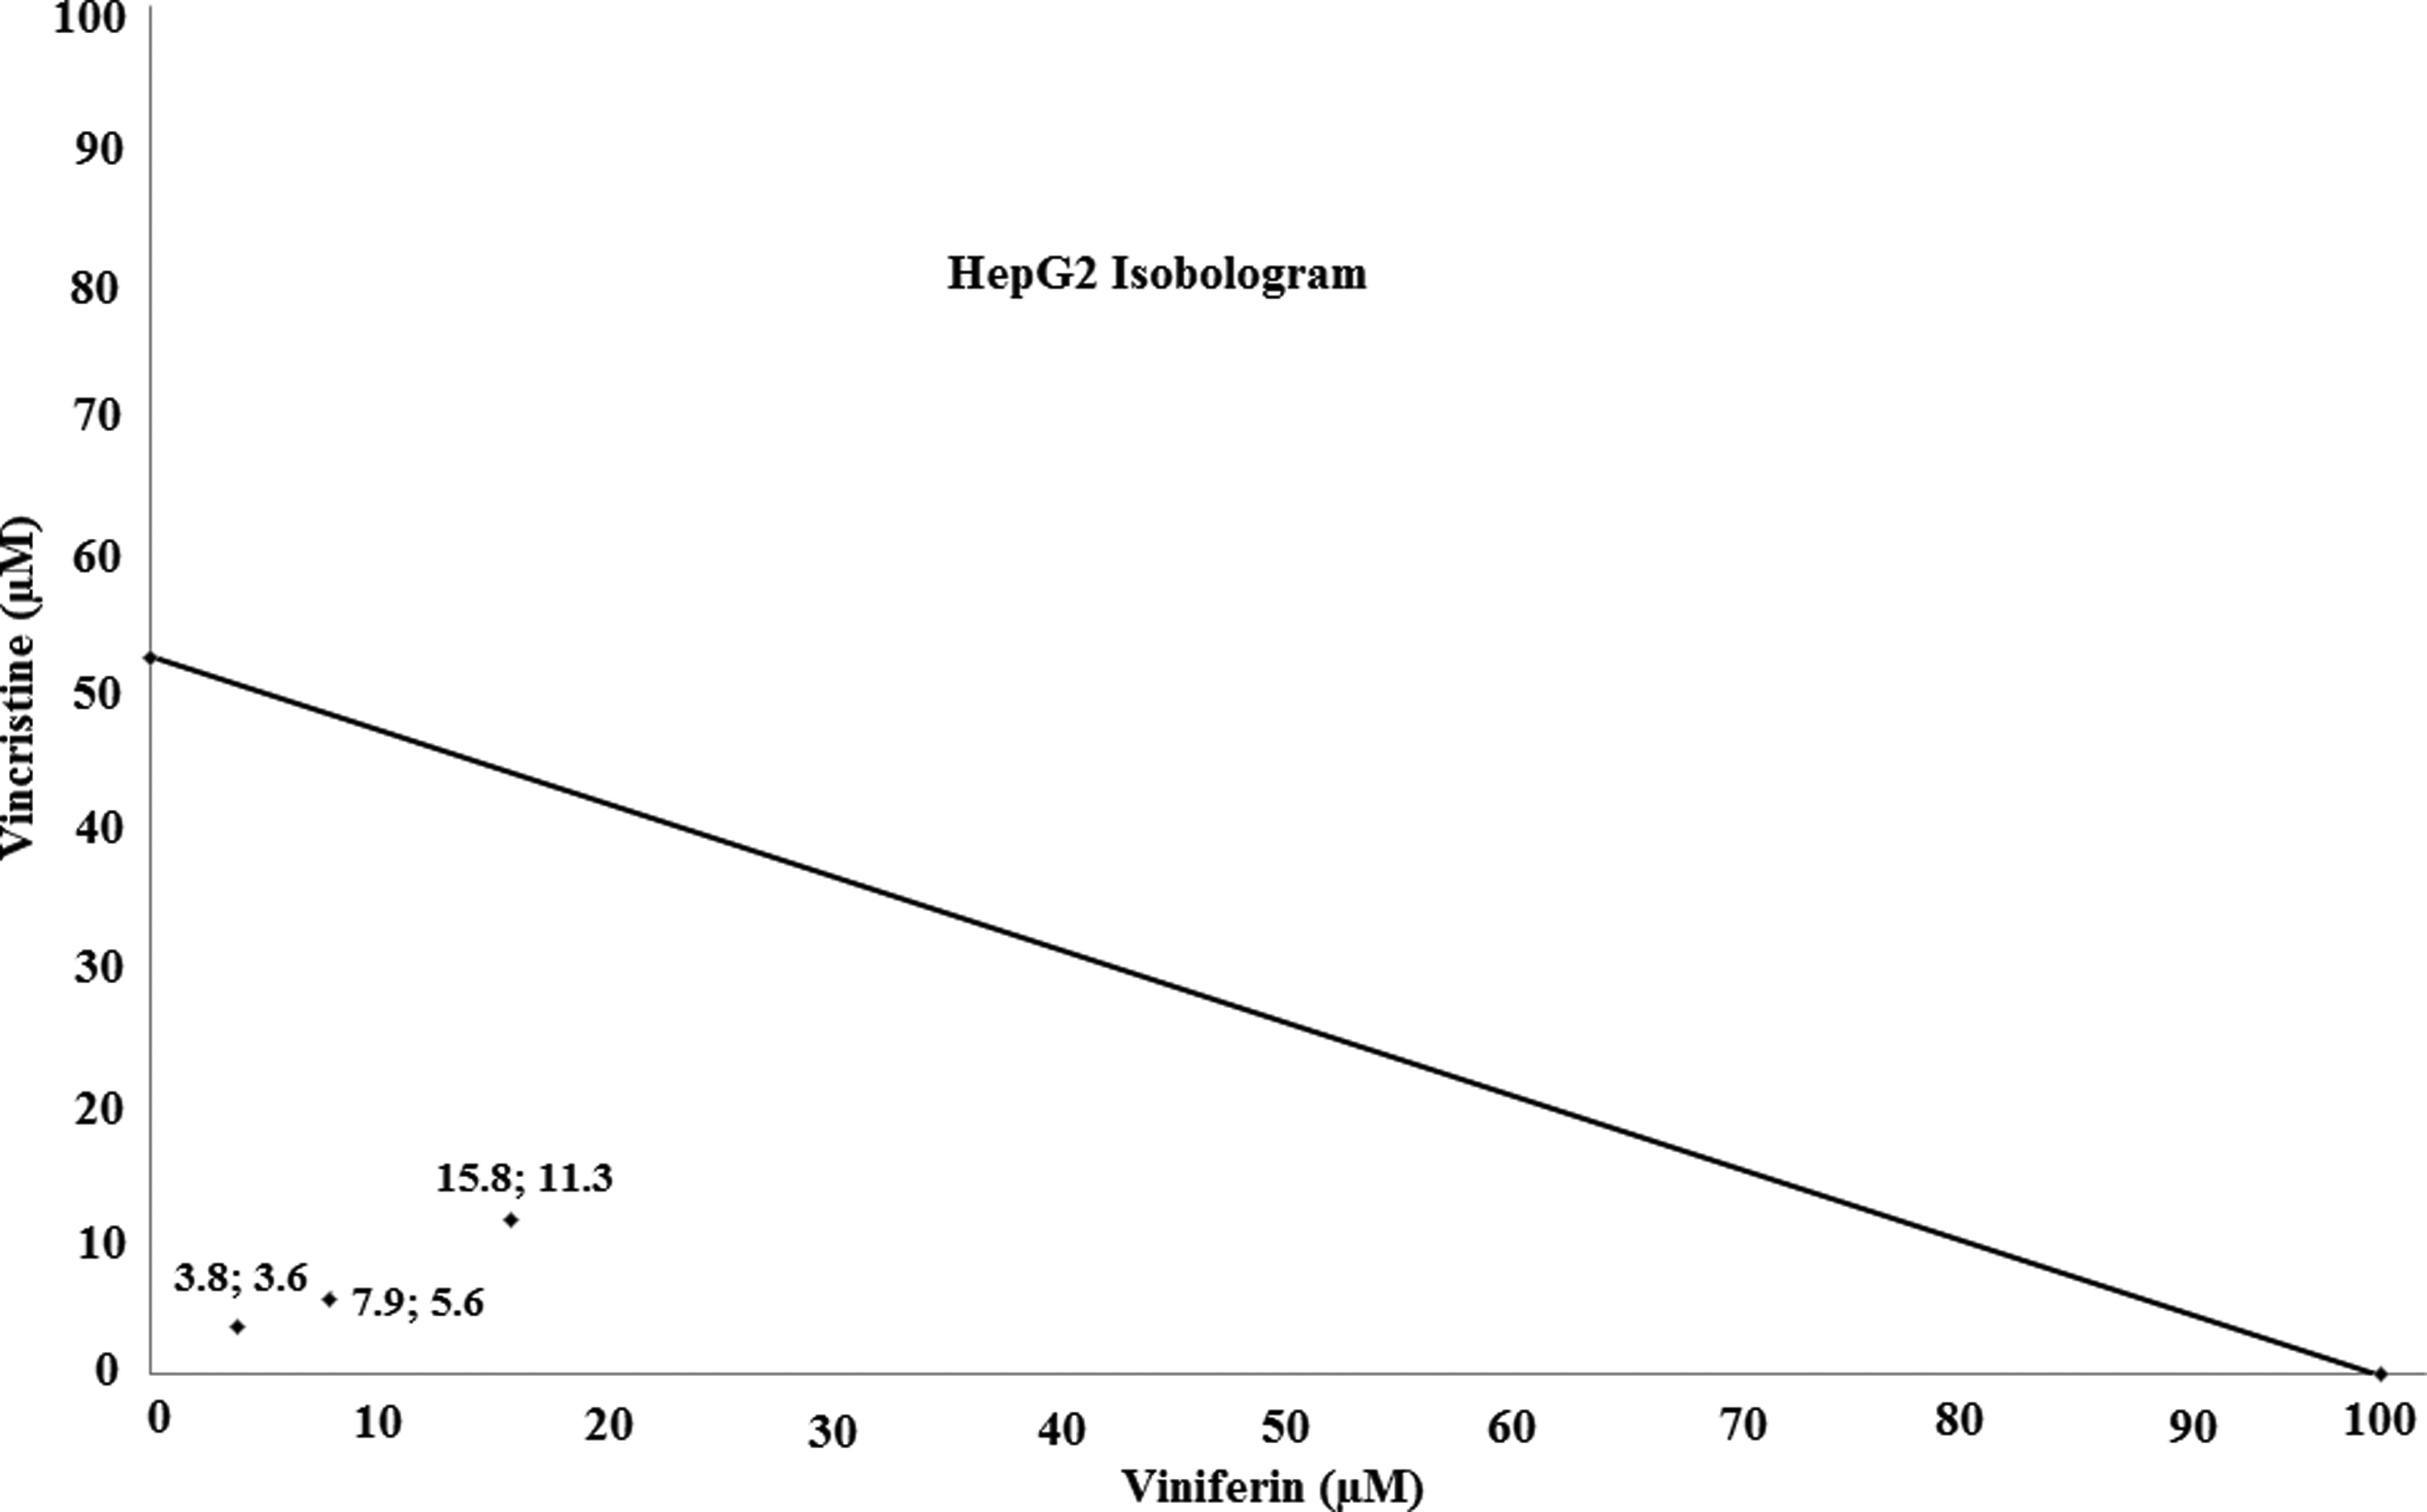
Isobologram for synergism effects of ɛ-viniferin in combination with vincristine. The dose of ɛ-viniferin alone is 98.3 and vincristine alone 52.5 mM. Diagonal line is the line of additivity. Experimental data points, represented by dots located below line, indicate synergism.
For further experimental studies, IC50 doses as well as lower doses (7.9 μM ɛ-viniferin and 5.6 μM vincristine) of combination was determined to be used.
Morphology changes observed by transmission electron microscopy (TEM)
To explore whether a decrease in cell viability induced by ɛ-viniferin and vincristine is due to induction of cell apoptosis, we analyzed morphological changes in HepG2 cells after treatment with both drugs. The subcellular changes induced by 98.3 μM ɛ-viniferin, 52.5 μM vincristine alone, or 15.8 μM ɛ-viniferin in combination with 11.25 μM vincristine in HepG2 cells were investigated by transmission electron microscopy. In Figure 4, the untreated control cell group shows the cellular organelles of normal cells. Increased lipid production in the cell and irregularities in the structure of chromatin were observed when incubated with 98.3 μM ɛ-viniferin (Fig. 4A,B). The cells treated with 52.5 μM vincristine caused various swollen mitochondria, indicating that mitochondria in the cells had been severely damaged and after all induced cell death. It was observed clearly that after the treatment of cells with the combination of 15.8 μM ɛ-viniferin and 11.25 μM vincristine-triggered multi-cellular organelle dysfunction, there was a loss of the integrity of the endoplasmic reticulum and reduction of the nuclear/cytoplasmic in the cells (Fig. 4A,B).
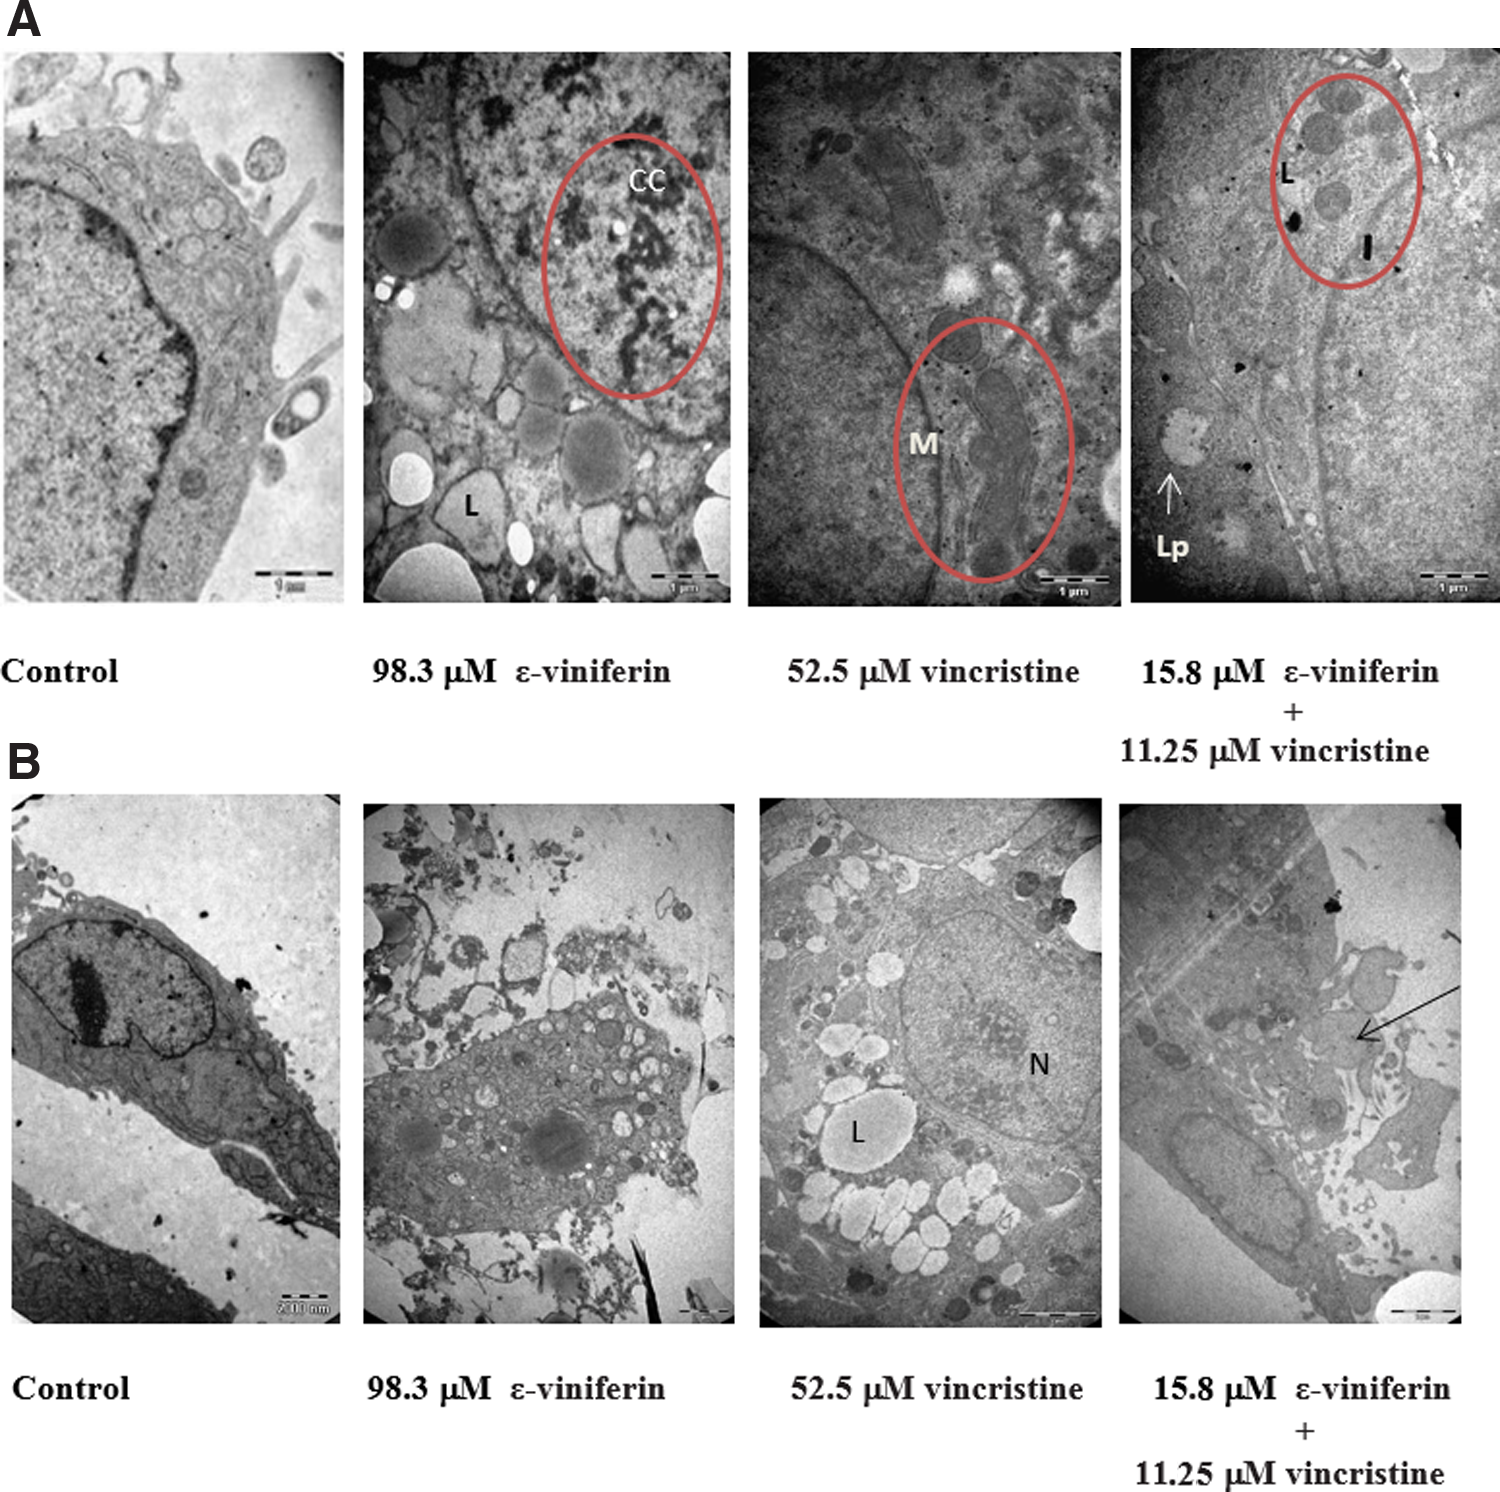
Cell morphological changes under transmission electron microscope (X 16,500). Under electron microscope, the morphological changes of HepG2 cells were observed after treatment of ɛ-viniferin, vincristine alone, or the combination of both drugs for 24 hours, including swollen mitochondria, condensed chromatins, degraded structure of the endoplasmic reticulum. CC, chromatin condensation; L, lysosomes; Lp, lipid; M, mitochondria
Measurement of annexin-V by flow cytometry
To investigate the effects of combined use of ɛ-viniferin and vincristine on apoptosis, HepG2 cells were treated with ɛ-viniferin and vincristine, alone or in combination. The experimental concentrations of drugs were chosen according to MTT assay that were either IC50 doses or half dose of IC50. The results of annexin-V and PI double staining indicated that the apoptotic rate of HepG2 cells was induced after treatment with a half dose of IC50 combined use of ɛ-viniferin (7.9 μM) and vincristine (5.6 μM) as compared to control and alone use of drugs (Figs. 5 and 6). ɛ-Viniferin enhanced the apoptotic effects of vincristine on HepG2 cell apoptosis at a lower concentration.
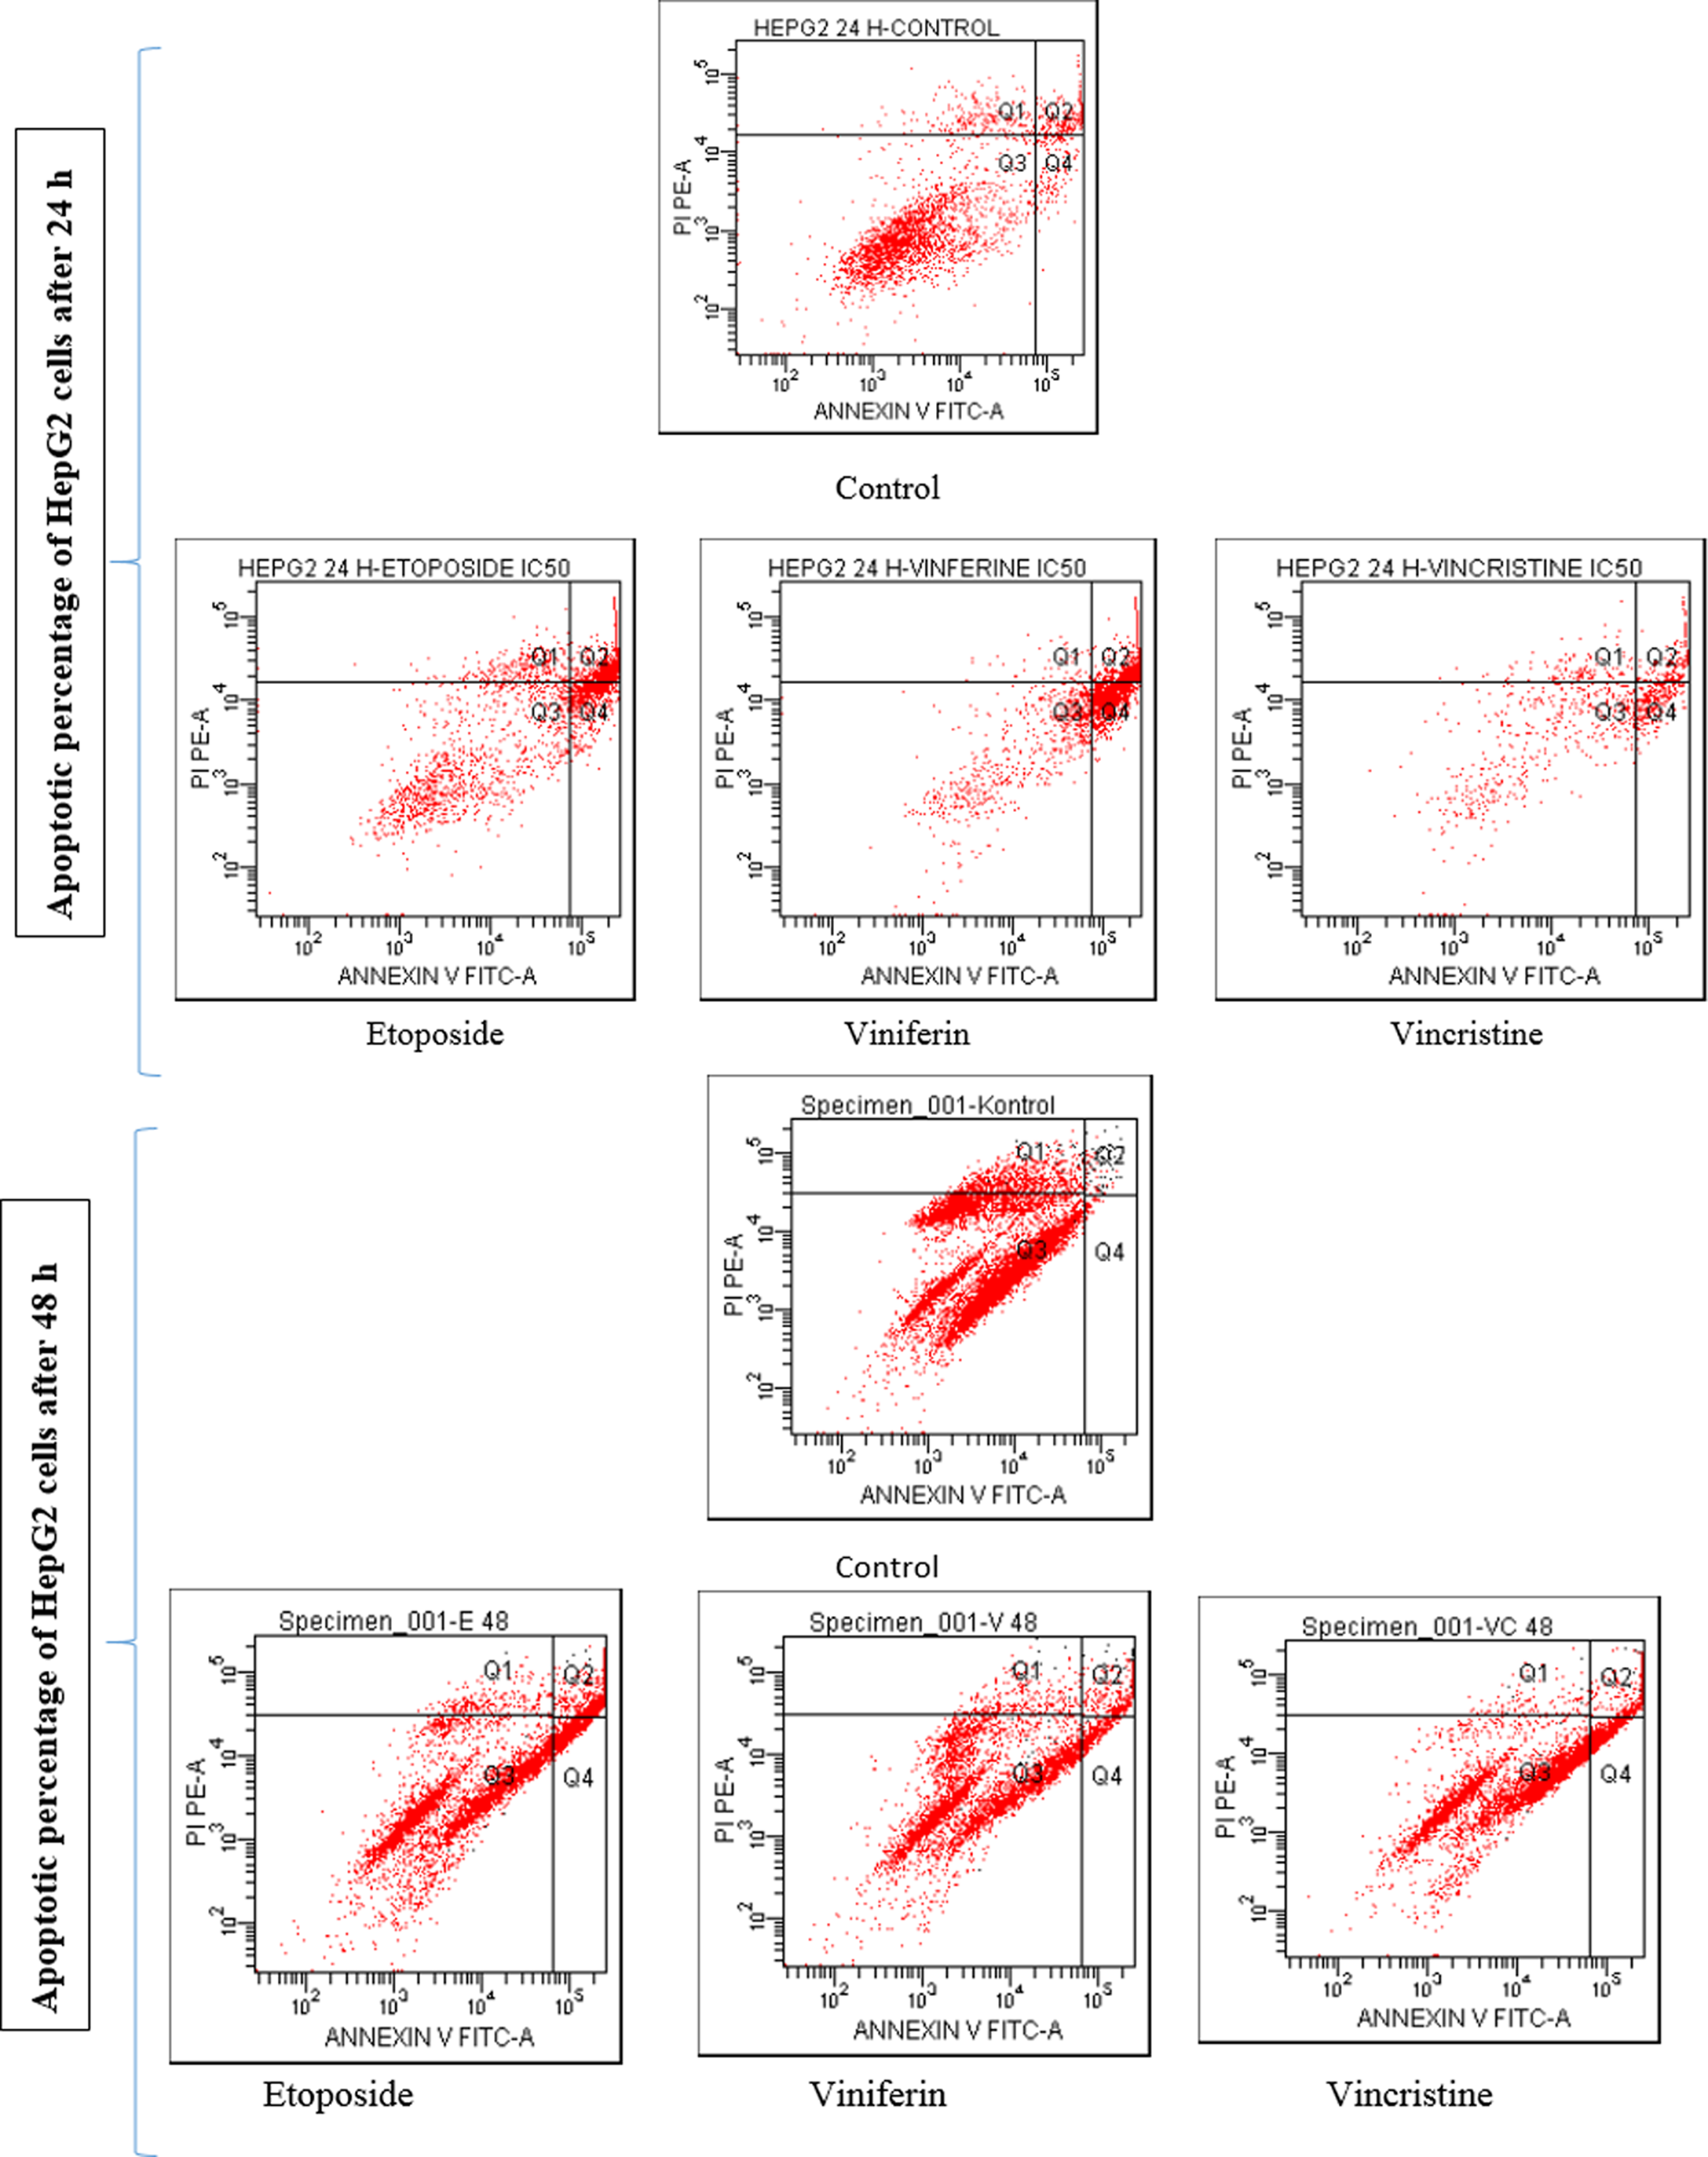
Apoptotic percentage of HepG2 cells after inducing with ɛ-viniferin and vincristine, alone for 24 and 48 hours. Phosphatidylserine expressing cells were detected by annexin V-binding. Four distinct phenotypes were distinguishable: viable (annexin-V−/PI−, Q3), early apoptotic (annexin-V+/PI−, Q4), late apoptotic (annexin-V+/PI+, Q2), and necrotic/damaged cells (annexin-V−/PI+, Q1). Experiments were repeated two times to ensure reproducibility.
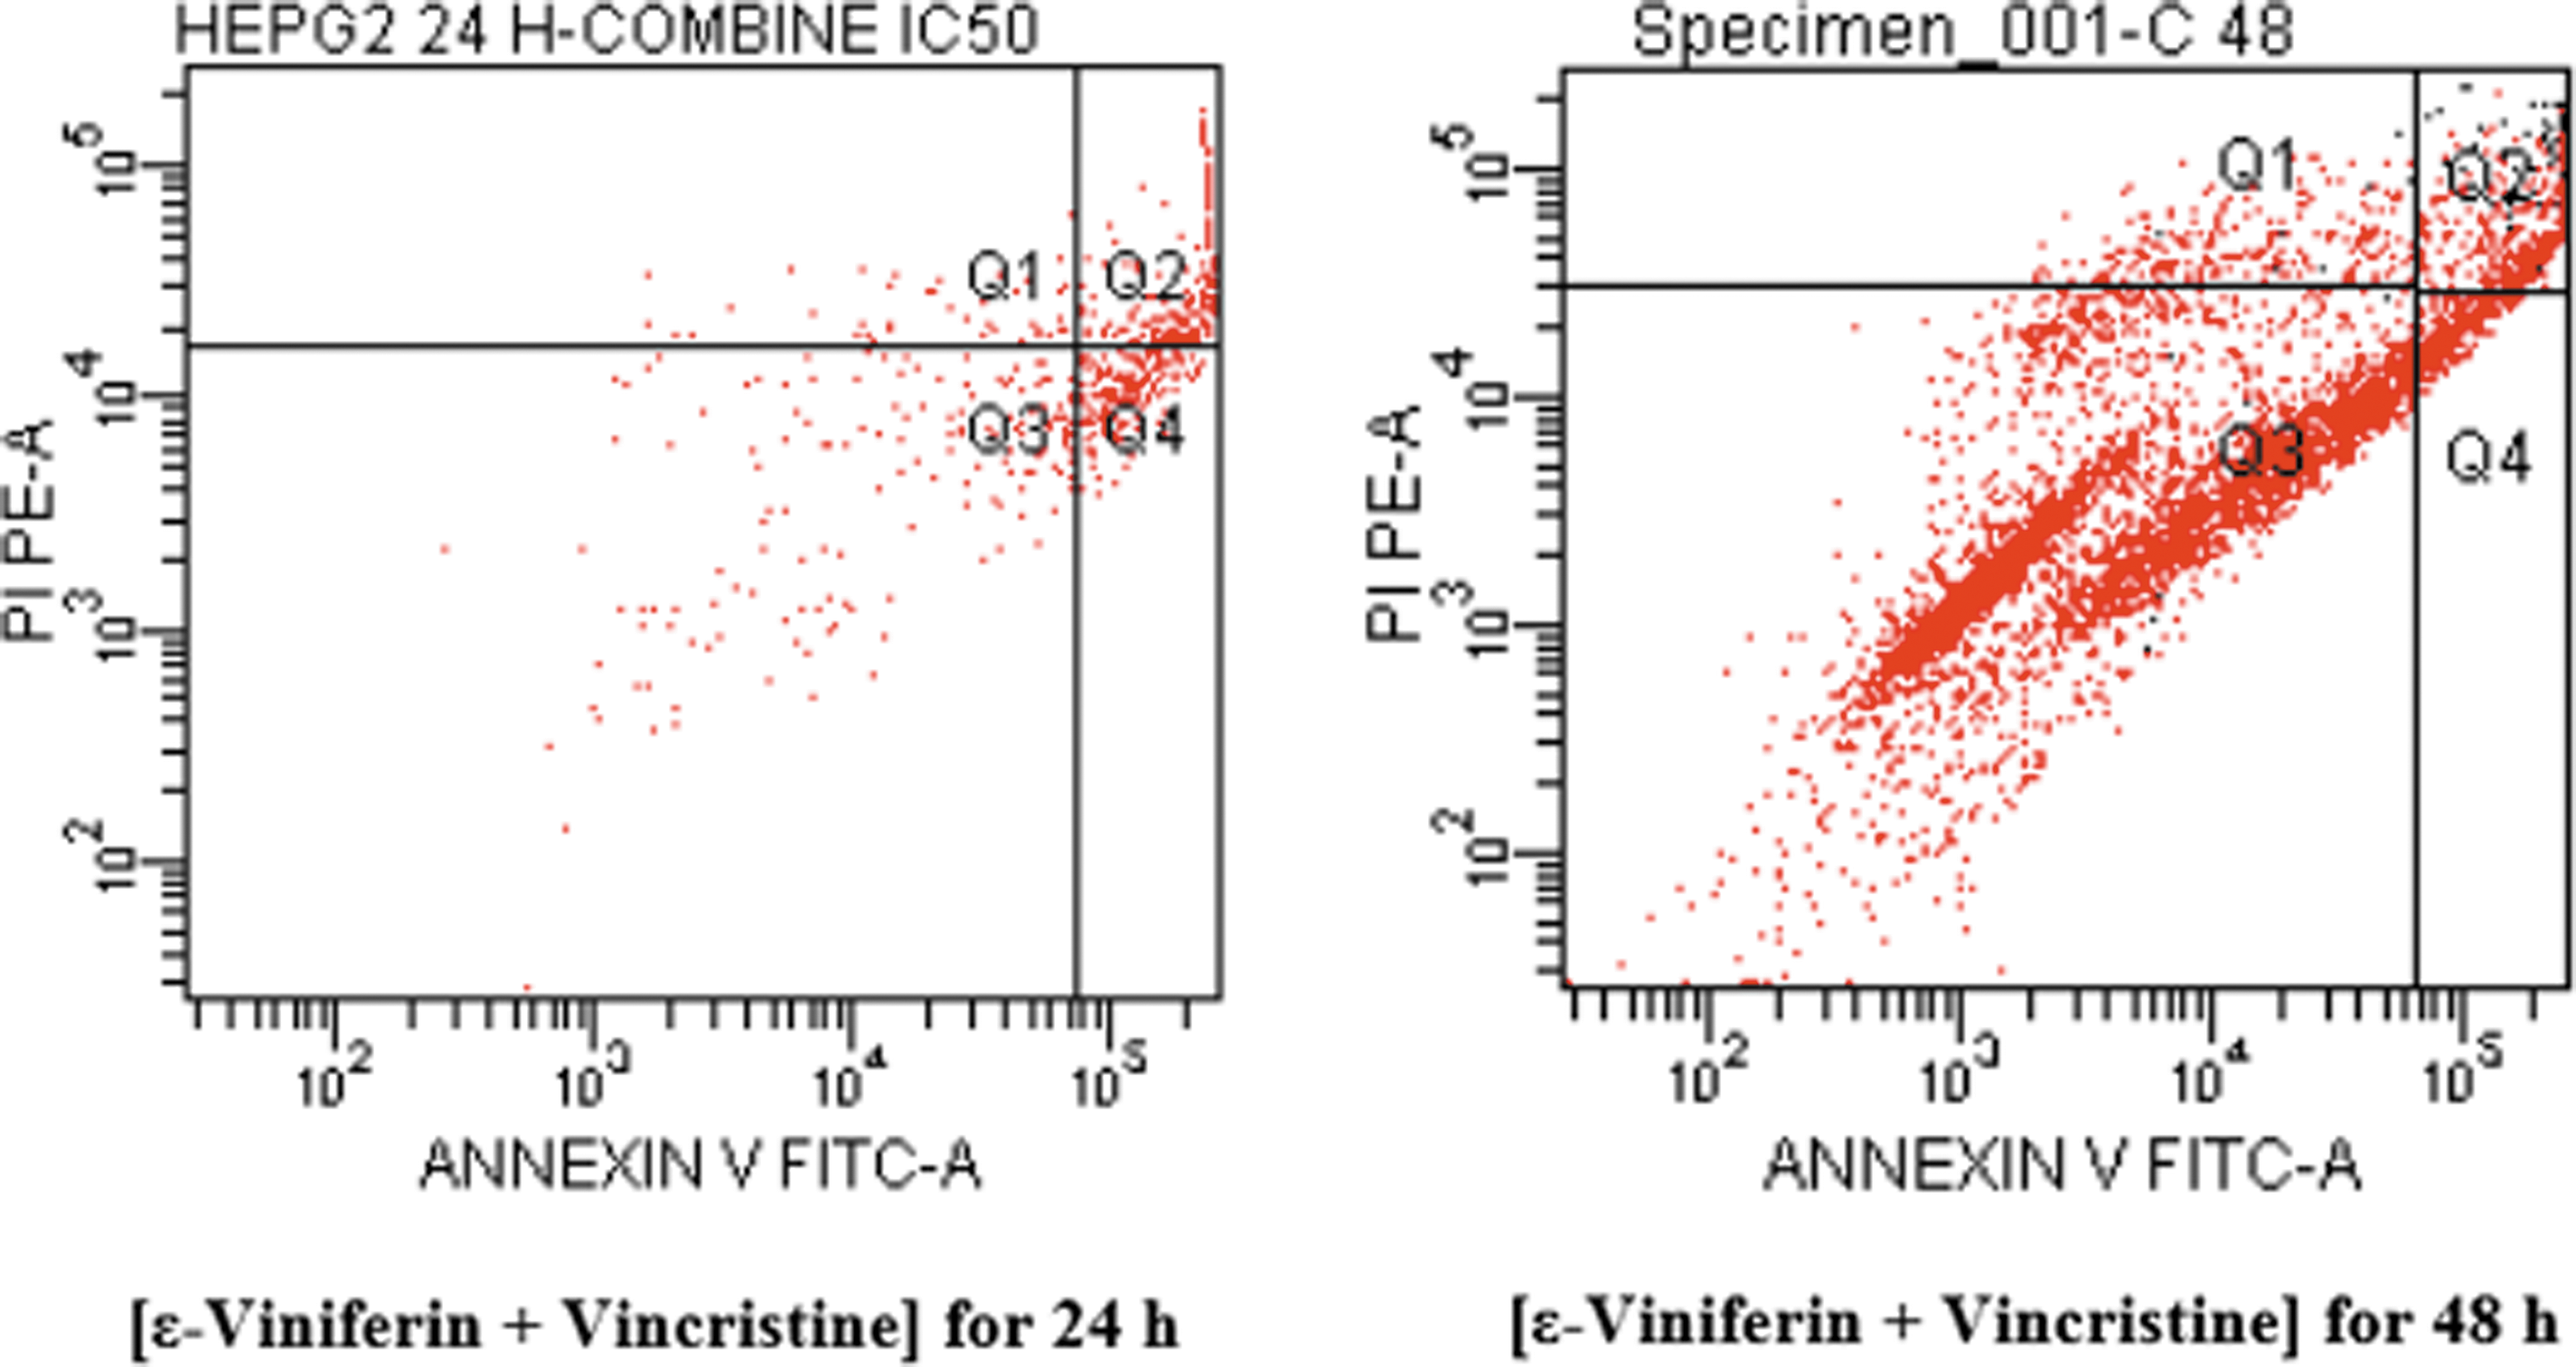
Apoptotic percentage of HepG2 cells after inducing with [ɛ-viniferin+vincristine] in combination for 24 and 48 hours. Phosphatidylserine expressing cells were detected by annexin V-binding. Four distinct phenotypes were distinguishable: viable (annexin-V−/PI−, Q3), early apoptotic (annexin-V+/PI−, Q4), late apoptotic (annexin-V+/PI+, Q2), and necrotic/damaged cells (annexin-V−/PI+, Q1). Experiments were repeated two times.
As seen in Figure 5, at 24 h, control cells did not show any significant apoptosis, and the percentage of early apoptotic (annexin V+) cells was only 5.0%, however the percentage of late apoptotic (annexin V+/PI+) was 7.5%. After 48 h of incubation time, the apoptotic rate of control cells was even lower than at 24 h. After treatment with 26 μM (half dose of IC50) vincristine for 24 h, the corresponding quantities were 25.1% and 19.0%, respectively. Apoptotic effects of vincristine was decreased over time (48 h incubation period) (Table 1).
Early apoptotic (Annexin-V+/PI−, Q4); Late apoptotic (Annexin-V+/PI+, Q2); Necrotic/damaged cells (Annexin-V−/PI+, Q1); Viable (Annexin-V−/PI−, Q3).
However, an addition of 7.9 μM ɛ-viniferin with 5.6 μM vincristine (Fig. 6) increased the apoptotic rate of HepG2 cells, and the corresponding quantities were 30.0% and 36.9%, respectively. We found that combining the use of ɛ-viniferin and vincristine at lower concentrations increases the apoptotic HepG2 cell number as compared to being used alone. Therefore, combining the use of ɛ-viniferin with vincristine in the treatment of cancer might be a dual benefit, including increased the number of HepG2 cells to enter apoptosis. The apoptotic effect is reduced in the combined group at 48 h (Fig. 6; Table 2).
Early apoptotic (Annexin-V+/PI−, Q4); Late apoptotic (Annexin-V+/PI+, Q2); Necrotic/damaged cells (Annexin-V−/PI+, Q1); Viable (Annexin-V−/PI−, Q3).
Induction of DNA fragmentation by ɛ-viniferin and vincristine, alone or in combination
The ability of either ɛ-viniferin, vincristine, or combining treatment to induce internucleosomal DNA fragmentation at 24 h have been investigated by using agarose gel electrophoresis to demonstrate the typical pattern of DNA laddering indicative of apoptosis (Fig. 7). Agarose gel electrophoresis of genomic DNA from HepG2 cells induced by vincristine at 6, 52.5, or 105 μM for 24 h showed typical DNA ladders. Also, a similar ladder pattern was found in HepG2 cells when combined with an even lower concentration of 3.62 μM vincristine and 3.75 μM ɛ-viniferin as shown in Figure 7. It is considerable that there was a synergic effect of ɛ-viniferin on vincristine-induced HepG2 cells apoptosis. When HepG2 cells were treated with 80, 98.3, or 196 μM ɛ-viniferin alone, DNA gel electrophoresis failed to demonstrate any ladder bands. Etoposide, used as different a chemotherapeutic agent, was showed HepG2 cell DNA fragmentation at a higher concentration (165 μM) than vincristine. DMSO did not show any ladder bands (data not shown).
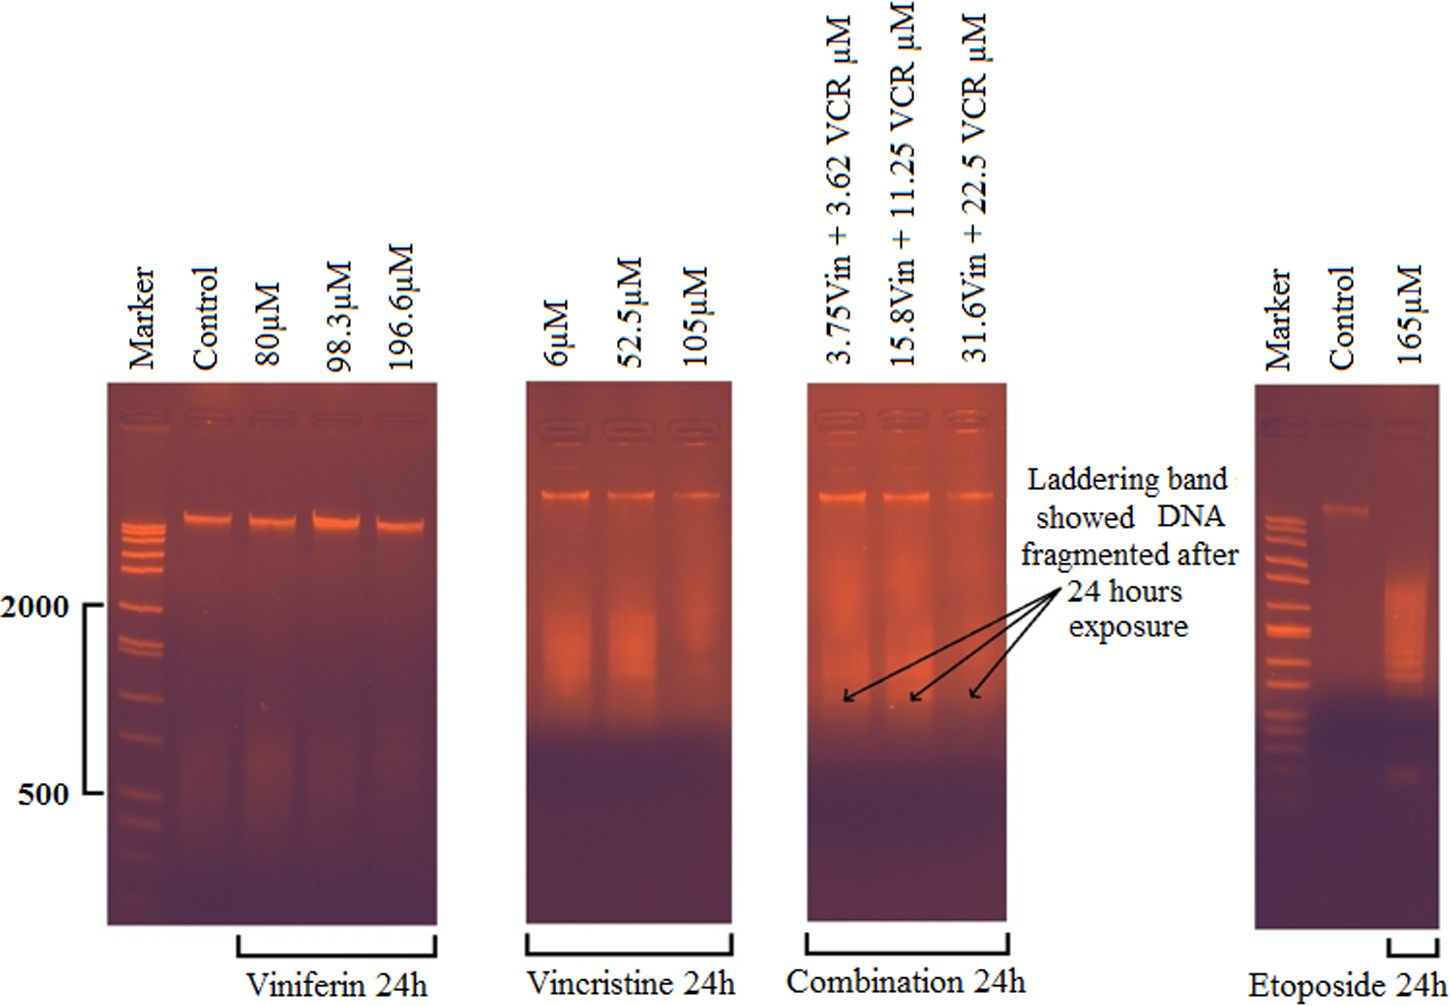
Agarose gel analysis of internucleosomal DNA fragmentation in HepG2 cells after treating cells with ɛ-viniferin and vincristine, alone or in combination for 24 hours at different doses. HepG2 cells were lysed and total cellular DNA was loaded on an agarose electrophoresis gel containing ethidium bromide and visualized under UV light. Laddering band showed DNA fragmented after 24 hours exposure. Size markers are shown in lines M (50 bp to 10,000 bp wide range DNA ladder). VCR, vincristine.
Diıscussion
Hepatocellular carcinoma is a malignant tumor with poor prognosis and with a high morbidity and mortality (Motola-Kuba et al., 2006; Raoul, 2008). While modern surgery has reduced the hepatocellular cancer mortality rate, chemotherapy and radiotherapy treatments have caused less than a 5% reduction in the death rate (Sherman, 1999). Moreover, it is well-known that hepatocellular carcinoma is resistant to conventional cytotoxic chemotherapy and radiotherapy that often hampers a treatment's efficacy. Despite all of this, chemotherapy is still an important therapeutic strategy for the treatment of cancers. Stimulation of apoptosis is considered as a possible mechanism of most of the chemotherapeutic drugs (Ferreira et al., 2002; Ghavami et al., 2005). Therefore, there is an urgent need for the development of a new agent or newer combination, yet chemotherapy remains crucial to the treatment of hepatocellular cancer through inducing apoptotic signaling system.
The vinca alkaloid anticancer drug, vincristine, is an effective chemotherapeutic agent that is extensively used for the treatment of many malignancies (Eing-Ju et al., 1995; Steiner et al., 1983) such as leukemia (Diez et al., 2012), breast (Casado et al., 2007), retinoblastoma (Conway et al., 1998), and hepatoma (Sun et al., 2009) cancer cells. Vincristine exerts its anticancer effect by binding to the building blocks of microtubules. In this way, vincristine stops the separation of the duplicated chromosomes and induces G2/M phase arrest (Meininger et al., 1990), c-Jun NH2-terminal kinase activation (Wang et al., 1998), Bcl-2 phosphorylation (Ruvolo et al., 2001), and apoptosis (Wang et al., 1998). However, in the clinical situation, neurotoxicity (Legha, 1986) and drug resistance effects (Diez et al., 2012; Koike et al., 1997; Sun et al., 2009) of vincristine have been reported and the neurotoxicity of vincristine can present serious clinical problems. Therefore, in the present study a combination of vincristine and ɛ-viniferin, which is a derivative of trans-resveratrol, was investigated to develop new therapeutic strategies that are efficient and less toxic to the treatment of hepatocellular cancer.
Because of the complex structure of cancer, it is becoming generally accepted that combining therapeutic modalities are important to treat the malignant disease. Recently, a few studies have shown that combining treatment with vincristine and other agents such as adriamycin, cyclophosphamide in the treatment of children with malignant hepatoma (Evans et al., 1982), and doxorubicin in the treatment of leukemia cancer (Diez et al., 2012), showed lower cytotoxicity and drug resistance as well as better therapeutic efficiacy. However, as far as we know, no studies about the apoptotic effects of vincristine combined with ɛ-viniferin in HepG2 cells have been reported. Therefore, the effects of using ɛ-viniferin and vincristine on HepG2 cell viability were determined by cell viability assay, whether a combination or alone. Our data showed that ɛ-viniferin ranging from 6.25 to 50 μM had no significant inhibitory effect on the viability of HepG2 cells, while the inhibitory effect was observed at higher concentrations (100 and 200 μM). On the other hand, the cell viability was inhibited at 50% when treating cells with 52.5 μM (IC50 value) vincristine. The IC50 of vincristine for HepG2 cells was equal to that of etoposide, which is a well-known anti-tumor agent. IC50 value was determined at 1.20 μg/mL or 3.5 μM for parental HepG2 cells and at 21.3 μg/mL or 150 μM for drug-resistance HepG2 cells (Chan et al., 2000; Zheng et al., 2008). However, a significant decrease of cell viability was observed in HepG2 cells treated with a combination of ɛ-viniferin and vincristine at lower doses than the treatment of these two drugs alone. Moreover, the treatment with ɛ-viniferin at nontoxic concentrations induced a significant decrease of IC50 values of vincristine against HepG2 cells, and also the significant synergistic effect of ɛ-viniferin in combination with vincristine was detected by isoblogram analysis (Fig. 3). Our study indicates that the combined use of ɛ-viniferin and vincristine at low concentrations, used to treat hepatoma, may be more efficient that using a single drug at higher concentrations. The side effects produced by vincristine at the high doses can be avoided by its combination at low doses. These results suggest that ɛ-viniferin may be potentially useful as a biochemical modulator to enhance the therapeutic effects of vincristine in cancer chemotherapy. Tetrandrine also showed synergistic anticancer effects when combined with vincristine in vitro (Sun et al., 1999). All this data showed that the addition of ɛ-viniferin might modulate HepG2 cells sensitive to vincristine at low concentrations. Some studies have shown that treatment of a combination of vincristine with doxorubicin in murine leukemic cells (Diez, et al., 2012) or estradiol in MCF7 cells (Martinez-Campa et al., 2006) inhibited cell growth and sensitized cells to vincristine in vitro.
Increased sensitivity of HepG2 cells to vincristine was also confirmed by the enhanced vincristine-induced apoptosis in the presence of ɛ-viniferin. When ɛ-viniferin and vincristine were used, apoptosis induction, evaluated by mophological and biochemical assays, was increased compared to each drug alone. Electron microscopic analysis was performed to show morphological changes in HepG2 cells. At 98.3 μM, ɛ-viniferin increased lipid production, and irregularities in the structure of chromatin were observed compared to control cells. Reduction of the nuclear/cytoplasmic in the cells, one of the morphological criteria for apoptosis (Walker et al., 1988), was observed in cells treated with the combination of 15.8 μM ɛ-viniferin and 11.25 μM vincristine (Fig. 4). By flow cytometry, the results showed that 49 μM ɛ-viniferin treatment caused the apoptosis of HepG2 cells, and the percentage of apoptosis only increased up to 25.1% when exposed to 26 μM of vincristine (Fig. 5). Interestingly, when vincristine was combined with 7.9 μM ɛ-viniferin, the percentage of apoptotic population of HepG2 cells increased 1.7 fold (10.4%), compared with vincristine treatment alone. Cells treated with ɛ-viniferin and vincristine caused a higher percentage of cells that accumulate in the early phase of apoptosis as compared with tumor cells treated with ɛ-viniferin and vincristine alone. This data indicated that treatment with ɛ-viniferin and vincristine inhibited HepG2 cell viability by inducing early apoptosis and significant early apoptotic activity could be achieved by combined treatment with ɛ-viniferin and vincristine. Vincristine induces apoptosis (Ruvolo et al., 2001; Wang et al., 1998) in various cells, such as breast cancer cells (Casada et al., 2007; Martinez-Compa et al., 2006), retinoblastoma (Conway et al., 1998), and leukemia cells (Diez et al., 2012) in vitro. In addition, vincristine regulates the phosphorylation of the anti-apoptotic protein HSP27 in breast cancer cells (Casado et al., 2007).
The apoptotic effect was further supported by the observation that a combination of ɛ-viniferin and vincristine treatment increased significantly DNA fragmentation in HepG2 cells (Fig. 7).
In conclusion, a combination of ɛ-viniferin and vincristine inhibited HepG2 cell growth by inducing apoptotic death at a lower concentration. At the same time, ɛ-viniferin showed synergistic anticancer effects when combined with vincristine against HepG2 cells. It suggests that the administration of ɛ-viniferin can significantly decrease the effective dose of vincristine. We observed that the combined treatment of ɛ-viniferin led to decrease in dosage of vincristine treatment used alone. However, rather than IC50 value, in IC80, which for less than IC50 dosage, combined treatment showed effectiveness as well. This study was carried out in a single cell type and thus warrants further replication regarding the effects of viniferin in future studies. Additionally, we suggest that the discovery of novel hepatic carcinoma treatments can benefit from considering other molecular intermediary pharmacodynamic end-points such as microRNAs (Hua et al., 2012; Song et al., 2013) and novel postgenomics methodologies such as cell metabolomics (Zhang et al., 2013).
Footnotes
Acknowledgments
This work was funded by a grant from the Anadolu University (Project No. 090306). Authors wish to thank BİBAM for technical support.
Disclosure Statement
The authors declare that there are no conflicting financial interests.