




Abstract
Abstract
The path to personalized medicine demands the use of new and customized biopharmaceutical products containing modified proteins. Hence, assessment of these products for allergenicity becomes mandatory before they are introduced as therapeutics. Despite the availability of different tools to predict the allergenicity of proteins, it remains challenging to predict the allergens and nonallergens, when they share significant sequence similarity with known nonallergens and allergens, respectively. Hence, we propose “FuzzyApp,” a novel fuzzy rule based system to evaluate the quality of the query protein to be an allergen. It measures the allergenicity of the protein based on the fuzzy IF-THEN rules derived from five different modules. On various datasets, FuzzyApp outperformed other existing methods and retained balance between sensitivity and specificity, with positive Mathew's correlation coefficient. The high specificity of allergen-like putative nonallergens (APN) revealed the FuzzyApp's capability in distinguishing the APN from allergens. In addition, the error analysis and whole proteome dataset analysis suggest the efficiency and consistency of the proposed method. Further, FuzzyApp predicted the Tropomyosin from various allergenic and nonallergenic sources accurately. The web service created allows batch sequence submission, and outputs the result as readable sentences rather than values alone, which assists the user in understanding why and what features are responsible for the prediction. FuzzyApp is implemented using PERL CGI and is freely accessible at http://fuzzyapp.bicpu.edu.in/predict.php. We suggest the use of Fuzzy logic has much potential in biomarker and personalized medicine research to enhance predictive capabilities of post-genomics diagnostics.
Introduction
A
Personalized medicine is the branch of medicine that involves treatment of the patient with customized medical practices and tailored biopharmaceutical products. The growing emphasis on personalized medicine approaches and knowledge of molecular basis of diseases have already started influencing the pharmaceutical product development process (Ginsburg and McCarthy, 2001). On the other hand, the path to personalized medicine demands the use of new and customized biopharmaceutical products containing modified proteins, and such personalized medicine trials are reported to be increasing (Long and Works, 2013). Genetically Modified Organisms (GMO) are also utilized in developing biopharmaceutical products (Lancini and Demain, 2013), and it is evident that the usage of GMO in both biopharmaceutical products and agricultural products are constantly increasing (Sil and Jha, 2014). Hence, assessment of such products for the presence of potent allergenic protein becomes mandatory before they are introduced for human treatment or consumption (House, 2013; Panda et al., 2013; Vargas et al., 2013).
In 2003, the Food and Agricultural Organization (FAO) and World Health Organization (WHO) proposed two modified guidelines for the assessment of protein allergenicity in GMO products (FAO/WHO, 2003). According to the guidelines, the protein is considered to be potentially allergenic (i) if it has an identity of six or more contiguous amino acid residues, and (ii) if the query protein has a minimum 35% global sequence similarity over a window size of 80 amino acid residues against known allergen proteins. Computational methods have been developed initially based on these guidelines (Fiers et al., 2004; Stadler and Stadler, 2003) for scanning the potential allergenic proteins. While these methods were useful in some cases (Fiers et al., 2004), the positive predictive value was too low for the methods entirely relying on the FAO/WHO guidelines (Silvanovich et al., 2006). To overcome this, more sophisticated approaches, capable of finding a motif among the allergenic sequence, were reported. The approaches include quadratic Gaussian classifier (Soeria-Atmadja et al., 2004), k-nearest neighbor classifier (Zorzet et al., 2002), wavelet transform method (Li et al., 2004), supervised identification of allergen-representative peptides (Bjorklund et al., 2005), and features derived from protein structural and physicochemical properties (Cui et al., 2007). Although Saha and Raghava (2006) reported a hybrid method combining SVM, motif search, and IgE epitope based approach, which was capable of differentiating allergens from nonallergens, it performed poorly in predicting allergen-like putative nonallergens (APN) (Muh et al., 2009). APN are proteins that are nonallergenic in nature but possess significant sequence similarity with known allergens, making it difficult to predict them as nonallergen. To overcome the problem of predicting the APN, a SVM-Pairwise system trained with APN (Muh et al., 2009) was reported, which achieved significant accuracy. Later, SORTALLER (Zhang et al., 2012), capable of predicting allergens of a particular family or species, and proAP (Wang et al., 2013), capable of predicting allergens with the use of optimized sequence and motif, were reported. In spite of these many methods, it still remains challenging to predict allergen and nonallergen proteins, when the query sequence has similarity with nonallergens and allergens, respectively.
We have described a method using a Fuzzy inference system (FIS) for predicting protein allergenicity (Saravanan and Lakshmi, 2013). Five different modules were used: (a) machine learning classifier; (b) motif based module; (c) allergen similarity module; (d) APN similarity module; and (e) a FAO/WHO scheme to predict the protein for allergenicity. The results of each module were further assessed based on the fuzzy membership functions and 108 fuzzy IF-THEN rule set for allergenicity. The FIS was found to be good in predicting APN in comparison to other existing methods (Saravanan and Lakshmi, 2013). However, the setback of FIS includes: (i) use of AdaBoost as a machine learning classifier, which is considered to be prone to overfitting problems (Dietterich, 2000); (ii) use of eight misclassified fuzzy rules, which could affect the prediction result of FIS; and (iii) absence of the proposed method as tool/web server for practical use. Since the FIS adopts five computational modules with complicated procedures, it is difficult in practice for a biologist to carry out each step of FIS to predict the allergenicity of the query protein manually.
Hence, in this work we propose “FuzzyApp” with four modules from FIS and support vector machine (SVM) based machine learning classifier (MLC), which is less prone to overfitting problems (Vatsa et al., 2008) to predict the allergenicity of proteins. In contrast to FIS, FuzzyApp employs rectified fuzzy rules and is implemented as an easy-to-use web server. Various validation procedures were carried out to evaluate and validate the FuzzyApp's performance. FuzzyApp outperformed all the other existing methods, including FIS, in predicting allergenicity of the query protein, especially in differentiating the APN. The user friendly interface and comprehensive output make FuzzyApp suitable for researchers with less bioinformatics skill.
Materials and Methods
Dataset for machine learning classifier
In this study, the positive and negative datasets from Muh et al. (2009) were used to train (Tr-set) and test (Ind-Set and APN-Ind-set) the proposed SVM-MLC. The datasets used in recent studies on allergen prediction, SORTALLER and proAP (Wang et al., 2013; Zhang et al., 2012), were not adopted because the proAP dataset was designed and categorized on the basis of species and families, while the SORTALLER included a dataset containing protein with IgE binding ability and did not include any procedures to remove the redundant entries within the dataset. The dataset distribution is listed in Table 1.
Allergen; bDivergent putative nonallergen; cAllergen like putative nonallergen.
Dataset for similarity based module ASM and APNSM
For the in-house allergen database used in this study, the allergenic proteins were obtained from literature search and allergen databases including (a) Allergome (Mari et al., 2005); (b) Comprehensive allergen database (Hileman et al., 2002); (c) SDAP database (Ivanciuc et al., 2003); (d) Allergen structural database (Chapman et al., 2007), and Swiss-Prot Allergen Index (http://www.uniprot.org/docs/allergen.txt). To remove the redundant entries and to retain a considerable number of allergens for the in-house allergen database, entries having a sequence similarity >60% were removed using CD-HIT web server (Huang et al., 2010), which resulted in a total of 2951 allergens for the in-house allergen database. The reason for not using stringent sequence similarity threshold of 40% or 30% was because such a small threshold would result in a reduced number of allergens for the database. For the in-house APN-database, proteins were collected from the UniProt database (reviewed entries of release 2014_1) by filtering proteins that do not have biological function or general annotation assigned as allergen or atopy, which resulted in 541,644 proteins. To remove the redundant entries, sequences having similarity of 40% or more within the data were removed using CD-HIT web server (Huang et al., 2010), which resulted in 11,794 proteins. Since a huge number of proteins (541,644) were reported in the initial search, a stringent similarity of >40% was used to bring down the non-redundant entries, in contrast to 60% used for in-house allergen database. Further, the 11,794 proteins were subjected to the procedure described in Muh et al. (2009) to identify the entries having high similarity with the known allergens, which resulted in 1991 APN for the final in-house APN-database. The dataset distribution is listed in Table 1.
Support vector machine classifier (SVM-MLC)
Due to the robustness of SVM, it was widely adopted as classifier in various computational biology tools (Ben-Hur et al., 2008). Hence, in this study, SVM was chosen as the machine learning classifier. The Tr-Set data constructed by Muh et al. (2009) containing 1405 potent allergens and 4970 nonallergens were used to train the SVM-MLC, and no APN were used in the training process. The tuning parameter C (trades off misclassification of training examples) and γ (defines how far the influence of a single training example reaches) for the SVM were selected using grid search method (Hsu et al., 2003) and set as 32.0 and 0.0078125, respectively. The protein was represented as a 60-D feature vector, as described by Carr et al. (2010), containing compositional (measures the extent to which the proportion of amino acids deviate from the expected), centrodial (measures the extent to which amino acids tend to be in a particular region of the protein), and translational (measures the extent to which amino acids cluster along the length of the protein) features of the protein. The feature vector adopted has been widely used in various protein classification problems (Saravanan and Lakshmi, 2013; 2014). The predictive model would output the value ranging between 0–1, in which 0 and 1 indicates the lowest and highest confidence, respectively. The architecture of SVM-MLC is illustrated in Figure 1.

Architecture of SVM-MLC module.
Motif based module
Motif based module was built in accordance to Saravanan and Lakshmi (2013), in which Multiple Em for Motif elicitation (MEME) and Motif alignment (MAST) tools (Bailey et al., 2009) were used to identify the potent allergen-motif and to align the motif with query sequences, respectively. For the MEME/MAST based module (MMM), the query sequences were scanned for the presence of one or more of the 66 statistically significant allergen motifs [constructed in accordance to Saravanan and Lakshmi, (2013), where the “statistical significant” implies the motif that possess lower E-value, in this case a threshold of 1.0E-4, was considered significant] and their corresponding expected values were fed into fuzzy rule-based system. To increase the confidence level of the motif module, the threshold of the MAST E-value was set to 1.0E-4, in contrast to default value of 1.0. The query sequences that do not possess one or more of the 66 motifs were subjected to basic local alignment search (Altschul et al., 1990) against the 192 unique allergens, and their corresponding identities were fed into fuzzy rule-based system. The architecture of motif module is illustrated in Figure 2.
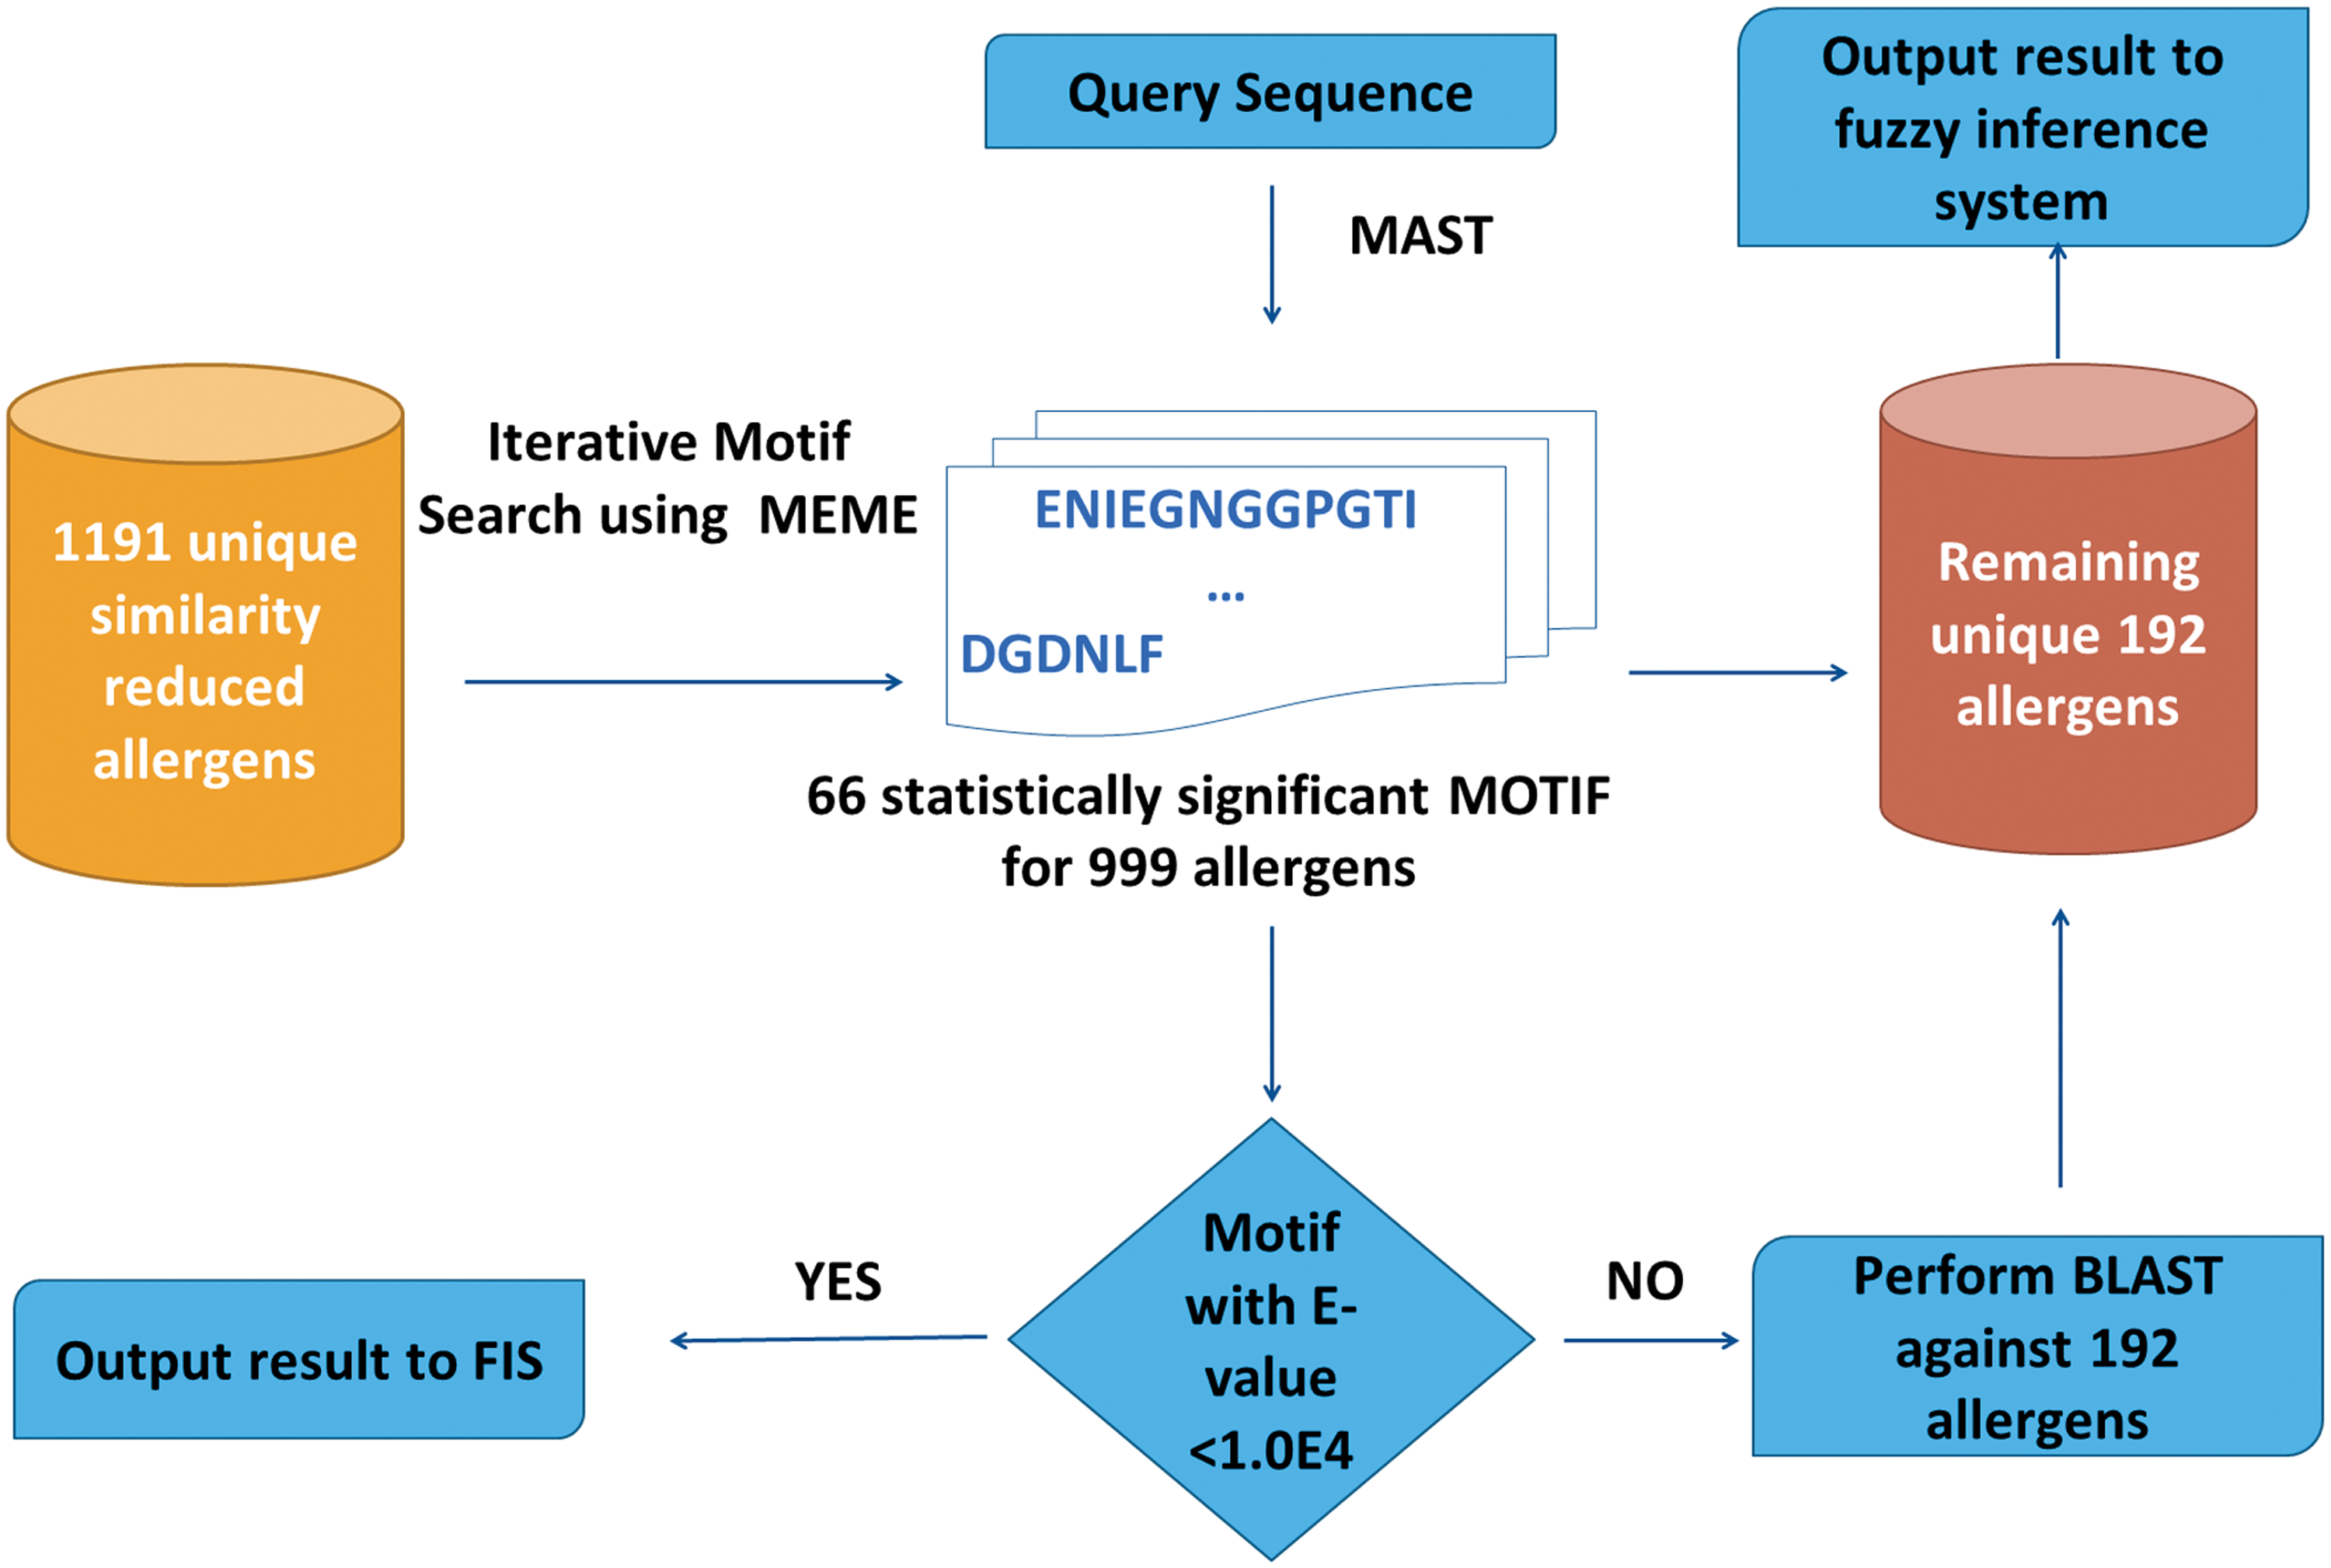
Architecture of motif based module (MMM). MAST, Motif alignment search tool; MEME, Multiple Em for motif elicitation.
Similarity modules
Two similarity modules, global similarity with in-house allergen database (ASM) and global similarity with in-house APN database (APNSM), were developed in accordance to Saravanan and Lakshmi (2013) using FASTA V.36.3.6 (Pearson, 1994). The gap open penalty, penalty per residue in a gap, and expectation threshold of FASTA tool were set in accordance to FAO/WHO (2003). The architecture of similarity module is illustrated in Figure 3.
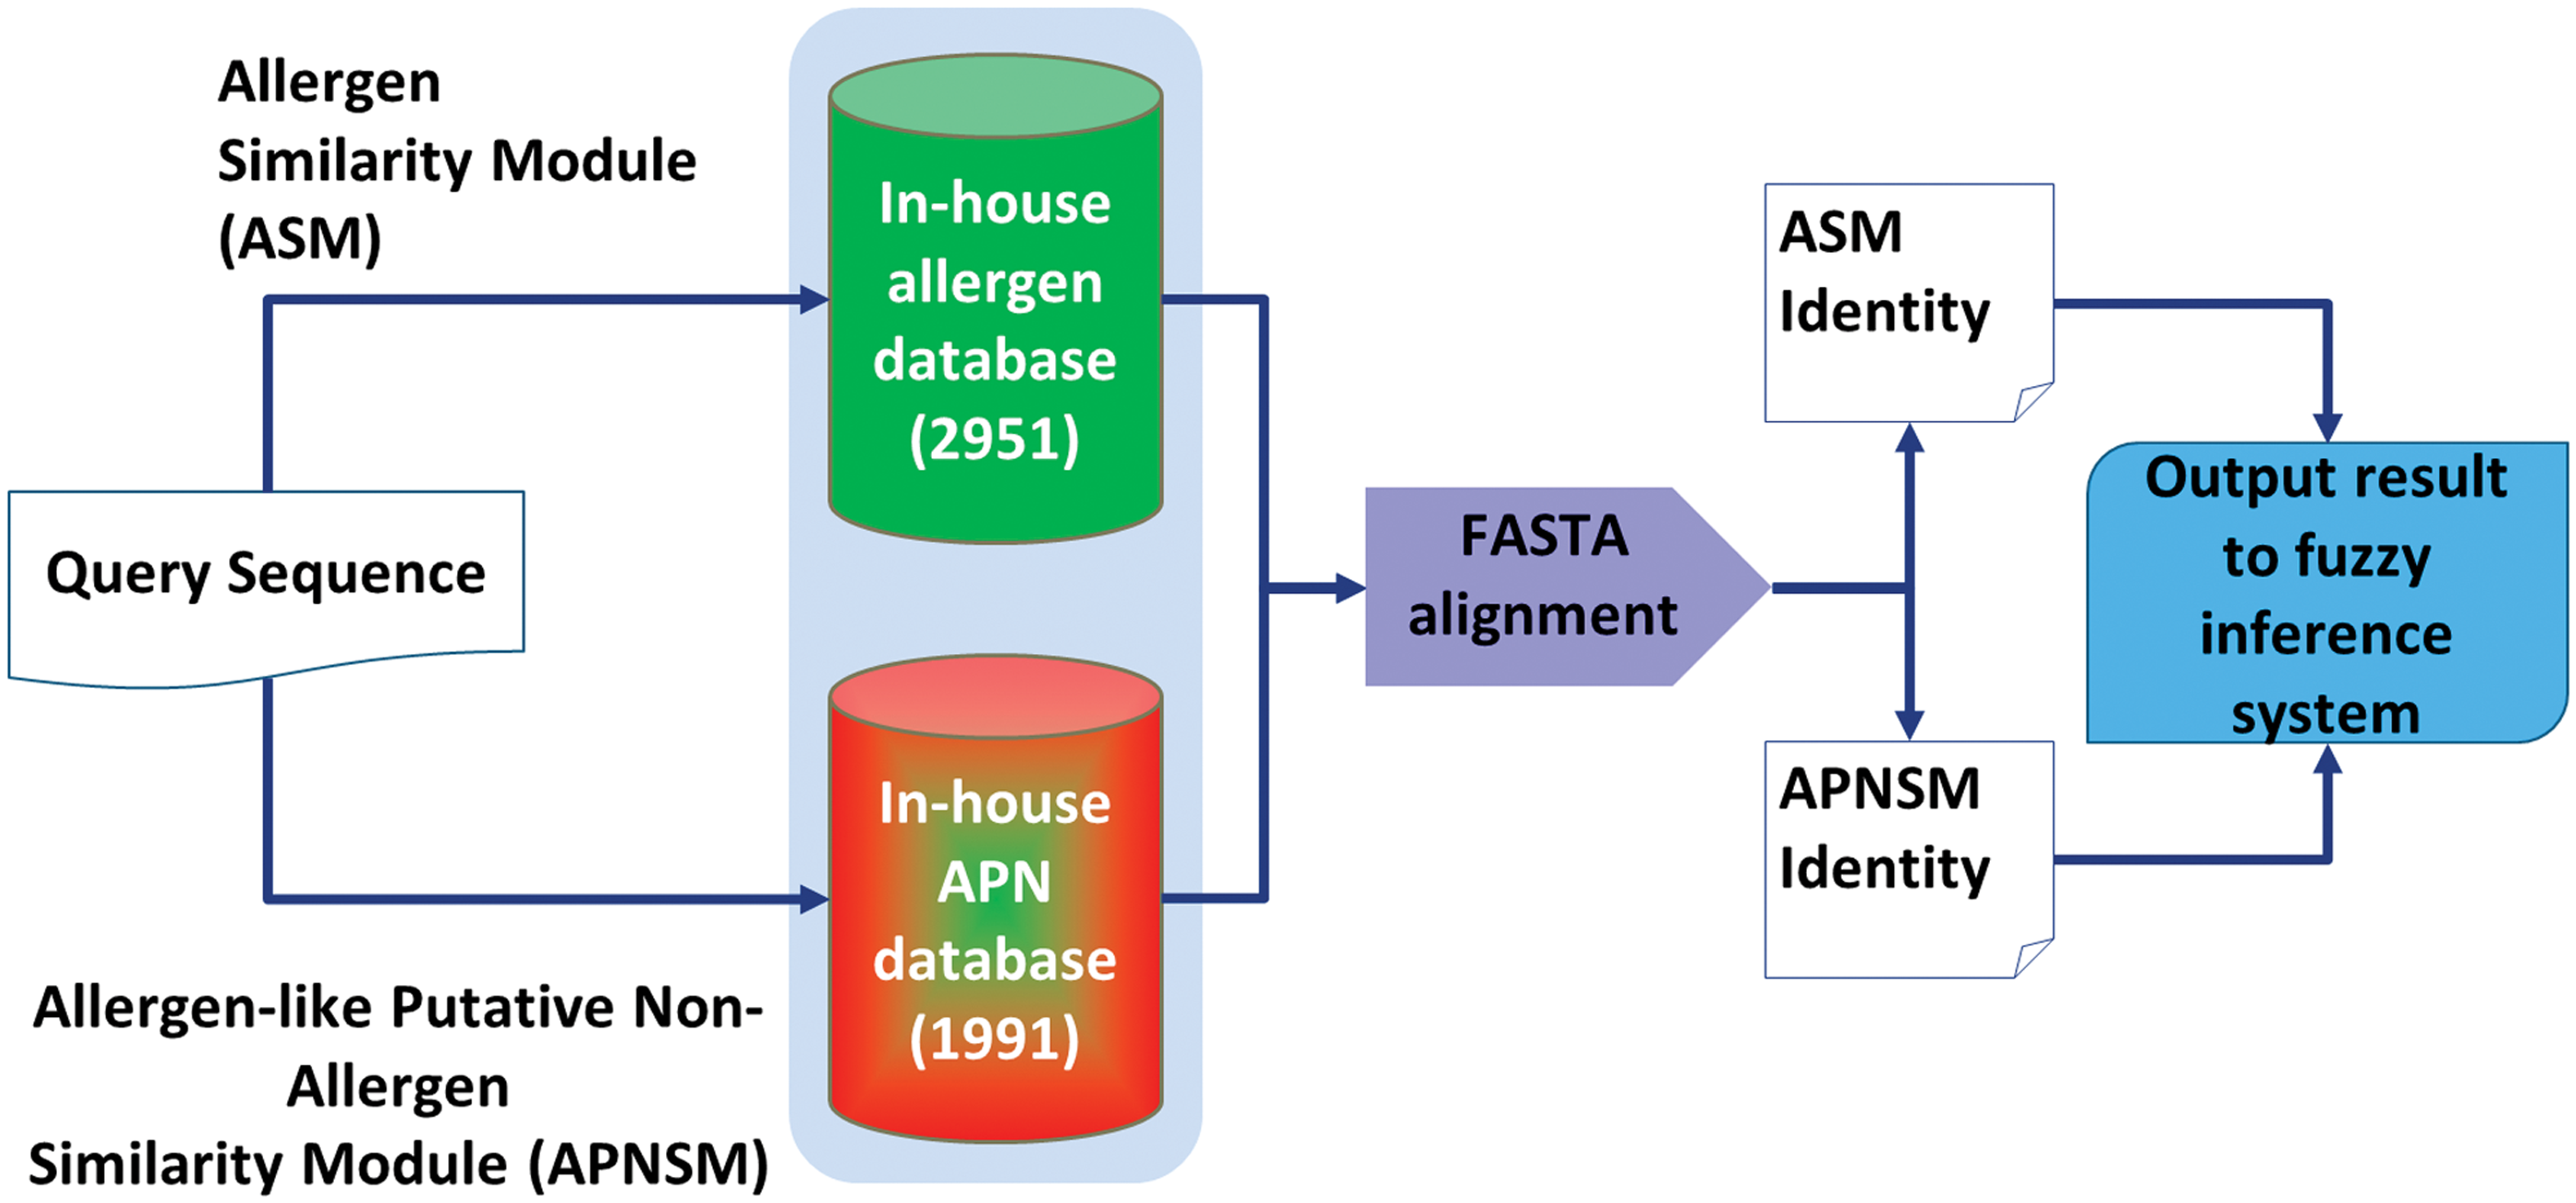
Architecture of similarity modules. APNSM, allergen-like putative nonallergen similarity module; ASM, allergen similarity module.
Classic FAO/WHO Scheme
For the Classic FAO/WHO Scheme (CFS), the query sequence was moved over a sliding window of length 80. Each window was then subjected to global alignment using FASTA V36.3 (Pearson, 1994). The gap open penalty, penalty per residue in a gap, and expectation threshold of FASTA tool were set in accordance to FAO/WHO (2003). The sliding window with the best identity was considered for the final output. The architecture of CFS module is illustrated in Figure 4.
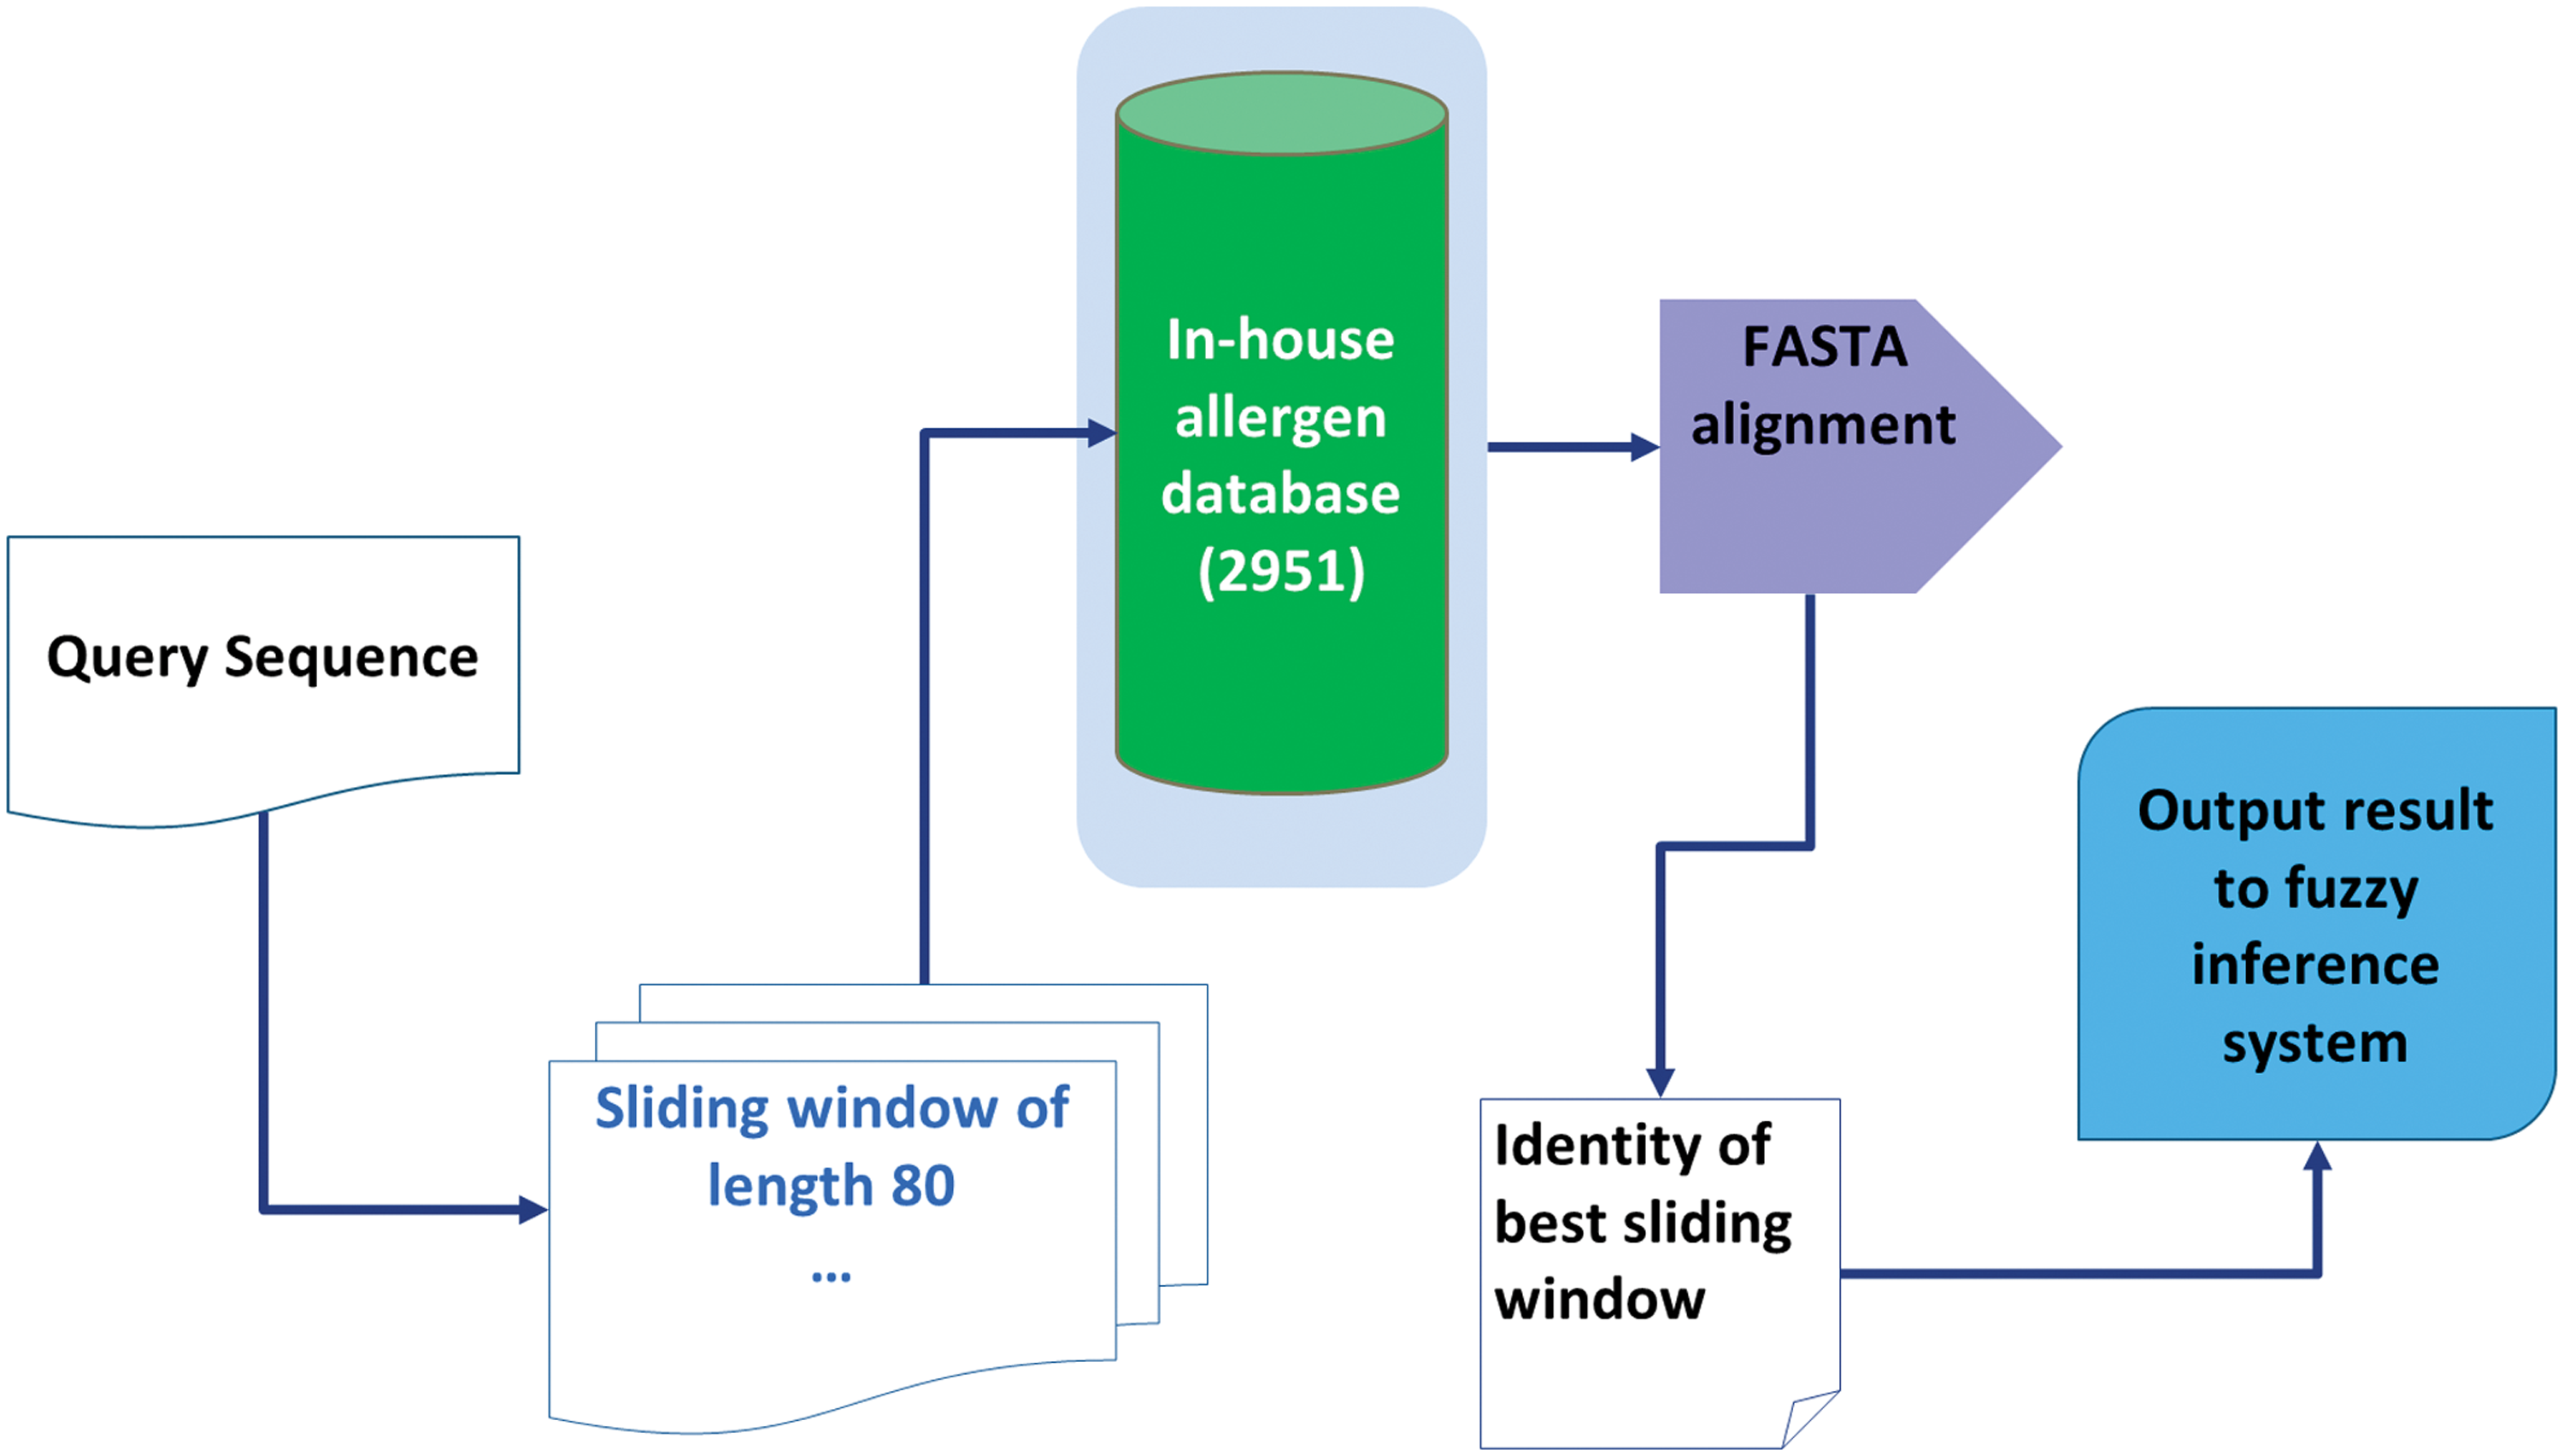
Architecture of FAO/WHO scheme module.
Fuzzy rule-based system
The fuzzy rule-based system is a computational framework based on the fuzzy set theory, fuzzy IF-THEN rules, and fuzzy reasoning. It has been widely used in various fields, including communication technology, expert systems, pattern recognition, and time-series prediction (Kasabov and Song, 2002). Due to its noncomplicated nature, it is also used in solving biological problems (Saravanan and Shanmughavel, 2008).
For this study, the input parameters for the FIS were derived from five modules namely SVM-MLC, MMM, CFS, ASM, and APNSM. The output of each module was normalized and fuzzified (a process of transforming fuzzy set's crisp values into grades of membership). The normalization was done for CFS, ASM, and APNSM modules and the value ranges between 0 and 1. The normalization was computed as Xi=Ii/100, where “X” is the normalized value; “i” is the modules CFS, ASM, and APNSM; and “Ii” the identity percentage from three modules. As the actual output of SVM-MLC and MMM modules range between 0 and 1, normalization was not done for these two modules. For each module, membership classes (MC) were assigned Figure 5. Trapezoidal and triangular shape membership functions were used to design the input and output variables. Mamdani and Assilian (1975) type rule-based system with “centroid” defuzzification method (a process of generating quantifiable output from fuzzy sets and its corresponding membership functions) was used to build the system. Supplementary Table 1 (supplementary data are available online at www.liebertpub.com/omi) lists the rectified 108 Fuzzy IF-THEN rules used in this application, which was derived based on manual observation of allergens, nonallergens, and APN behavior over proposed modules. The Fuzzy logic section of the proposed algorithm was implemented using Fuzzy Logic Tool box™ from MATLAB V7.10. The overall architecture of the proposed allergen prediction system was constructed as depicted in Figure 6.

Membership class assignment for the input (five modules) and output (FuzzyApp) variable.
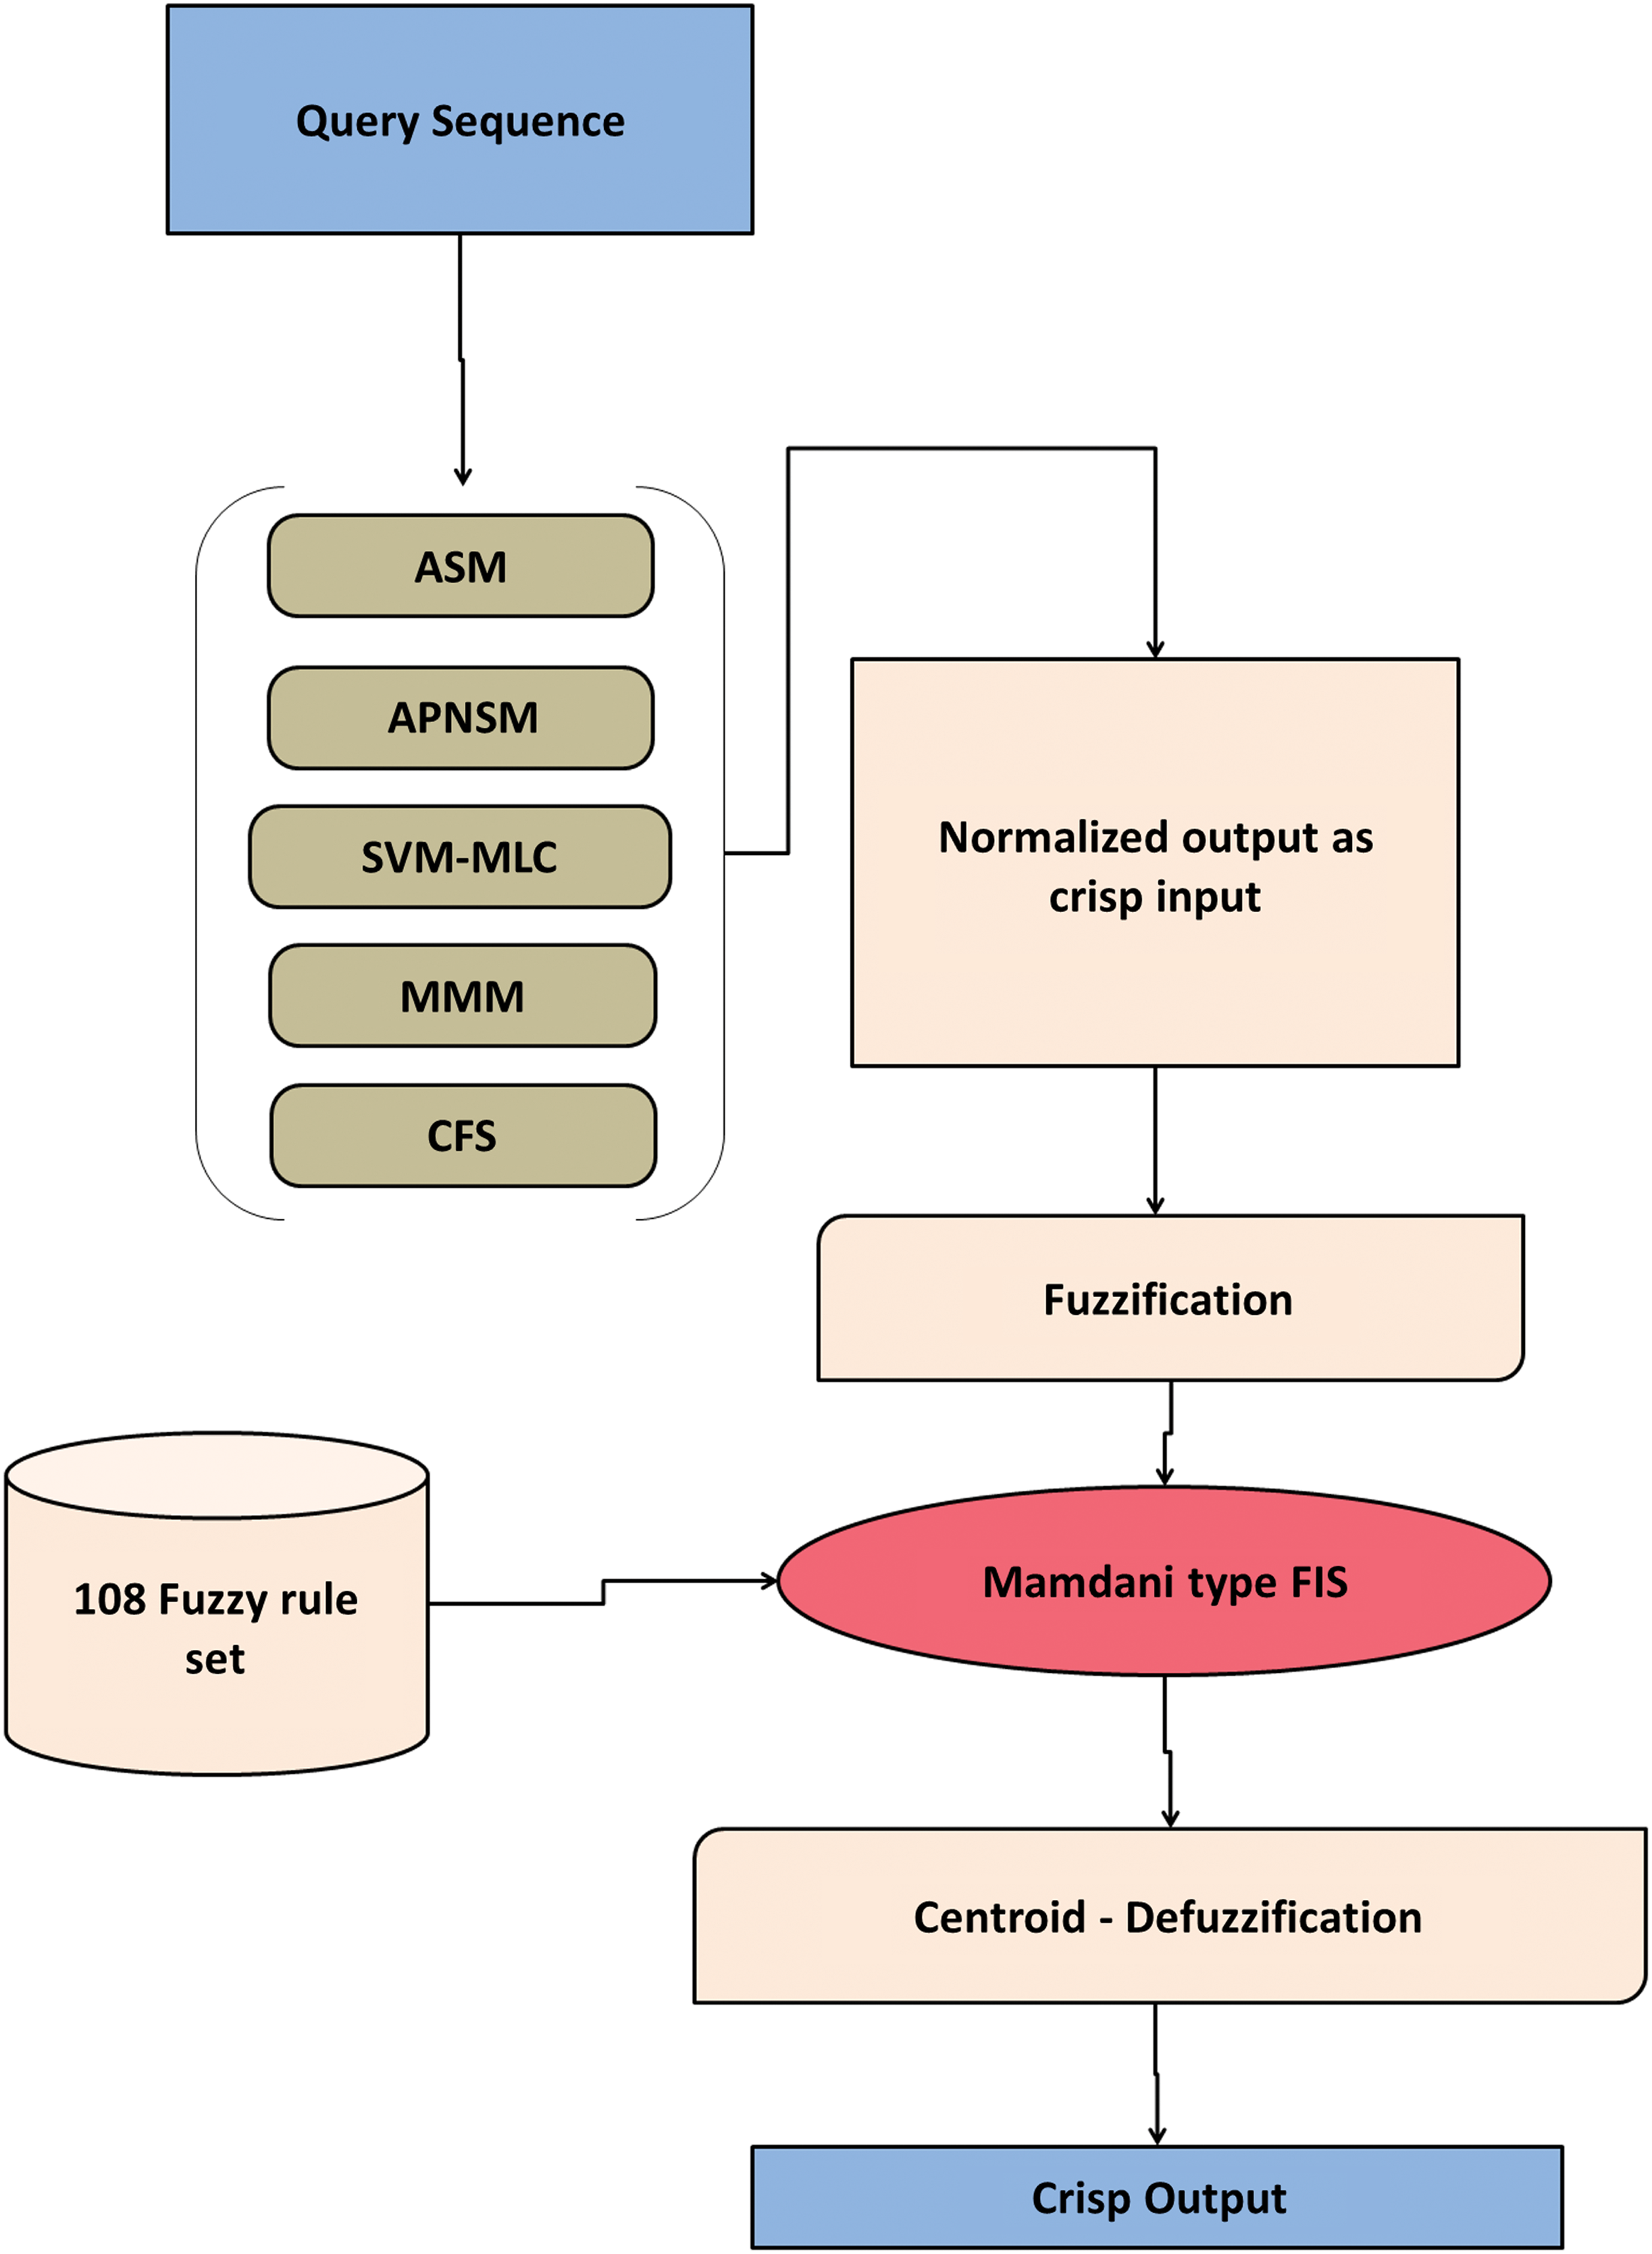
Architecture of FuzzyApp. APNSM, allergen-like putative nonallergen similarity module; ASM, allergen similarity module; CFS, classic FAO/WHO module; MMM, motif based module; SVM-MLC, Support vector machine based machine learning classifier.
Validation procedures
The efficiency of the SVM-MLC was validated using K-fold cross-validation, where K=10. For 10-fold cross-validation (10-CV), the Tr-Set dataset was randomly divided into ten-subsets and in each round of evaluation one subset was validated against the model built through other remaining subsets, ensuring that on each round one subset was retained for validation while others were used to train the model. Unseen dataset test was carried out on both SVM-MLC and FuzzyApp, using Ind-Set and APN-Ind-Set. For an unseen dataset test, the test data were not included in any of the training sets and even the test data were removed from the in-house databases used in the proposed method to avoid bias in the results. The sensitivity (SN), specificity (SP), Mathew's correlation coefficient (MCC), and overall accuracy (OA) for validation were computed as described below,
where TP is true positive (known allergens); TN is true negative (nonallergens); FN is false negative (known allergens predicted as nonallergens); FP is false positive (nonallergens predicted as allergens); and N the total number of allergens and nonallergens.
Results
Performance of SVM-MLC
Since SVM-MLC was used in FuzzyApp, the performances of SVM-MLC on 10-CV and unseen dataset test were compared with the AdaBoost-MLC of FIS (Table 2). Though the specificity of AdaBoost (0.98) was higher than SVM (0.91) on 10-CV, the sensitivity was found higher in SVM (0.86). Also, SVM-MLC performance was significantly higher (0.87) than AdaBoost-MLC (0.81) on unseen dataset test. Even though SVM was considered to be less prone to overfitting problems (Vatsa et al., 2008), receiver-operator characteristic graph (ROC) and area under ROC (AUC) were computed for both AdaBoost-MLC and SVM-MLC. The AUC values of SVM-MLC were found to be balanced and near to perfect on both dataset (Fig. 7A), while the values of AdaBoost-MLC were marginally less (Fig. 7B) than SVM-MLC. Also, the Mathew's correlation coefficient (MCC) values of SVM-MLC were more positively correlated in comparison to AdaBoost-MLC. Despite the fact that both MLCs were not trained with APN during training process, 7504 APN proteins were subjected to prediction by both classifiers. SVM-MLC accurately predicted 6530 APN as nonallergens, while AdaBoost-MLC predicted only 6303 as nonallergens. Hence, from the results it has been observed that though the AdaBoost–MLC performance was marginally high in specificity on 10-CV, SVM-MLC performance was better and balanced on both 10-CV and unseen data test.
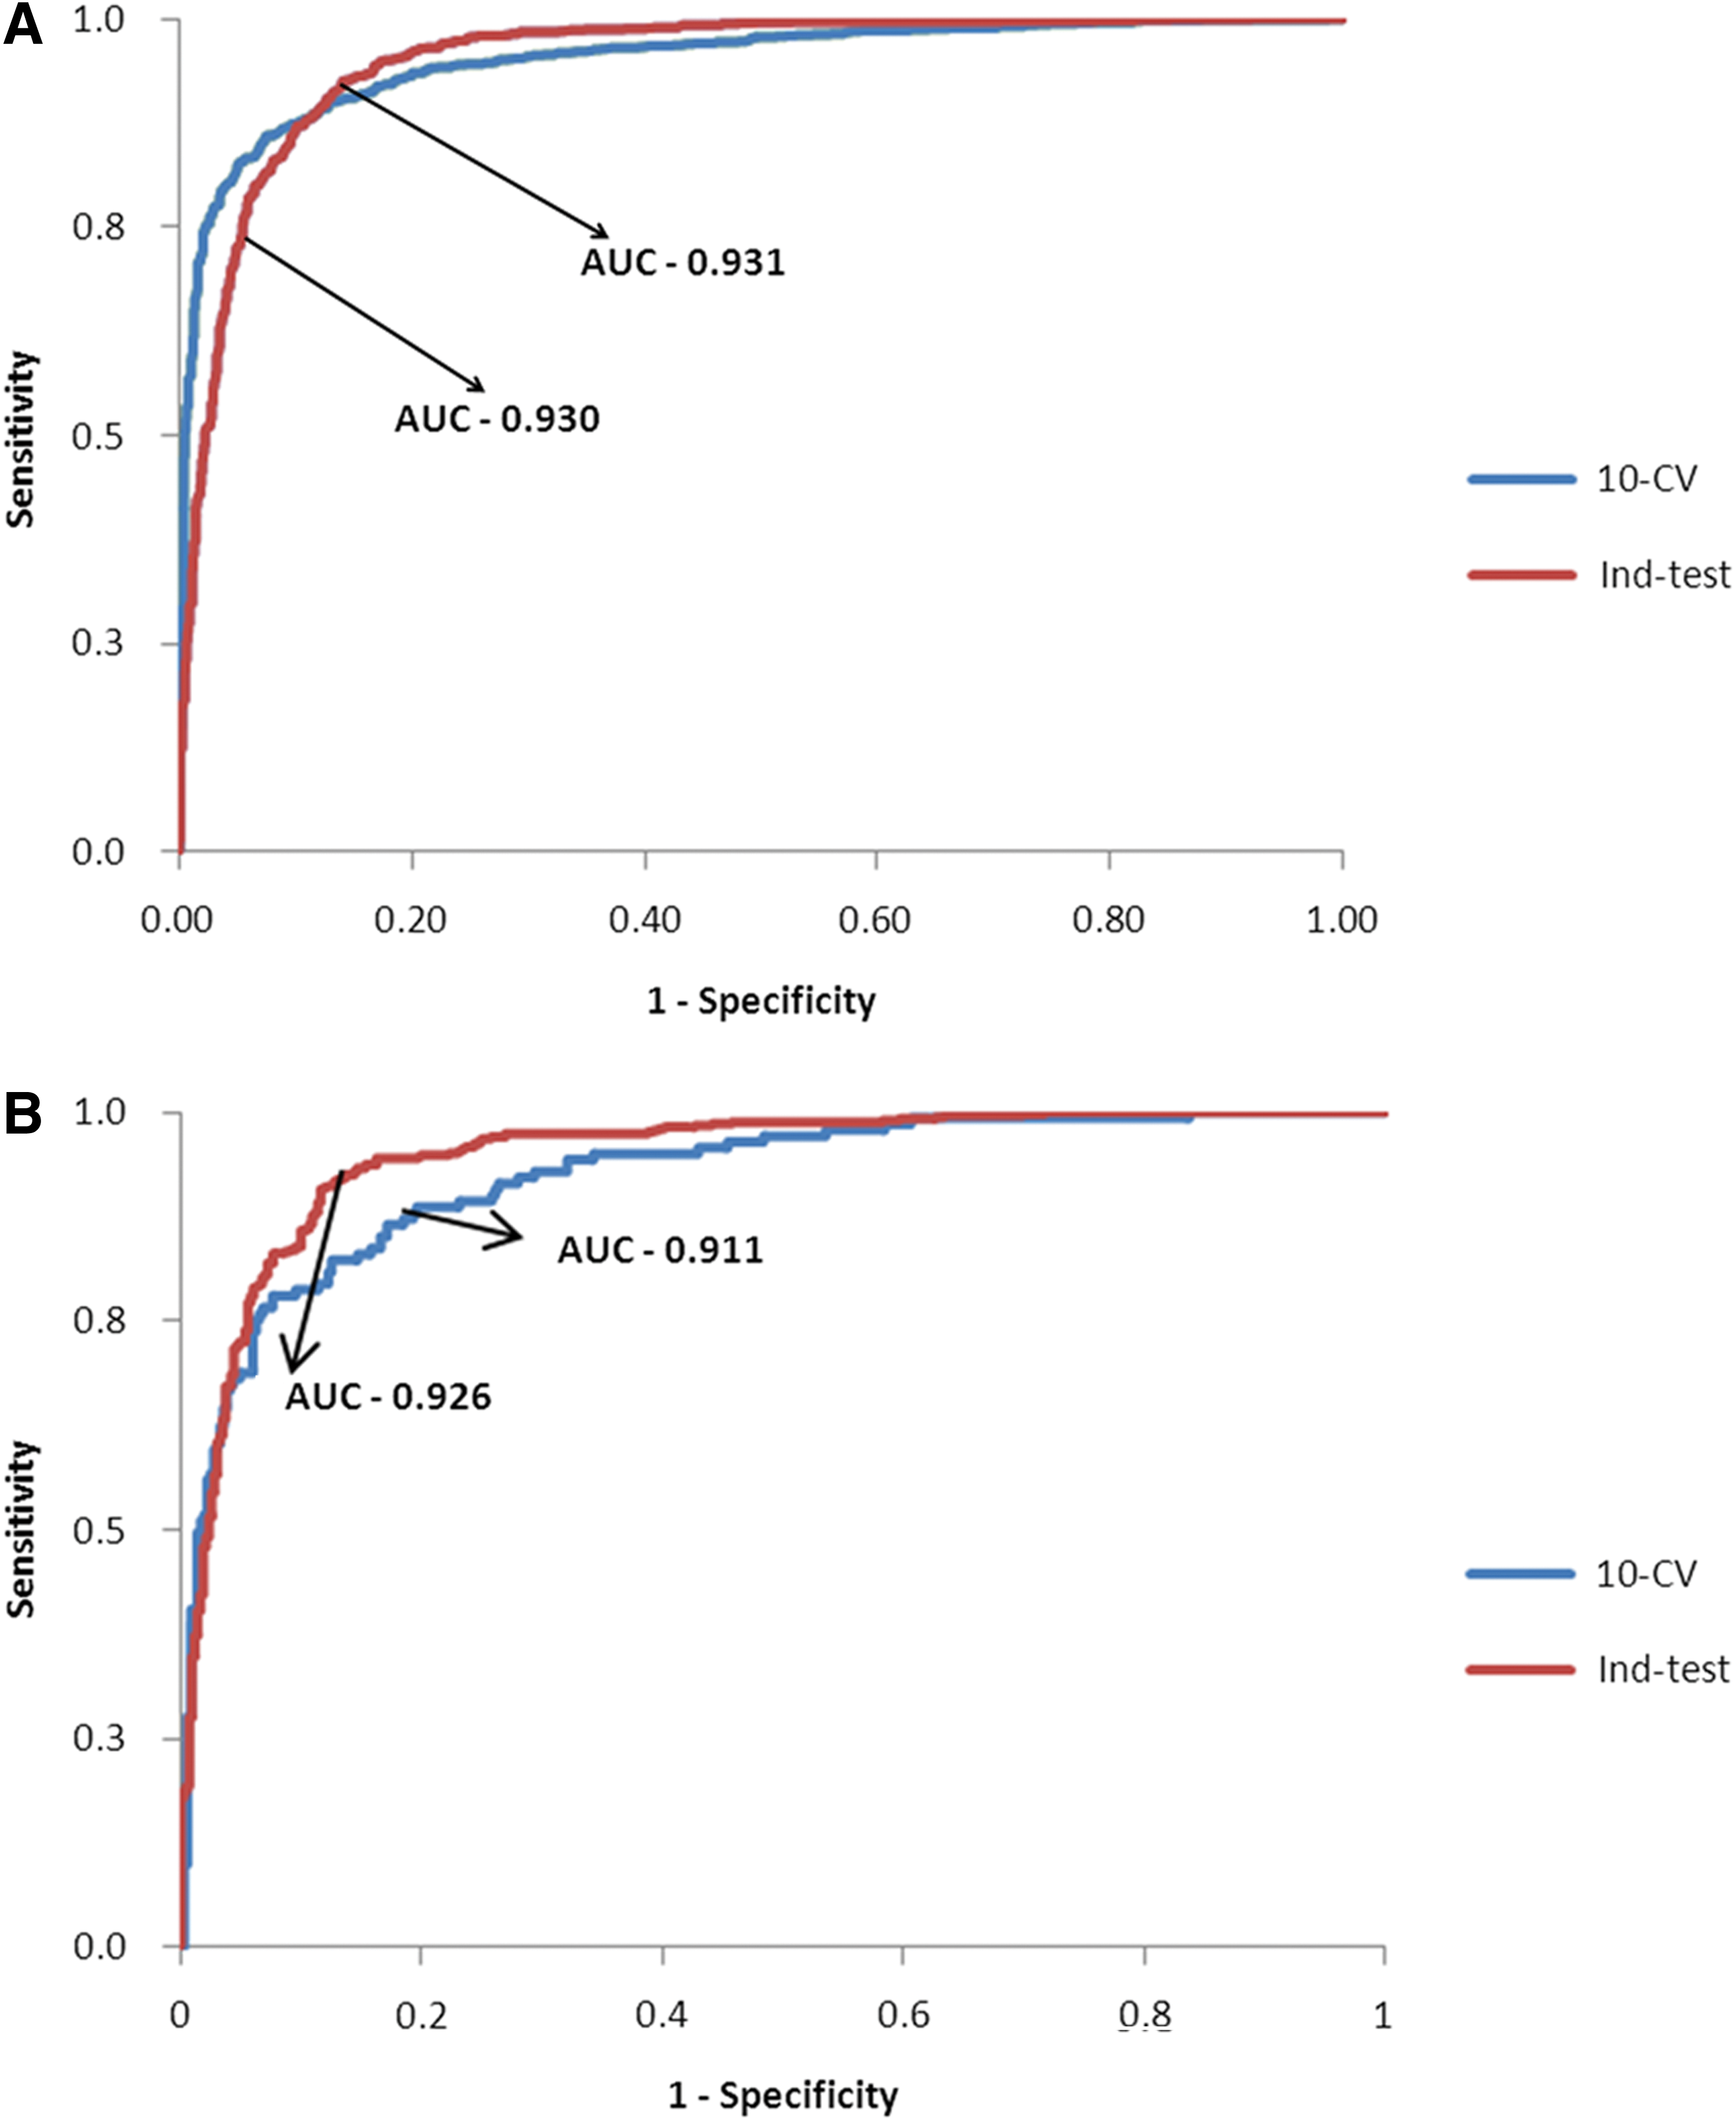
The receiver operator curve (ROC) and its corresponding area under curve for 10-fold cross validation and independent dataset test.
AC, accuracy; AUC, area under curve; MCC; Mathew's correlation coefficient. SN, sensitivity; SP, specificity. Highest value(s) in each test is
Effect of rectified fuzzy rules
Manual observation of fuzzy IF-THEN rules used in FIS (Saravanan and Lakshmi, 2013) led us to identify the use of misclassified output-variable category in FIS. The rules 8, 17, and 73; the rules 32, 82, 91, and 100; and rule 6 of FIS were reported to have the output variable assigned as nonallergen, might be an allergen, and allergen, respectively (Saravanan and Lakshmi, 2013). On evaluating the behavior of allergens, nonallergens, and APN on different modules, it has been found that the rules 6, 8, 17, and 73 should have the output-variable assigned as “might be an allergen” instead of “nonallergen” and rules 32, 82, 91, and 100 should have the output variable assigned as “nonallergen” instead of “might be an allergen” (see Supplementary Table ST1). Since FIS (Saravanan and Lakshmi, 2013) considered the output “might be an allergen” too as “nonallergen” for evaluating the results, the consequences of misclassified rules were not reflected in the sensitivity, specificity, and overall accuracy values computed in FIS. Hence, after incorporating the rectified rules in FuzzyApp, the number of proteins predicted as “might be an allergen” (reported for the Ind-set nonallergens) between FuzzyApp and FIS were compared. Out of 488 nonallergens (Ind-set), FIS (with misclassified rules) reported 443 proteins as “nonallergen”, 34 proteins as “might be an allergen,” and 11 as “Allergens,” whereas FuzzyApp (with rectified rules) reported 484 proteins as “nonallergen” and 4 proteins as “Allergen.” The result clearly indicates the influence of rectified rules in correctly distinguishing the “nonallergen”.
Comparison of FuzzyApp with other existing tools
Though several methods have been reported for allergen prediction, the methods available as working tools were alone considered in this study. The performances of proAP (Wang et al., 2013), SORTALLER (Zhang et al., 2012), AllerHunter (Muh et al., 2009), APPEL (Cui et al., 2007), AlgPred (Saha and Raghava, 2006), DASARP (Bjorklund et al., 2005), and FAO/WHO scheme (Ivanciuc et al., 2003; Mari et al., 2005) on Ind-Set were computed and compared with FuzzyApp (this article). The test dataset Ind-set contained 129 potent allergens, 488 nonallergens, and 826 APN (Table 1). As depicted in Table 3, FuzzyApp (sensitivity=90%; specificity=98%; MCC=0.87; and accuracy=97.9%) consistently outperformed all existing methods evaluated in this study. To evaluate the methods in accurately predicting the APN, specificity was calculated considering APN alone and APN+nonallergens separately. The results revealed that the sensitivity (correctly predicting the allergens as allergens) of FAO/WHO scheme was higher (97.8%) than the all other existing methods, but the corresponding specificity (27.9%) was too low, especially in predicting APN (0.03%), indicating its biasness towards predicting the allergens. In addition, the MCC value (MCC=0.001) of FAO/WHO scheme suggests that the method performs in random manner and has limitation in recognizing nonallergens. Also, similar imbalance could be observed in AlgPred (MCC=0.201), DASARP (MCC=0.29), proAP (MCC=0.35), and SORTALLER (MCC=0.48), suggesting the corresponding methods inefficiency in categorizing the APN. In contrast, FuzzyApp (MCC=0.87) was highly balanced, in terms of MCC, among all the methods tested. Moreover, the overall accuracy of FuzzyApp reached 97.90% and stood highest among other methods tested. Further, the prediction errors were computed for all the methods and compared (Fig. 8). It is observed that FuzzyApp errors were least in predicting nonallergens and APN (1.3% and 1.7%, respectively), while other methods errors were comparatively high (Fig. 8).
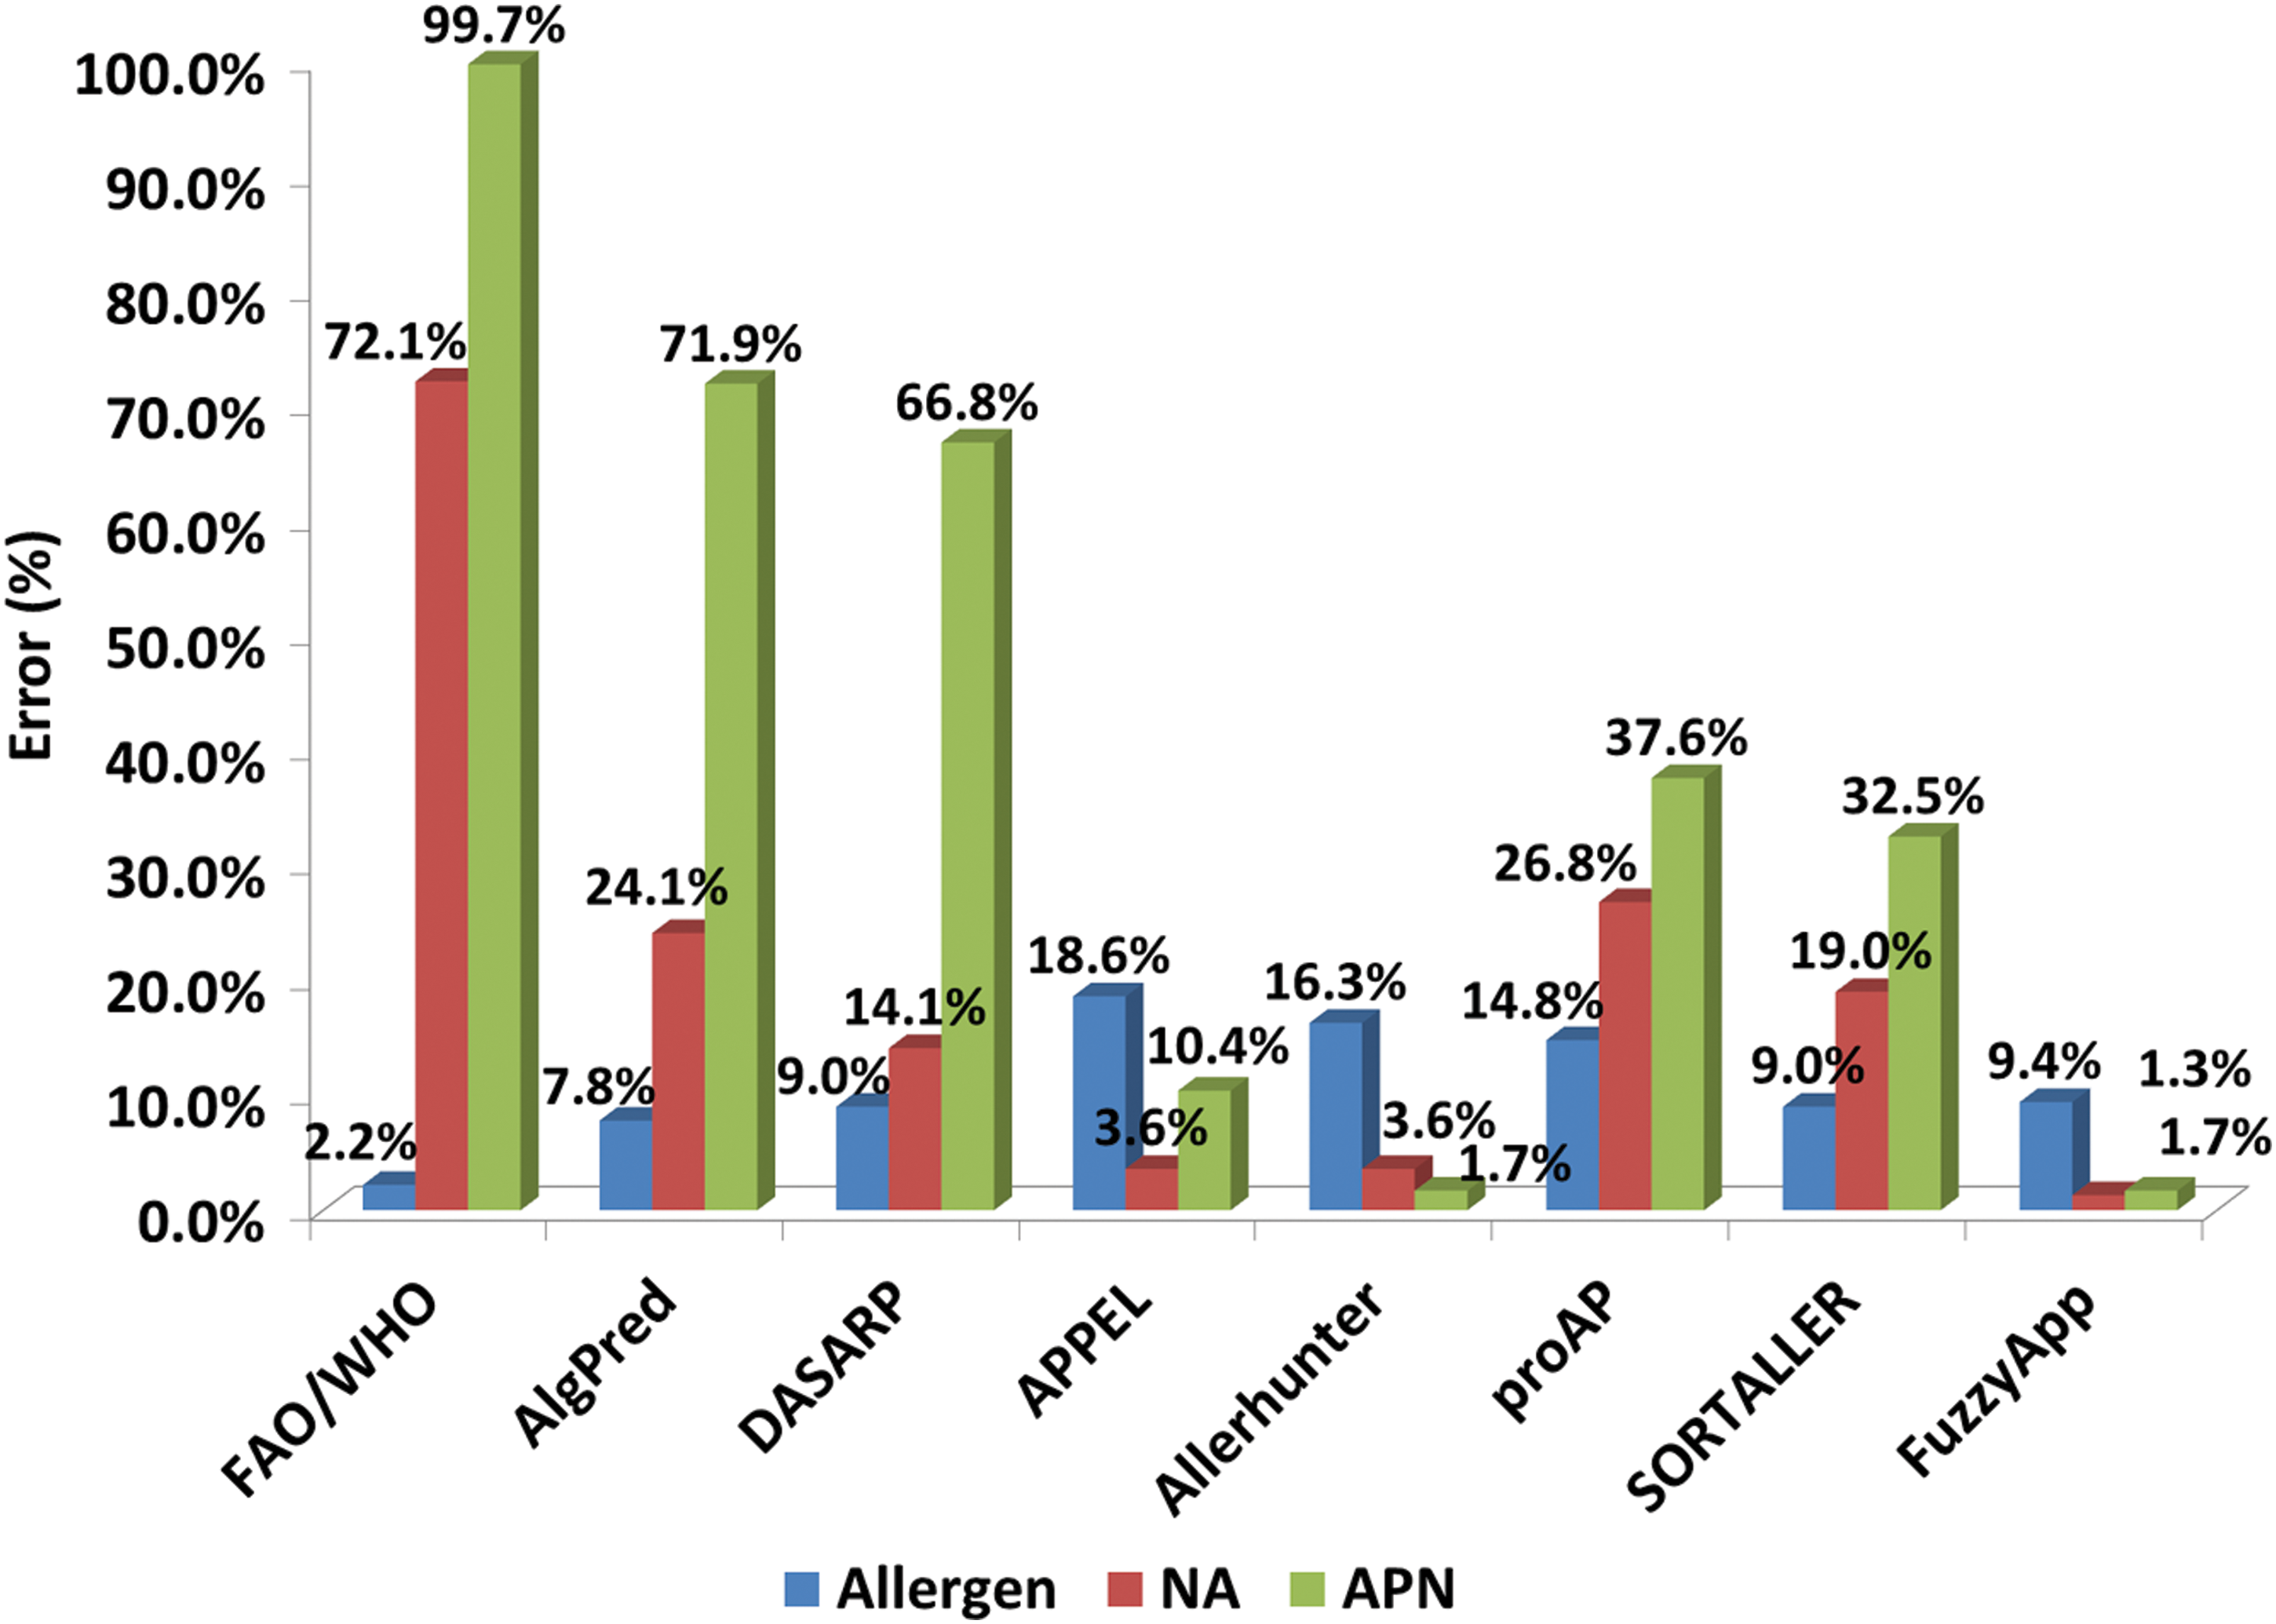
Error analysis of reported methods on Ind-Set.
values as reported in (Muh et al., 2009); bcomputed in this study. *The values are computed by not considering “might be an allergen” as “nonallergen” and hence vary from values reported by Saravanan and Lakshmi (2013). Highest value in the columns is
APN, allergen-like putative nonallergen; MCC, Mathew's correlation coefficient; NA, nonallergen.
The analysis suggests that the error rates of the proposed method were less and could possibly predict the unknown instances correctly over other reported methods. In addition to the unseen dataset test, four allergenic and nonallergenic tropomyosins from animals and insects were subjected to prediction by all methods. With reference to the earlier study (Mikita and Padlan, 2007), the tropomyosins from Dust Mite, Cockroach, Sand shrimp, and Herring worm were considered allergenic, and tropomyosins from Human, Bovine, Wild boar, and Red jungle fowl were considered nonallergenic. In spite of the high sequence similarity between the allergenic and nonallergenic tropomyosins, FuzzyApp predicted the nonallergenic and allergenic tropomyosins accurately, while other tools, except AllerHunter, reported either all tropomyosins as allergenic or all to be nonallergenic (Table 4). This suggests that the existing allergen prediction methods were not capable of distinguishing the allergen and nonallergen when a high sequence similarity exists between them. The reason for AllerHunter predicting the allergenic and nonallergenic tropomyosins correctly is due to fact that the test data (nonallergenic tropomyosins) were part of the AllerHunter's APN training dataset, Whereas FuzzyApp has not been trained with the APN and the test data (allergenic and nonallergenic tropomyosins) were not a part of training dataset used in FuzzyApp (see Materials and Method section). The considerable differences in specificity (∼3%), MCC (∼5%), and accuracy (∼4%) between the FIS and FuzzyApp indicates the role of SVM-MLC and rectified fuzzy rules (adopted in FuzzyApp) in improving the prediction efficiency over AdaBoost-MLC and misclassified fuzzy rules adopted in FIS. In general, the results of unseen dataset test and tropomyosin prediction test revealed that the proposed FuzzyApp's performance was consistent and outperformed all other existing methods in distinguishing allergens, nonallergens, and APN.
X, false prediction; ✓, true prediction.
FuzzyApp performance on whole proteome of Arabidopsis thaliana
To evaluate the consistency of the proposed method, the whole proteome of the model plant Arabidopsis thaliana was subjected to prediction using FuzzyApp. Unlike earlier studies (Cui et al., 2007; Muh et al., 2009; Stadler and Stadler, 2003), the proposed method was not evaluated on swiss-prot entries, because the proposed method includes similarity modules ASM and APNSM which contain entries from swiss-prot and therefore could make bias in the prediction. The A. thaliana proteome contains 35,386 proteins, of which FuzzyApp predicted 130 or 0.37% proteins as “allergen” and remaining 35,256 or 99.63% proteins as “nonallergen.” The results were in agreement with the Interpro annotation of TAIR database (Poole, 2007), which reported 132 or 0.37% proteins as allergen, signifying the consistent performance of FuzzyApp.
FuzzyApp features
The server currently allows user to submit a maximum of 50 sequences at a time and supports both FASTA formatted sequences and UniProt ID's as input. On every submission, server generates a job ID, which could be used to access the job at a later instance using retrieve job tab. To show how FuzzyApp elucidates prediction, here we provide an interpretable output generated by FuzzyApp for an input protein (Uniprot ID: O46206). “Since Machine learning module predicts the query to be Allergen (1) and the global similarity of query protein against known allergen (Subject:O46207) has 97.01% global identity with an e-value of 2.4e-46 ; and the sequence similarity of 80 window query protein (Window_Pos:14-93) against known allergen (Subject:O46208) has 98.75% identity with an e-value of 1.8e-32 ; and query protein has no significant similarity with allergen-like nonallergens; and motif module predicts the presence of allergen-motif of Length=134 with significant e-value of 1.7e-22, the FuzzyAPP predicts the query protein tr|O46206| to be a Potent Allergen.” With this output, the user can easily comprehend why and what features were responsible for the prediction.
Discussion
Due to the amplified focus on personalized medicine, the use of biopharmaceutical products and their medicinal trials have greatly increased (Long and Works, 2013). Hence, such products have to be assessed for the presence of allergenic protein before they were utilized (Vargas et al., 2013). This study was focused on developing an efficient computational tool for predicting the allergenicity of the protein from the sequence information. Though several methods have been reported earlier to predict the allergenicity of the proteins, it remains challenging to predict the query as allergen and nonallergen when there exists significant sequence similarity with nonallergens and allergens, respectively. Unlike other studies (Saha and Raghava, 2006; Zhang et al., 2012), which were designed for predicting allergens of particular species, family, and type, this study included all categories of allergens. The proposed method incorporated existing approaches (motif based and WHO/FAO scheme), along with other proposed approaches (similarity modules with allergen and APN; and SVM_MLC), and fuzzy rule based system to predict the quality of the query sequence. Deprived of the SVM-MLC module being trained with the APN, the module has shown to be effectively distinguish the APN from allergens, which was evident from the higher accuracy (87%) in predicting the APN as nonallergens (Table 2). This may be due to the fact that the feature vector adopted in SVM-MLC considers compositional, centrodial, and translational relatedness of sequence rather than mere amino-acid frequency (Saha and Raghava, 2006), physio-chemical properties (Cui et al., 2007) or pairwise similarity profile (Muh et al., 2009) used in earlier methods. Moreover, the possible drawback of motif-based approach was its inability to distinguish the APN from allergens. Having significant sequence similarity with allergens, APN may possibly have allergen representative motif(s) that makes them to be reported as allergens. This was evident from the low APN specificity (33.2%) by DASARP (Bjorklund et al., 2005) on Ind-Set (Table 3).
Considering that APN may also have allergen motifs, and all allergens may not necessarily possess a common motif or representative peptides (Pfiffner et al., 2012), the proposed method was designed to make prediction based on hybrid approach and does not rely on any single module alone for the final prediction. Although AlgPred (Saha and Raghava, 2006) and proAP (Wang et al., 2013) adopted hybrid approach for the allergen prediction, it relays only on consensus output for the decision making. The proposed method (FuzzyApp) makes decision based on fuzzy “IF-THEN” rules derived from five modules, allowing the FuzzyApp to outperform AlgPred and proAP by 50% and 8%, respectively, in overall accuracy (Table 3). As expected, the use of multiple approaches combined with fuzzy inference system enhanced the prediction accuracy (Table 3), especially in recognizing the APN as nonallergen, in contrast to the methods FAO/WHO (FAO/WHO, 2003), DASARP (Bjorklund et al., 2005), APPEL (Cui et al., 2007), AllerHunter (Muh et al., 2009), SORTALLER (Zhang et al., 2012), and proAP (Wang et al., 2013) that adopted single approach for predicting the allergens.
In addition, the error analysis (Fig. 8) and whole proteome analysis of A. thaliana suggest that the proposed method was consistent and less prone to prediction errors. Unlike other reported methods, FuzzyApp outputs the detailed results of each module making the user to comprehend why and what features led to the prediction. Being still unclear about the features that are unique to allergens and the intricate nature of allergenic cross-reactivity (McClain et al., 2014), the proposed ensemble method would aid in effectively distinguishing allergens, nonallergens, and APN.
Conclusion
The primary aim of this study was to overcome the existing problem of differentiating allergens and nonallergens when they share significant sequence similarity with known nonallergens and allergens, respectively. This was achieved by incorporating the results of five different modules and fuzzy-rule based system to assess the quality of query protein. FuzzyApp utilizes ensemble approach to predict the allergenicity of proteins, which was in agreement with the guidelines by FAO/WHO (2003), according to which use of multiple approaches was recommended rather than any single approach (FAO/WHO, 2003; Goodman et al., 2005; Mcclain et al., 2014). Further, various validation tests revealed the ability of FuzzyApp in differentiating allergens and nonallergens effectively, especially the APN, compared to other existing methods. In addition, the proposed method was implemented as a user-friendly webserver. The comprehensive output and user friendly front-end make FuzzyApp a useful tool for researchers in predicting the allergenicity of the proteins. We suggest fuzzy logic driven analytical approaches deserve future consideration in novel biomarker and diagnostic discovery and development.
Footnotes
Acknowledgment
Saravanan Vijayakumar is supported by the DBT-BINC, senior research fellow. The authors thank Centre for Bioinformatics for providing necessary computing facility and Dr. Archana Pan (Centre for Bioinformatics, Pondicherry University) and Dr. Sivasathya (Department of Computer Science, Ponidcherry University) for their valuable suggestions.
Author Disclosure Statement
The authors declare that there are no conflicting financial interests.
References
Supplementary Material
Please find the following supplemental material available below.
For Open Access articles published under a Creative Commons License, all supplemental material carries the same license as the article it is associated with.
For non-Open Access articles published, all supplemental material carries a non-exclusive license, and permission requests for re-use of supplemental material or any part of supplemental material shall be sent directly to the copyright owner as specified in the copyright notice associated with the article.
