
Abstract
Abstract
Metabolomics in systems biology research unravels intracellular metabolic changes by high throughput methods, but such studies focusing on liver transplantation (LT) are limited. Microdialysate samples of liver grafts from donors after circulatory death (DCD; n=13) and brain death (DBD; n=27) during cold storage and post-reperfusion phase were analyzed through coulometric electrochemical array detection (CEAD) for identification of key metabolomics changes. Metabolite peak differences between the graft types at cold phase, post-reperfusion trends, and in failed allografts, were identified against reference chromatograms. In the cold phase, xanthine, uric acid, and kynurenine were overexpressed in DCD by 3-fold, and 3-nitrotyrosine (3-NT) and 4-hydroxy-3-methoxymandelic acid (HMMA) in DBD by 2-fold (p<0.05). In both grafts, homovanillic acid and methionine increased by 20%–30% with each 100 min increase in cold ischemia time (p<0.05). Uric acid expression was significantly different in DCD post-reperfusion. Failed allografts had overexpression of reduced glutathione and kynurenine (cold phase) and xanthine (post-reperfusion) (p<0.05). This differential expression of metabolites between graft types is a novel finding, meanwhile identification of overexpression of kynurenine in DCD grafts and in failed allografts is unique. Further studies should examine kynurenine as a potential biomarker predicting graft function, its causation, and actions on subsequent clinical outcomes.
Introduction
W
Microdialysis is a technique for sampling the chemistry of the interstitial space of individual tissues and organs (Davies and Lunte, 1995; Ungerstedt, 1991; Ungerstedt et al., 2009). With microdialysis, molecules are extracted from the extracellular fluid compartment by perfusion of a tubular semi-permeable membrane with an isotonic fluid, which is then analyzed by various analytical platforms. It has been shown to be an ideal tool to monitor tissue metabolism continuously in the transplanted liver (Silva et al., 2005; 2006). Coulometric electrochemical array detection (CEAD) is a technique with very high sensitivity, one that is directly applicable to the redox active molecules within the metabolome commonly associated with disease states and oxidative stress. CEAD has been recognized as a valuable addition to analytical platforms appropriate for metabolomics studies (Gamache et al., 2004; Yao and Cheng, 2004). Previous studies have demonstrated microdialysis as a valuable tool to monitor the basic metabolic changes of the liver, both in real time and in vivo through the entire journey of human LT (Silva et al., 2006; 2008). We have studied the application of CEAD as the analytical platform to study hepatic microdialysate samples in a proof-of-principle study (Hrydziuszko et al., 2010). The aim of this study is to investigate cellular metabolism globally within the liver, through the process from cold storage to post-reperfusion, using a combination of microdialysis with electrochemical metabolomics. The specific objective is to identify metabolic pathways or profiles that differ between DBD and DCD grafts during the complex process of IRI in human deceased donor liver transplantation.
Materials and Methods
This study was approved by the Regional and National Research Ethics Committee (REC), and adult patients listed for LT were formally invited to take part. Following a one-to-one consultation with an investigator, a detailed consent form was signed by those willing to participate. Patients undergoing emergency LT were not considered for the study, and those receiving a re-graft or split graft were also excluded. A hepatic microdialysis catheter was introduced to the liver graft while it was in an ice bath during the bench preparation and was infused with microdialysis perfusion fluid via a CMA microdialysis pump. The returning sample was collected in microvials. This was continued until the liver was taken out of ice for implantation. Once the liver graft was reperfused in the recipient, a fresh microdialysis catheter was introduced and brought out through the abdominal incision at abdominal closure, and the same process of continuous microdialysis was repeated. Samples were collected at every 6 hours for a total of 48 hours (Silva et al., 2006; 2008) and stored at −80°C. These were then analyzed by coulometric electrochemical array detection (Coularray; CEAD), a 16-channel metabolomics system. Aliquots of the untreated microdialysis samples (5 μL) were injected into the CEAD and chromatographic data were stored as electrode-time maps.
Microdialysis
The sterile, single use CMA 61 Hepatic Microdialysis Catheter (CMA Microdialysis®, Stockholm, Sweden) has a shaft length of 310 mm and a 31 mm long semi-permeable membrane with a 20 kDa cut-off for solutes. The CMA 107 Microdialysis Pump (CMA Microdialysis) has been developed to function together with CMA microdialysis catheters and is a portable, battery-driven and micro-processor controlled syringe pump and was set at low-flow rate (0.3 μL/min). A syringe supplied with the kit was filled with 2.5 mL of perfusion fluid (CMA Microdialysis; 10 mL; composition: Na+, 147 mmol/L; K+, 4.0 mmol/L; Ca2+, 2.3 mmol/L; and Cl-, 156 mmol/L) and connected to the microdialysis catheter. Returning microdialysate samples were collected at the following time periods: Bench sample: during bench preparation of liver until the graft was taken out for implantation; and at 6 hour time intervals from reperfusion for a period of 48 hours. Thus a maximum of nine microdialysis samples were collected from each liver allograft from the cold storage to early post-reperfusion period and were stored in −80°C. In addition, histological assessment of ischemia-reperfusion injury was performed in each allograft. A Menghini biopsy needle [11520-19, 19 swg (1.0 mm)×70 mm; Dixons Surgical Instruments Ltd, Wickford, Essex, UK] was used to obtain a core biopsy, during cold phase (t-1), and following reperfusion (t0). These two biopsies from each graft were fixed in 10% formaldehyde for histological assessment of ischemia reperfusion injury using a previously described score (Neil and Hubscher, 2001).
Coulometric electrochemical array detection (Coularray; CEAD)
All microdialysis samples were analyzed on the Coularray 5600A 16-channel metabolomics system, under the control of Chromeleon software (Thermo Fisher Scientific, UK). The column used was a Luna 5 μ C18(2) (100×4.6 mm; Phenomenex, UK), maintained at a temperature of 35°C. Mobile phase A consisted of 20 mM sodium dihydrogen phosphate, and 1.5×10⁻⁴ M sodium heptane sulfonic acid, adjusted to pH 3.2. Mobile phase B consisted of 95% (v/v) methanol, 5% deionized water, and 1.5×10⁻⁴ M sodium heptane sulfonic acid. Mobile phase flow-rate was maintained at 800 μL/min throughout. The gradient profile over the 45 min run time is shown in Figure 1.

The curve displays the percentage of mobile phase B in the eluent over the 45 min time period for each sample injection, the remainder being mobile phase A.
In the coulometric array, cell 1 was set at a potential of −150 mV, cell 2 at 0 mV, with cells 3–16 ranging from 60 to 840 mV, in 60 mV intervals. Aliquots of the untreated microdialysis samples (5 μL) were injected, and data acquisition stopped at 38 minutes. After every 10 sample injections, a reference standard containing 27 known electroactive compounds (each at concentration of 5 μM) was injected to monitor for retention time drift and changes in electrode sensitivity. Raw chromatographic data from individual microdialysis samples were stored as electrode-time maps, showing the signal from all 16 cells at the time that any peak was detected. In order to compensate for inevitable small differences in retention times, between and within batches, proprietary Coularray software was used to align the peaks from each sample to a reference chromatogram, achieved by the alignment of three amino acid peaks (methionine, tyrosine, and tryptophan). Following peak alignment, the data were compressed to produce 866 time windows across the chromatogram (from 1.5 to 37.5 min). The average signal output across all 16 cells of the array was displayed for each of these time windows.
Data analysis
The CEAD data were formed into three analysis datasets consisting of the bench sample, the first post-reperfusion sample, and a time trend analysis set consisting of all post-reperfusion samples from 6 to 48 hours. The three datasets were processed separately prior to data analysis. First, each sample was normalized by dividing by the median signal intensity. This was done separately for a window above and a window below 7 min, since signal intensity was much higher prior to 7 min,. Only windows where the maximum signal across samples was above a noise threshold were retained. These were grouped into peaks using a heuristic peak finding algorithm (Rolinski et al., 2007). Fairly liberal parameters of 0.5% of the maximum peak to retain a peak and 5% drop between peaks to separate peaks were used to avoid merging separate metabolite peaks. Peak areas were calculated by summing all windows within a peak for each sample and a retention time was assigned. Putative identification of metabolite peaks done with retention times matched to the mean values above (±5%), in addition to the potential at which maximum oxidation occurred (±60 mV) (Table 1). Metabolites containing more than one oxidizable group may have more than one maximum potential, and this is again characteristic for identification purposes.
Statistical analysis for the metabolite data was conducted using methods similar to those used previously for proteomics and microarrays (Higdon et al., 2013; Kolker et al., 2012; Smyth, 2004). T-tests and linear regression models were fit to individual peaks from the bench and first reperfusion datasets to find associations between metabolite peak intensity and donor type, cold-ischemia time, and the interaction between donor type and ischemia time. Expression ratios and p values were reported for each comparison and metabolite peak. Repeated measures ANOVA was applied to each peak in the time trend dataset to determine if there were any overall trends versus post-reperfusion time and whether those trends varied with donor type and cold ischemia times. In addition, datasets were created for the mean of all post-reperfusion samples and the slope over time (calculated by a linear regression versus post-reperfusion time) for each metabolite peak in order to describe broad shifts in metabolite peak intensity and general upward or downward trends in intensity.
Results
The study group consisted of 40 patients (DCD, n=13, and DBD, n=27). There were no procedure-related complications during the insertion of the microdialysis catheter and in all patients catheter removal after 48 hours of sampling was uneventful. The donor characteristics, the cold ischemia time elapsed before insertion of the first microdialysis catheter, total cold ischemia time (CIT), implantation time of each graft and degree of IRI scored after reperfusion have been summarized in Table 2. A total of 36 bench and 280 (from 39 out of 40 patients) post-reperfusion microdialysate samples were analyzed and included in the data analysis. Overall, the donor types do group together based upon the bench sample and first reperfusion metabolite expression patterns as can be seen in the clustering on top of Figure 2. However, the metabolite patterns are not sufficient to completely separate the donor types (DCD vs. DBD).
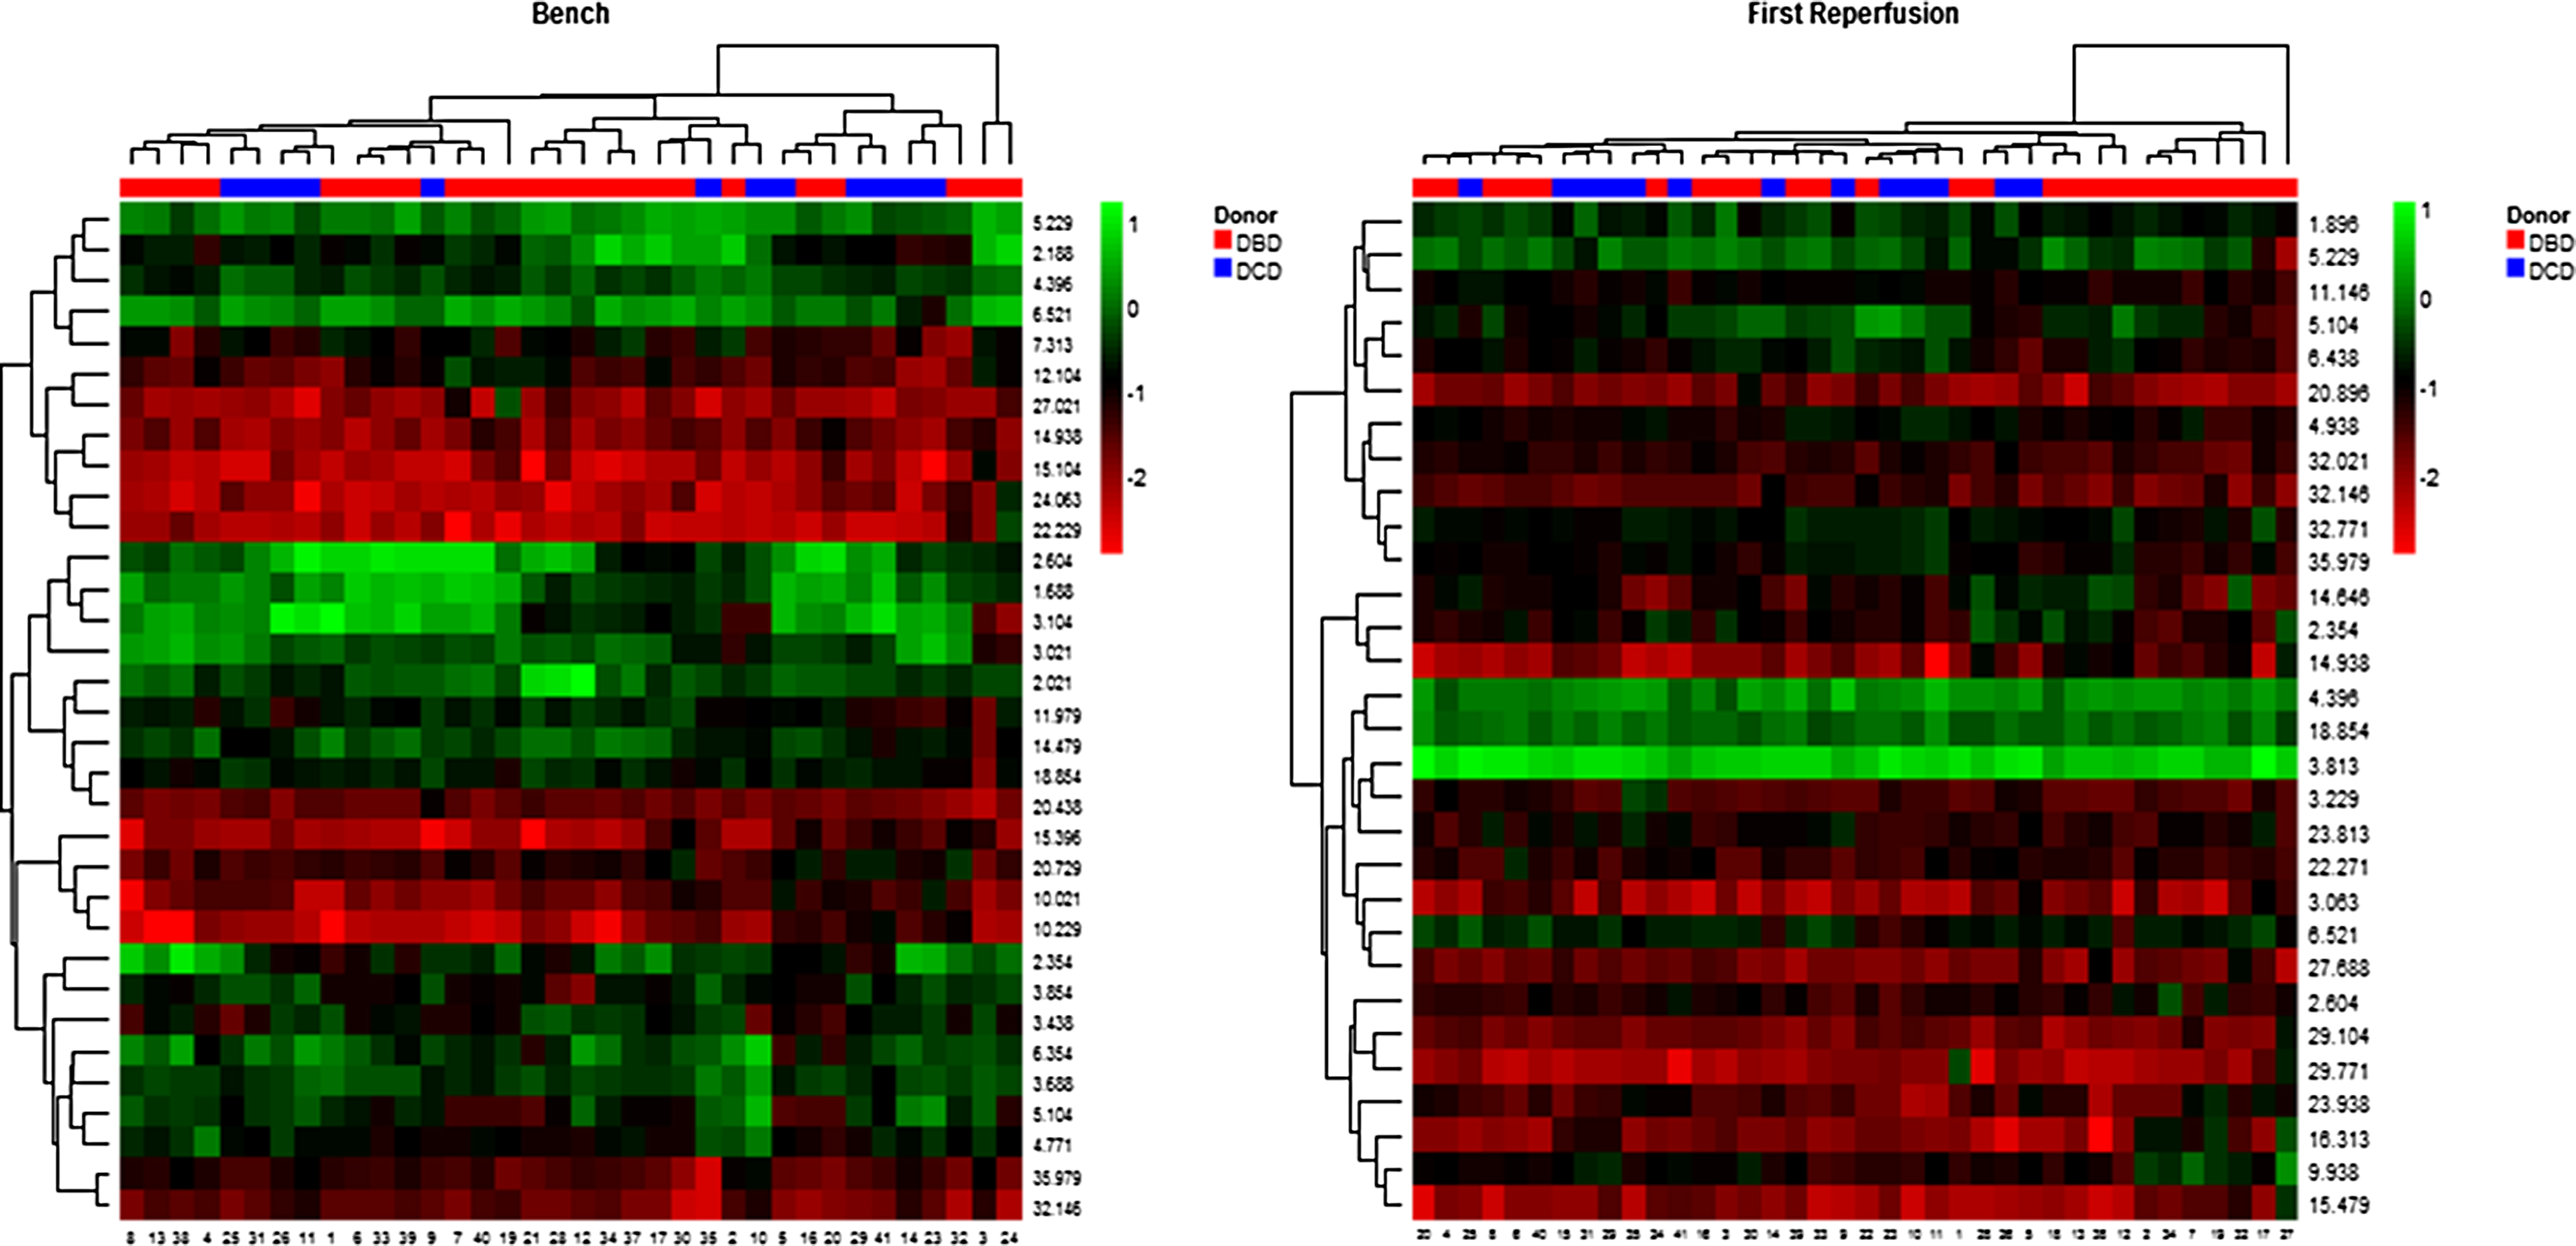
Heat map of normalized metabolite expression values. Columns represent patient samples (Red DBD, Blue DCD), and rows represent the metabolite peaks labeled by their retention time. Samples and peaks are clustered by expression patterns.
Includes steatosis, ischemia times, and degree of ischemia reperfusion injury assessed by histology following reperfusion.
ALD, alcoholic liver disease; BMI, body mass index; CIT, cold ischemia time; DBD, donation after brain death; DCD, donation after circulatory death; HBV, hepatitis B virus; HCV, hepatitis C virus; IRI, ischemia reperfusion injury; MELD, model for end stage liver disease; N/A, not applicable for DBD donors; PBC, primary biliary cirrhosis; PSC, primary sclerosing cholangitis.
Significance p<0.05 at 95% confidence interval, Mann-Whitney U test for two independent samples.
Metabolic differences in bench microdialysates
Samples from cold phase indicated metabolites peaks occurring at 3.85, 5, and 10 min are overexpressed in DCD compared with the DBD grafts. The peaks putatively correspond to uric acid, xanthine, and kynurenine. The metabolite expression ratio (ER) was 3.04 (p=0.0003), 2.81 (p=0.02), and 3.10 (p=0.02), respectively. Peaks at 6.5, 12, and 14.5 min with corresponding expression ratios of 0.45 (p=0.003), 0.39 (p=0.009), and 0.48 (p=0.02) corresponded to metabolites that were two times overexpressed in DBD compared with the DCD grafts. The peaks at 6.5 and 14.5 min have a weak but not confirmable correspondence to HMMA, and 3-nitrotyrosine and the 12-min peak does not correspond to any of our reference metabolites.
There were differences in metabolites corresponding to the difference in CIT for the bench samples with peaks occurring at 12 and 27 min increased in intensity with prolongation of CIT (approximately 30% increase with each 100 min increase in CIT). The peak at 27 min is putatively identified as homovanillic acid.
First reperfusion sample and impact of cold ischemia elapsed
The first post-reperfusion sample obtained at 6 hours (or 12 h for 7 patients due to inadequate dialysate present in 6 hour post-reperfusion sample) showed few overall differences between donor types. Overall, across all samples the metabolite peaks occurring at 2.35 and 22.27 min were decreased with prolonged CIT (approximately 20% decline in concentration per 100 minutes inc in CIT). These metabolites could not be referenced; hence the biological significance of these metabolite changes could not be assessed.
The metabolite peak signal at 2.6 min has an association with increasing CIT that is dependent on donor type (p=0.001). With each 100 min increase in CIT the concentration of metabolite at 2.6 was reduced approximately by 20% in DCD grafts, whereas the same metabolite increased in DBD grafts by approximately a similar margin. This peak putatively corresponds to methionine.
Post-reperfusion time trend analysis
Analysis of trends in metabolic intensities in post-reperfusion samples ranging from 6 h to 48 h was carried out to identify changes over time among the sample. Illustrated in figures are the time trends and how these peaks identified by the previous bench and first reperfusion samples vary across graft types. The metabolite peak at 5.2 min had a very high concentration immediately after reperfusion, but decreased in intensity following the reperfusion (Fig. 3). The peak at 10.0 min showed a steady increase in intensity after reperfusion while the peak at 14.6 min showed a decline. These upward and downward trends are also illustrated by the distribution of slopes of metabolite intensity versus post-reperfusion time (Fig. 4) where nearly all patients have negative slopes for the peaks at 5.2 and 14.6 min and positive slopes for the peak at 10.2 min.
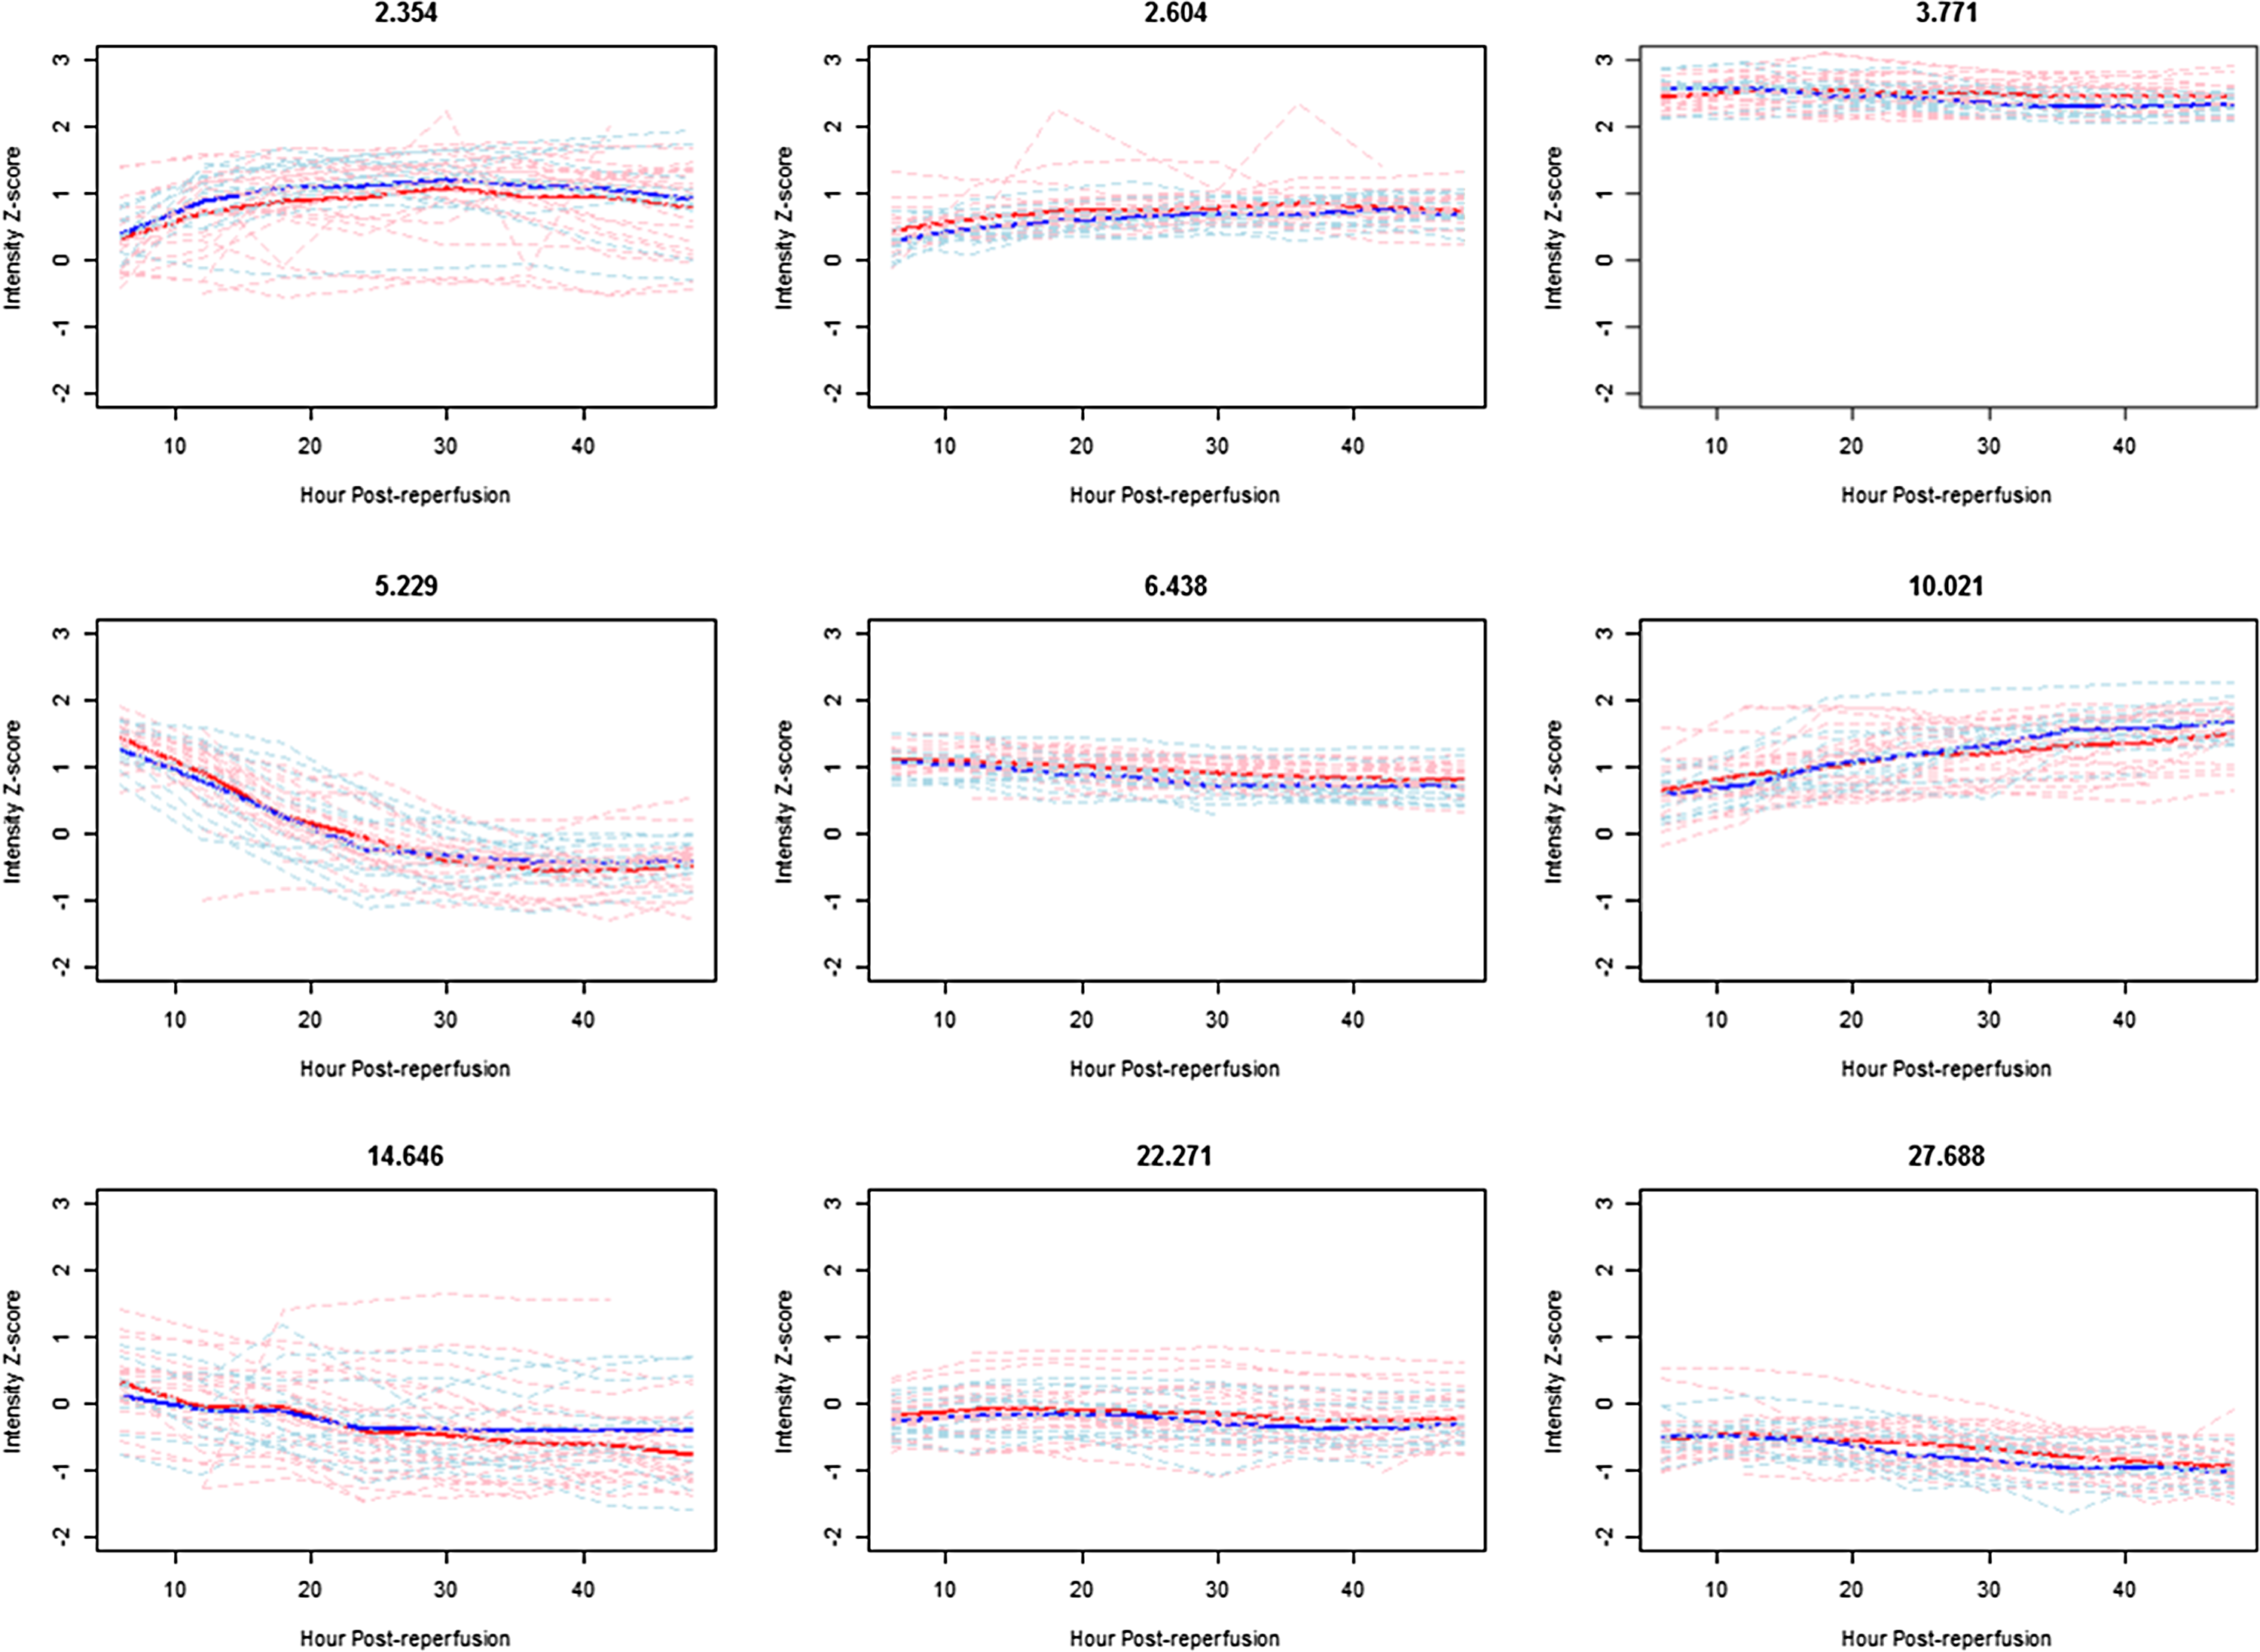
Plots of mean trend (DBD red, DCD blue) and individual subject trends (DBD pink, DCD light blue) versus post-reperfusion time comparing donor types for selected metabolite peaks.
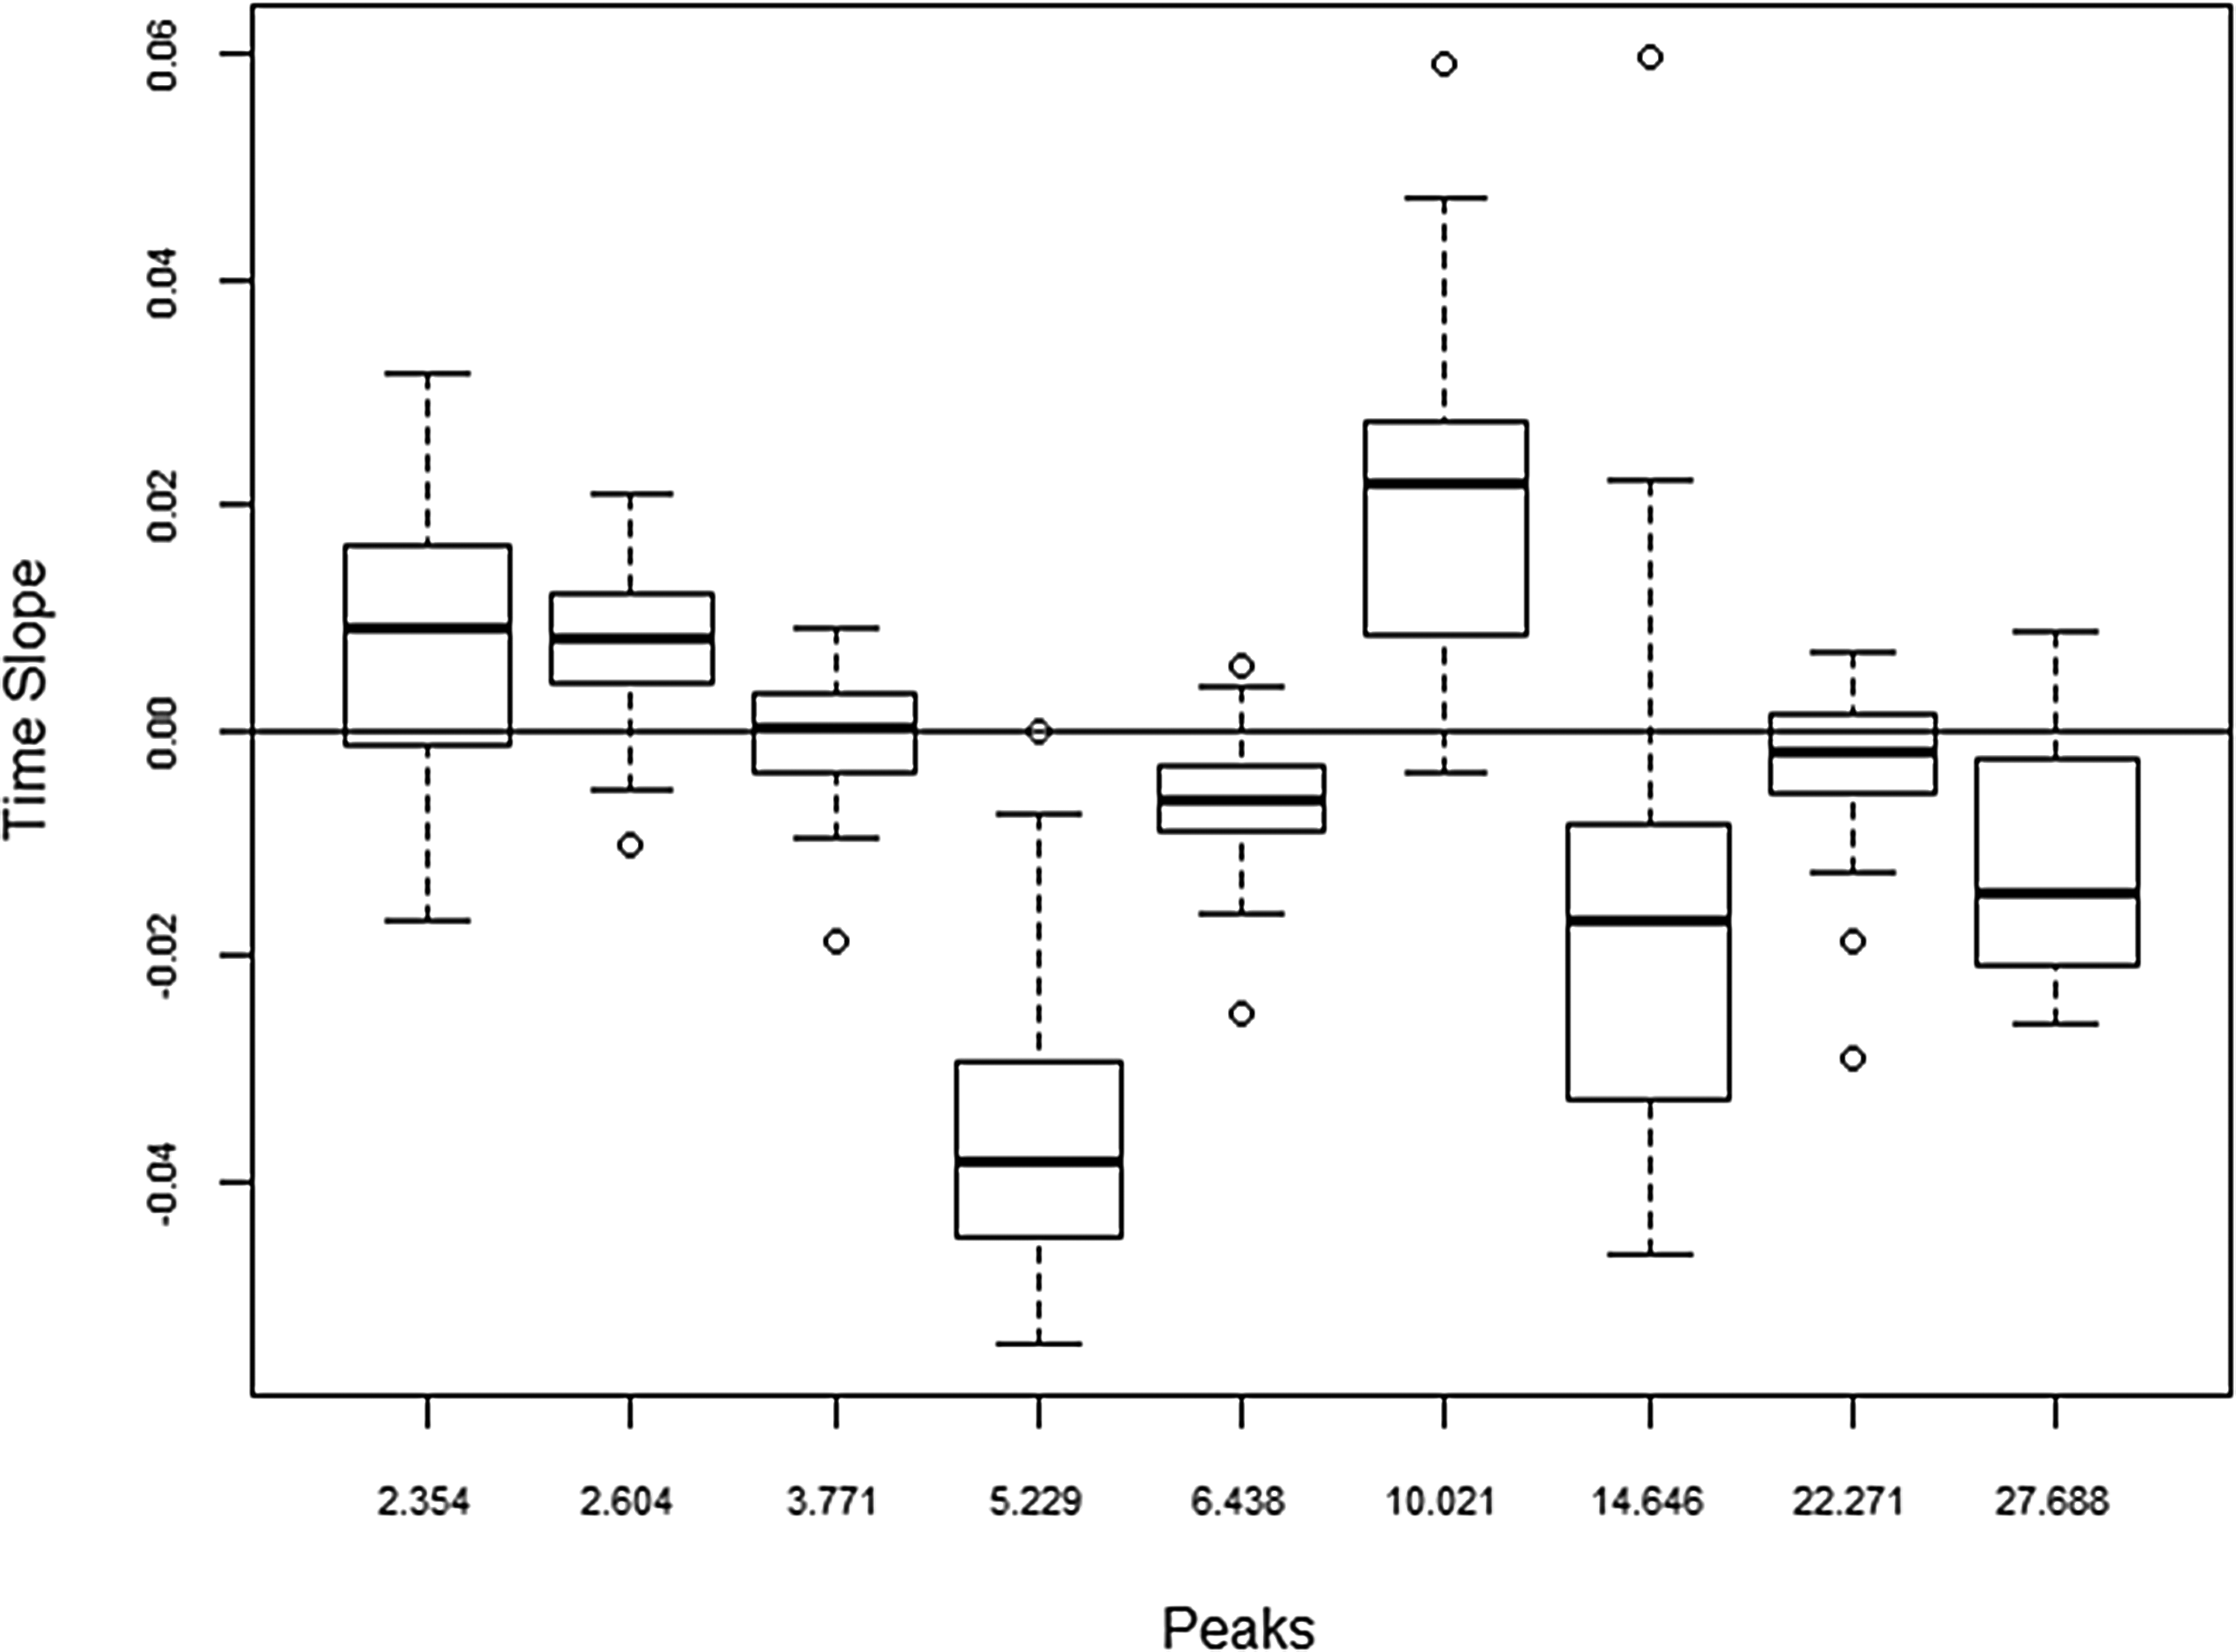
Distribution of time trends (slope of intensity versus post-reperfusion time) for selected metabolite peaks.
Differences of metabolites by graft type
The trend in intensity over post-reperfusion for the metabolite peak occurring around 3.8 min (uric acid) significantly differed between the graft types (p=0.001) (Fig. 3). However, the differences appear to be quite modest but are very consistent across patients, with DCD graphs declining slightly over time.
Mean post-reperfusion samples
The mean of all the metabolites post-reperfusion showed no significant overall differences with relevance to the different graft types. However certain differences between grafts were noted, when analyzed against the CIT elapsed prior to reperfusion. The metabolite occurring at 10.1 min increased by nearly 20% with an increase in each 100 min of CIT across all the graft types (p=0.001). The metabolite peak at 2.6 min (methionine) either reduced or increased by nearly 20% in DCD and DBD grafts, respectively, with an increase in each 100 min CIT (p=0.001).
Summary of metabolite differences between the graft types
Table 3 summarizes the key metabolic differences between DCD and DBD grafts. Three patterns of metabolite expression could be seen—overexpression, or concordant/discordant increase or decrease in metabolites in relation to the cold ischemia time. Of the metabolites overexpressed, xanthine, uric acid, and kynurenine are overexpressed nearly three-fold in DCD grafts towards the end of cold ischemia; however the only putatively identifiable metabolites overexpressed in DBD grafts were 3-nitrotyrosine (3-NT) and 4-hydroxy-3-methoxymandelic acid (HMMA). Differential expression of methionine was noted in the first reperfusion sample between the graft types. Both xanthine and 3-NT gradually declined in both graft types; meanwhile kynurenine showed a slow rise following reperfusion.
CIT, cold ischemia time; HMMA, 4-hydroxy-3-methoxymandelic acid; 3-NT, 3-nitrotyrosine.
Metabolic markers of PNF and IPF
PNF was defined as graft failure requiring re-transplantation or leading to patient death within 7 days of transplantation, and IPF was defined as significant graft dysfunction characterized by coagulopathy, and increased dependency for organ support in the presence of high serum transaminase levels. Four (4/40) patients (DCD, n=2 and DBD, n=2) were diagnosed with PNF/IPF in this study cohort and their clinical features are summarized in Table 4. Limited number of cases in this study precluded correlation between the metabolites identified though this analysis with routine biochemistry data; however all failed grafts had higher peak aspartate aminotransferase (AST) levels as summarized in Table 4. The CEAD analysis of the bench samples of these grafts revealed overexpression of metabolite peaks occurring at 3.02 (reduced glutathione) and 10.1 (kynurenine) minutes in these failed grafts. These were overexpressed by three and four times by failed grafts, respectively. In the post-reperfusion phase, xanthine (retention time 5.4 min) was overexpressed up to two-fold compared to functioning grafts (p=0.002).
ALD, alcoholic liver disease; DBD, donation after brain death; DCD, donation after circulatory death; HBV, hepatitis B disease; HCC, hepatocellular carcinoma; PSC, primary sclerosing cholangitis.
Discussion
The recent technological advances made on separation and identification of small molecules, coupled with development of data analysis software, paved the way for metabolomics studies (Wishart, 2005). These are increasingly applied in both experimental and clinical medicine, including identification of molecular targets in cancer treatment, biomarker discovery in the diagnosis of disease, and therapeutic drug monitoring (Naz et al., 2014; Stempler et al., 2014). Application of metabolomics to solid organ transplantation is still in infancy (Clarke et al., 2003; Coca et al., 2008; Cortes et al., 2010; Gok et al., 2003), however one recent study published the use of liquid chromatography mass spectrometry in the profiling of human liver grafts predicting early allograft dysfunction (Cortes et al., 2014).
The Coularray or CEAD is a high performance liquid chromatography (HPLC)/electrochemical detection system used for the analysis of redox-active metabolites, and thus highly relevant in situations where oxidative stress may occur, including organ transplantation (Yao and Cheng, 2004). CEAD offers two major advantages as an analytical approach for metabolomics studies. Its very high sensitivity is far greater than that of nuclear magnetic resonance (NMR) studies, and superior to mass spectrometric (MS) studies. This allows detection of metabolites present at a very low concentration, yet which may still be clinically significant. The other advantage is selectivity for redox-active metabolites, which is valuable in situations where oxidative stress may be a contributory factor (Bogdanov et al., 2008; Kaddurah-Daouk and Krishnan, 2009; Rozen et al., 2005). By avoiding the detection, and subsequent interference, of nonrelevant metabolites that may be present at far higher concentrations, a more selective group of clinically-relevant metabolites may emerge. Although this may also be considered to be a disadvantage, there is no single analytical technique capable of achieving this, at all levels of sensitivity, and metabolomics studies often encompass more than one analytical approach (Koal and Deigner, 2010).
Previously we documented the applicability of metabolomics studies in LT (Hrydziuszko et al., 2010). Moving further, this study cover the entire process through cold storage to post-reperfusion in a large study cohort. From a pathophysiological perspective, the primary difference between the DCD and DBD grafts is the donor warm ischemia time (dWIT) incurred by DCD donors (Ikeda et al., 1992). The effects of dWIT on the performance of a graft are such that DCD grafts are categorized as marginal grafts (Strasberg et al., 1994). Although it is well known that functional differences are due to energy exhaustion prior to the organ preservation, in depth knowledge of metabolic changes that occur in DCD grafts may open avenues of maximizing the utility of these organs (Minor et al., 1998), and the data herein attempts to bridge this information. With comparable characteristics between the two types of grafts in this study, it is reasonable to assume that the metabolic changes discovered in DCD and not DBD grafts are attributable to the dWIT.
Several key metabolites that differ between grafts were identified in this study. Xanthine, uric acid, and kynurenine are overexpressed by DCD grafts in the cold phase. Although the former two metabolites have been extensively studied in the ischemia-reperfusion model, the finding of kynurenine is unique. Perhaps kynurenine may be linked with higher incidence of PNF reported in DCD grafts as all failed allografts had four times overexpression of this metabolite. As all organs have been preserved with identical techniques and cold stored for a comparable duration, it is important to determine if the above changes are indeed the result of warm ischemic damage. Other significant metabolites in relevance to the field of IRI are those that increased with progressive increase in CIT. It could be speculated that by increasing the CIT by nearly 5 hours, the expression of homovanillic acid concentration may double, given the 30% rise for each 100 minute increment of cold storage time. However these changes may not entirely be graft related.
Kynurenine is an intermediate metabolite of the essential amino acid tryptophan, and generated by two enzyme systems; this rate limiting step of tryptophan metabolism is catalyzed by indoleamine 2–3 deoxygenase (IDO) and tryptophan 2–3 deoxygenase (TDO) (Knox and Mehler,1950; Mehler and Knox, 1950). IDO is present in almost all cellular systems; however TDO is liver specific (Knox, 1951); therefore increased expression of kynurenine in DCD grafts is more likely from increased TDO activity. All other enzymes downstream in the metabolic pathway are present in abundance, and TDO is the only inducible and rate limiting enzyme (Taylor and Feng, 1991). TDO is inducible by an increased amount of substrate itself, and also by hydrocortisone and glucocorticoids (Altman and Greengard, 1966). All grafts in this study were procured from identical situations with preservation solution devoid of tryptophan supplementation; DCD donors did not receive high doses of steroids such as are usually given to the DBD donors. The slow rise in kynurenine in both types is probably explained by routine prescription of hydrocortisone in the immunosuppression medication (Young, 1981), but none of these explain the overexpression of this metabolite in the cold-stored DCD grafts. It is uncertain therefore if the TDO was induced by hypoxia, and evidence is lacking. A catecholamine surge in the donor and induction of TDO during the agonal phase of organ donation following the treatment withdrawal is a possibility. The immune- and cytoprotective effects of both IDO and TDO by degradation of tryptophan have been documented and further studies focusing on this metabolite may be helpful (Mellor and Munn, 2004; Terness et al., 2002).
Xanthine and uric acid are formed by the enzyme xanthine oxidase acting on hypoxanthine. A major pathway of purine nucleoside catabolism, both these have been previously identified as biomarkers of ischemic injury and the ability to replicate these results in CEAD-based metabolomics in this study is a positive finding (Vajdova et al., 2000). During oxidative stress, the enzymatic action of xanthine oxidase is increased with formation of reactive oxygen species (ROS) and uric acid. It is likely that the actual tissue damage is caused by ROS itself rather than uric acid and the latter is the metabolic by-product of an overactivated pathway. Several studies suggest uric acid as a marker of ischemic damage of the liver grafts (Clavien et al.,1992), including occasional case studies reporting its increase in the presence of poor organ function following LT (Serkova et al., 2007). It is likely that tissue hypo-perfusion and hypoxemia during the treatment withdrawal phase in DCD donors triggered that the metabolic flux be channeled down the oxidase route rather than the dehydrogenase route (Brass et al., 1991). In this regard, further investigation of enzyme xanthine oxidase during organ preservation, with emphasis on modulation of its enzyme activity in DCD donors, could open avenues for further studies (Amador et al., 2007; Ishii et al., 1990; Sola et al., 2000).
A limitation of the present study is the failure to recognize three metabolite peaks occurring at the retention times of 2.35, 12.0, and 22.7 minutes. These peaks followed similar trends in both types of liver grafts; therefore the clinical significance of these may be less relevant, in the context of different graft types. The lack of information it provides regarding unknown peak identification is a disadvantage of CEAD. Unlike NMR, which may indicate functional groups present, and MS that may provide a mass number, the identification of CEAD peaks is reliant on comparison of its chromatographic and electrochemical properties to known electroactive compounds from reference databases. Peaks of interest not identified by this process may be investigated further by fraction collection or replicating chromatographic conditions with MS detection, for example. The future of metabolomics studies in LT should probably focus on different approaches with recognition of biomarkers in different biofluids and hepatic tissue. A shot-gun approach to identify metabolites recognized in this study may be useful in further investigations. As certain limitations apply to different analytical techniques, a combination of CEAD, NMR, or FTICR mass spectrometry could be complementary to each other (Wishart, 2008).
Conclusions
This study investigates the use of CEAD as an analytical platform to investigate metabolomics changes that occur through cold storage to post-reperfusion in deceased donor LT. These results provide data for the largest human study group examined to date, on the metabolic differences between key cadaveric organ donor sources. Whilst the majority of metabolomics studies reported in the literature involve experimental models, the data presented herein are accumulated through real time transplantation setting. Moreover, the metabolite differences that exist between the DCD and DBD liver grafts are the key findings of this study, and in this regard, the finding of kynurenine as a potential marker of aggravated ischemic injury overexpressed by DCD grafts is novel, and its possible linkage to PNF is a unique finding. These findings have the potential to stimulate the scientific community to further explore these differences, with the eventual objective of graft modulation for improved outcomes.
Footnotes
Acknowledgments
Author contributions: MTPRP, MAS, DAR, NM, and DFM: study design, MTPRP performed study and collected data; MTPRP, DAR, RH and EK: sample and data analysis; MTPRP, RH, DAR, MAS, NM, EK, and DFM: interpretation of data and intellectual content; MTPRP, RH, and DAR wrote the manuscript. All authors contributed and approved the final draft manuscript.
Grant support: This study was funded by a limited study grant not exceeding 70,000.00 Pounds Sterling by Astellas Pharmaceuticals to investigate biomarkers of poor graft function in human orthotopic liver transplantation, granted to MTPRP, MS, and DFM. Astellas Pharmaceuticals were not involved in any stage of this study from design, data analysis or manuscript preparation.
Author Disclosure Statement
All authors of this article declare that there are no conflicting financial interests.