




Abstract
Abstract
Oral cancer is the sixth most common cancer worldwide with a high mortality rate. Biomarkers that anticipate susceptibility, prognosis, or response to treatments are much needed. Oral cancer is a polygenic disease involving complex interactions among genetic and environmental factors, which require multifaceted analyses. Here, we examined in a dataset of 103 oral cancer cases and 98 controls from Taiwan the association between oral cancer risk and the DNA repair genes X-ray repair cross-complementing group (XRCCs) 1–4, and the environmental factors of smoking, alcohol drinking, and betel quid (BQ) chewing. We employed logistic regression, multifactor dimensionality reduction (MDR), and hierarchical interaction graphs for analyzing gene–gene (G×G) and gene–environment (G×E) interactions. We identified a significantly elevated risk of the XRCC2 rs2040639 heterozygous variant among smokers [adjusted odds ratio (OR) 3.7, 95% confidence interval (CI)=1.1–12.1] and alcohol drinkers [adjusted OR=5.7, 95% CI=1.4–23.2]. The best two-factor based G×G interaction of oral cancer included the XRCC1 rs1799782 and XRCC2 rs2040639 [OR=3.13, 95% CI=1.66–6.13]. For the G×E interaction, the estimated OR of oral cancer for two (drinking–BQ chewing), three (XRCC1–XRCC2–BQ chewing), four (XRCC1–XRCC2–age–BQ chewing), and five factors (XRCC1–XRCC2–age–drinking–BQ chewing) were 32.9 [95% CI=14.1–76.9], 31.0 [95% CI=14.0–64.7], 49.8 [95% CI=21.0–117.7] and 82.9 [95% CI=31.0–221.5], respectively. Taken together, the genotypes of XRCC1 rs1799782 and XRCC2 rs2040639 DNA repair genes appear to be significantly associated with oral cancer. These were enhanced by exposure to certain environmental factors. The observations presented here warrant further research in larger study samples to examine their relevance for routine clinical care in oncology.
Introduction
O
Recently, growing evidence indicated that single nucleotide polymorphisms (SNPs) of DNA repair genes were associated with oral cancer susceptibility (Gal et al., 2005; Yang et al., 2012; Yen et al., 2008). For example, SNPs of DNA repair genes such as X-ray repair cross-complementing group 1 (XRCC1) (Wu et al., 2014; Zhang et al., 2013), XRCC2 (Romanowicz-Makowska et al., 2012), XRCC3 (Tsai et al., 2014), and XRCC4 (Chiu et al., 2008; Tseng et al., 2008) were reported to be associated with oral cancer. However, most of these studies focused on the single SNP effect or single SNP–environment effect. The complex gene–gene (G×G) and gene–environment (G×E) interactions associated with oral cancer are less addressed.
G×G and G×E interactions were well-established to detect the epistasis which involved a complex association between disease/cancer related genes in case-control and family-based association studies (Chang et al., 2008; Chen et al., 2013, 2014; Chuang et al., 2012; Lin et al., 2009; Moore et al., 2010; Steen, 2012; Yang et al., 2011). This epistasis assists us to understand the causes of disease and cancer. Multifactor dimensionality reduction (MDR) represents an epistasis detection approach (Hahn et al., 2003; Ritchie et al., 2001) and several improved MDRs were suggested to detect particular data sets such as imbalanced data sets (Yang et al., 2013). MDR-ER (Yang et al., 2013) allowed that G×G interaction detection works on imbalanced data sets without the need of balanced demographic approaches. It can provide strong analytical abilities for imbalanced data sets for the detection of possible multiple factors interactions.
In this study, we examined the G×G and G×E effect by an improved MDR (MDR-ER) by tandem consideration of genetic factors (four SNPs of XRCCs 1–4) and environmental factors (gender, age, smoking, alcohol drinking, and BQ chewing) in a dataset of 103 oral cancer cases and 98 controls from Taiwan. Risk-ranking of oral cancer was identified in terms of the G×G and G×E interactions.
Methods
Multifactor dimensionality reduction (MDR)
The nonparametric and model-free MDR method is widely used in the investigation of G×G and G×E interactions (Ritchie et al., 2001). Nonlinear interactions among multiple factors such as genetic and environmental factors can effectively discriminate nonsignificant effects for each individual factor (Ritchie et al., 2003). MDR is a data reduction method that searches for multifactor combinations associated with either high or low risks of oral cancer. Therefore, several genetic and environmental factors are classified as being of high and low risk. A high-order G×G interaction for the ability to classify and predict outcome risk status can be evaluated by cross-validation (CV) and permutation testing of the data space is reduced to a two-way contingency table.
Supposedly the N SNPs are considered as a case-control data set, and the M is the maximum order of G×G and G×E interactions (i.e., M≤N). Let m be the number of order G×G and G×E interactions (m≤M). The procedure to use MDRs for detecting the best m-way of G×G and G×E interaction models is illustrated in Figure 1. The MDR procedure can be divided into the following eight steps:
MDR flowchart. Step 1. Divide data set into a k sub data set and select a ith sub data set as the test data set and the other remaining sub data set as the training data set. Step 2. A set of m factors (loci) is consisted from all factors. Step 3. All possible combinations of genotypes in m factors are represented in m-dimensional space (multifactor cells). Equation 1 is defined as a multifactor cell that includes a set of m genetic and environmental factors.
Step 4. High or low risk is defined in each multifactor cell. Equation 2 is used to compute the ratio between case and control and the symbol u() is used to determine a score of “1” if all elements l in L match a sample in P or N, otherwise given a score “0”. Each multifactor cell is labelled as ‘H’ or ‘L’ symbol. The ‘H’ indicates the high-risk group if the ratio in multifactor cell meets or exceeds a threshold, while ‘L’ indicates a low-risk group.
where
where P the cases data set; N the control data set; P* the number of case groups in the training set; N* the number of control groups in the training set; L a vector of variable combinations. Step 5. Repeat steps 2–5 until all possible sets of m factors are evaluated. Step 6. Evaluate error rates of all possible sets of m factors and the model with the minimum training error rate (classification error rate) is chosen as a best model in each CV. The possible combinations in n-factors are reduced into a 2-way contingency table by step 4. Thus, Equation 3 can be used to evaluate model error rate.
where C the evaluated model; TP true positive, the total number of labeled ‘H’ in the case data; FP false positive, the total number of labeled ‘H’ in the control data; FN false negative, the total number of labeled ‘L’ in the case data; TN true negative, the total number of labeled ‘L’ in the control data. Step 7. After classification error rate evaluate the all possible G×G interaction models, the model with minimum error rate is regarded as the best model of training data at ith-fold CV. This best model is then evaluated by the testing data and evaluation approach is the same as steps 3–6 but only evaluates the best model of training data. Step 8. Repeat steps 1–8 of next k-fold CV until maximum k is met. If all k-fold CVs are evaluated, then all CVs are collected as a cross-validation consistency (CVC) and the highest frequency with CVC is selected as the best G×G interaction model. If the two or more models have equal CVC frequency, then the model found first is the best G×G or G×E interaction model. The classification error rate of the finally selected best model is calculated by averaged classification error rates of CVs.
MDR-ER
MDR-ER was introduced to apply in imbalanced case-control data sets (Yang et al., 2013) and had proven to identify significant G×G and G×E interactions effectively. MDR-ER was only to improve both the classification and error rate evaluation functions by using the proportion of cases and the proportion of controls. All procedures of MDR-ER were the same with MDR, as above description. Equation 4 is the improved classification function using proportion of cases and the proportion of controls. The symbol u() is used to determine a score of “1” if all elements l in L match a sample in P or N; otherwise are given a score “0”.
where
where
P the case data set;
N the control data set;
P* the number of case group in the training set;
N* the number of control group in the training set;
L a vector of variable combinations.
Equation 5 is the improved error rate evaluation function that is based on the arithmetic mean of the sensitivity and specificity.
where
TP the total number of high risk group in the case data;
FP the total number of high risk group in the control data;
FN the total number of low risk group in the case data;
TN the total number of low risk group in the control data.
Statistical analysis
The odds ratio (OR), 95% confidence interval (CI), and p value of each SNP were performed by the logistic regression for individuals with other alleles compared to those homozygous major alleles for a SNP. OR indicated the risk of disease and p value indicated the significance for the difference between groups. Both logistic regression and MDR-ER were used to evaluate the G×G and G×E interactions. As the logistic regression we used the multinomial logistic regression model without interaction among factors. Statistics were analyzed by SPSS version 19.0 for Windows (SPSS Inc., Chicago, IL) and the power analyses were performed by Power and Sample Size Calculations tool (Dupont and Plummer, 1998).
Dataset
The oral cancer case-control data set containing genotypes of XRCCs 1–4 genes and habits (smoking, alcohol drinking, and BQ chewing) was derived from our previous study (Yen et al., 2008) which was approved by the Institutional Review Board of Chi-Mei Medical Center in Tainan, Taiwan. This anonymous and delinked data set is available at http://bioinfo.kmu.edu.tw/ORCA-XRCCs-ABC.xls. All patients were pathologically confirmed to be primary OSCC. Importantly, the G×G or G×E interactions in MDR-ER analysis were not investigated hitherto.
Results
Information on the oral cancer patients and controls
Table 1 listed the information about the genotypes and prevalence of conventional oral cancer risk factors (smoking, alcohol drinking, and BQ chewing) in oral cancer patients vs. controls. The listed genotype frequency showed no significant difference between cases and controls. The percentages of risk factors were higher in cases than in control. In terms of age grouping (Supplementary Table S1), the studied population contained more patients at age <50 than at age ≥50. The percentage of male was higher among gender and the percentage of age ≥50 was higher among cases. The prevalence of smoking, alcohol drinking, and BQ chewing were higher among cases in both age groups.
The controls of data sets (Yen et al., 2008) were collected from the people routine physical checkups, non-neoplastic minor operations, or maxillofacial trauma.
The cases of data sets (Yen et al., 2008) were collected from the three pathologically confirmed primary OSCC patients.
Logistic regression analyses for independent environmental effects to each SNP
We previously found that the individual SNP effects of the XRCC1 rs1799782, XRCC3 rs861539, and XRCC4 rs2075685 were nonsignificantly associated with oral cancer risk in terms of its adjusted overall ORs for consideration of all listed factors such as age, gender, alcohol drinking, smoking, and BQ chewing (left of Table 2) (Yen et al., 2008). However, the impacts of these risk factors to oral cancer were not individually investigated.
Bold fonts indicate significant relationships.
rs1799782, Arg194Trp, allele=C/T, MAF=0.130, Chromosome (Chr.) 19; *2rs2040639, 5′ locus, allele=A/G, MAF=0.371, Chr. 7; *3rs861539, Thr241Met, allele=C/T, MAF=0.251, Chr. 14; *4rs2075685, T1394G intron 1, allele=G/T, MAF=0.385, Chr. 5; *5Overall adjustment for age, gender, alcohol drinking, smoking, and BQ chewing. It was reported in our previous work (Yen et al., 2008); *6Only adjustment for age, gender, alcohol drinking, and BQ chewing; *7Only adjustment for age, gender, smoking, and BQ chewing; *8Only adjustment for age, gender, alcohol drinking, and smoking; *9OR, odds ratio; CI, confidence interval.
In the current study, we used the logistic regression to independently adjust these risk factors to oral cancer for analyzing its independent effect of risk factor on each genotype of these SNPs of DNA repair genes (Table 2). Coupling with XRCC2 rs2040639, the single risk factor effects for smoking and alcohol drinking were individually and significantly associated with oral cancer (i.e., XRCC2 rs2040639 heterozygote; adjusted overall OR=2.9, 95% CI=1.0–8.8; adjusted OR in smoking=3.7, 95% CI=1.1–12.1; adjusted OR in alcohol drinking=5.7, 95% CI=1.4–23.2). The coupling effect of XRCC2 rs2040639 with BQ chewing showed no significant association to oral cancer [adjusted OR=3.4, 95% CI=0.9–12.6]. The case number between no smoking and smoking is imbalanced and it may have limited generalization. However, Table 2 shows the stratification analysis to control the confounder factors amongst the smoking, drinking, and BQ chewing. The results suggested that smoking and drinking have significant effect in oral cancer and these factors also reported to associate with oral cancer (Ko et al., 1995).
Analyses of gene–gene interaction
All significant results of the two-factor G×G interaction models generated by MDR-ER are shown in Table 3. Among them, the best model (XRCC1 rs1799782+XRCC2 rs2040639) was selected by its minimum classification error rate (0.365). Using this strategy, the best one-factor model and 2–5 factors G×G interaction models of MDR-ER analysis are shown in Table 4. For example, XRCC2 rs2040639 was the best single-factor associated with oral cancer (error rate=0.413, CVC=4/5). It indicates that the classification error rate≤0.413 is observed by chance in randomized data based on the null hypothesis of no association. The combination of XRCC1 rs1799782 and XRCC2 rs2040639 was the best two-factor model, with an error rate of 0.365 and a CVC of 5/5. The three-factor model added XRCC4 rs2075685 to XRCC1 rs1799782 and XRCC2 rs2040639 for the error rate (0.339). XRCC1 rs1799782, XRCC2 rs2040639, XRCC3 rs861539, and XRCC4 rs2075685 was the four-factor model of the most accurate for oral cancer prediction (error rate=0.330, CVC=5/5). Likewise, the full outcome of the MDR-ER genotype combination of these four factors are presented to show the high and low risks for oral cancer (Figure 2).
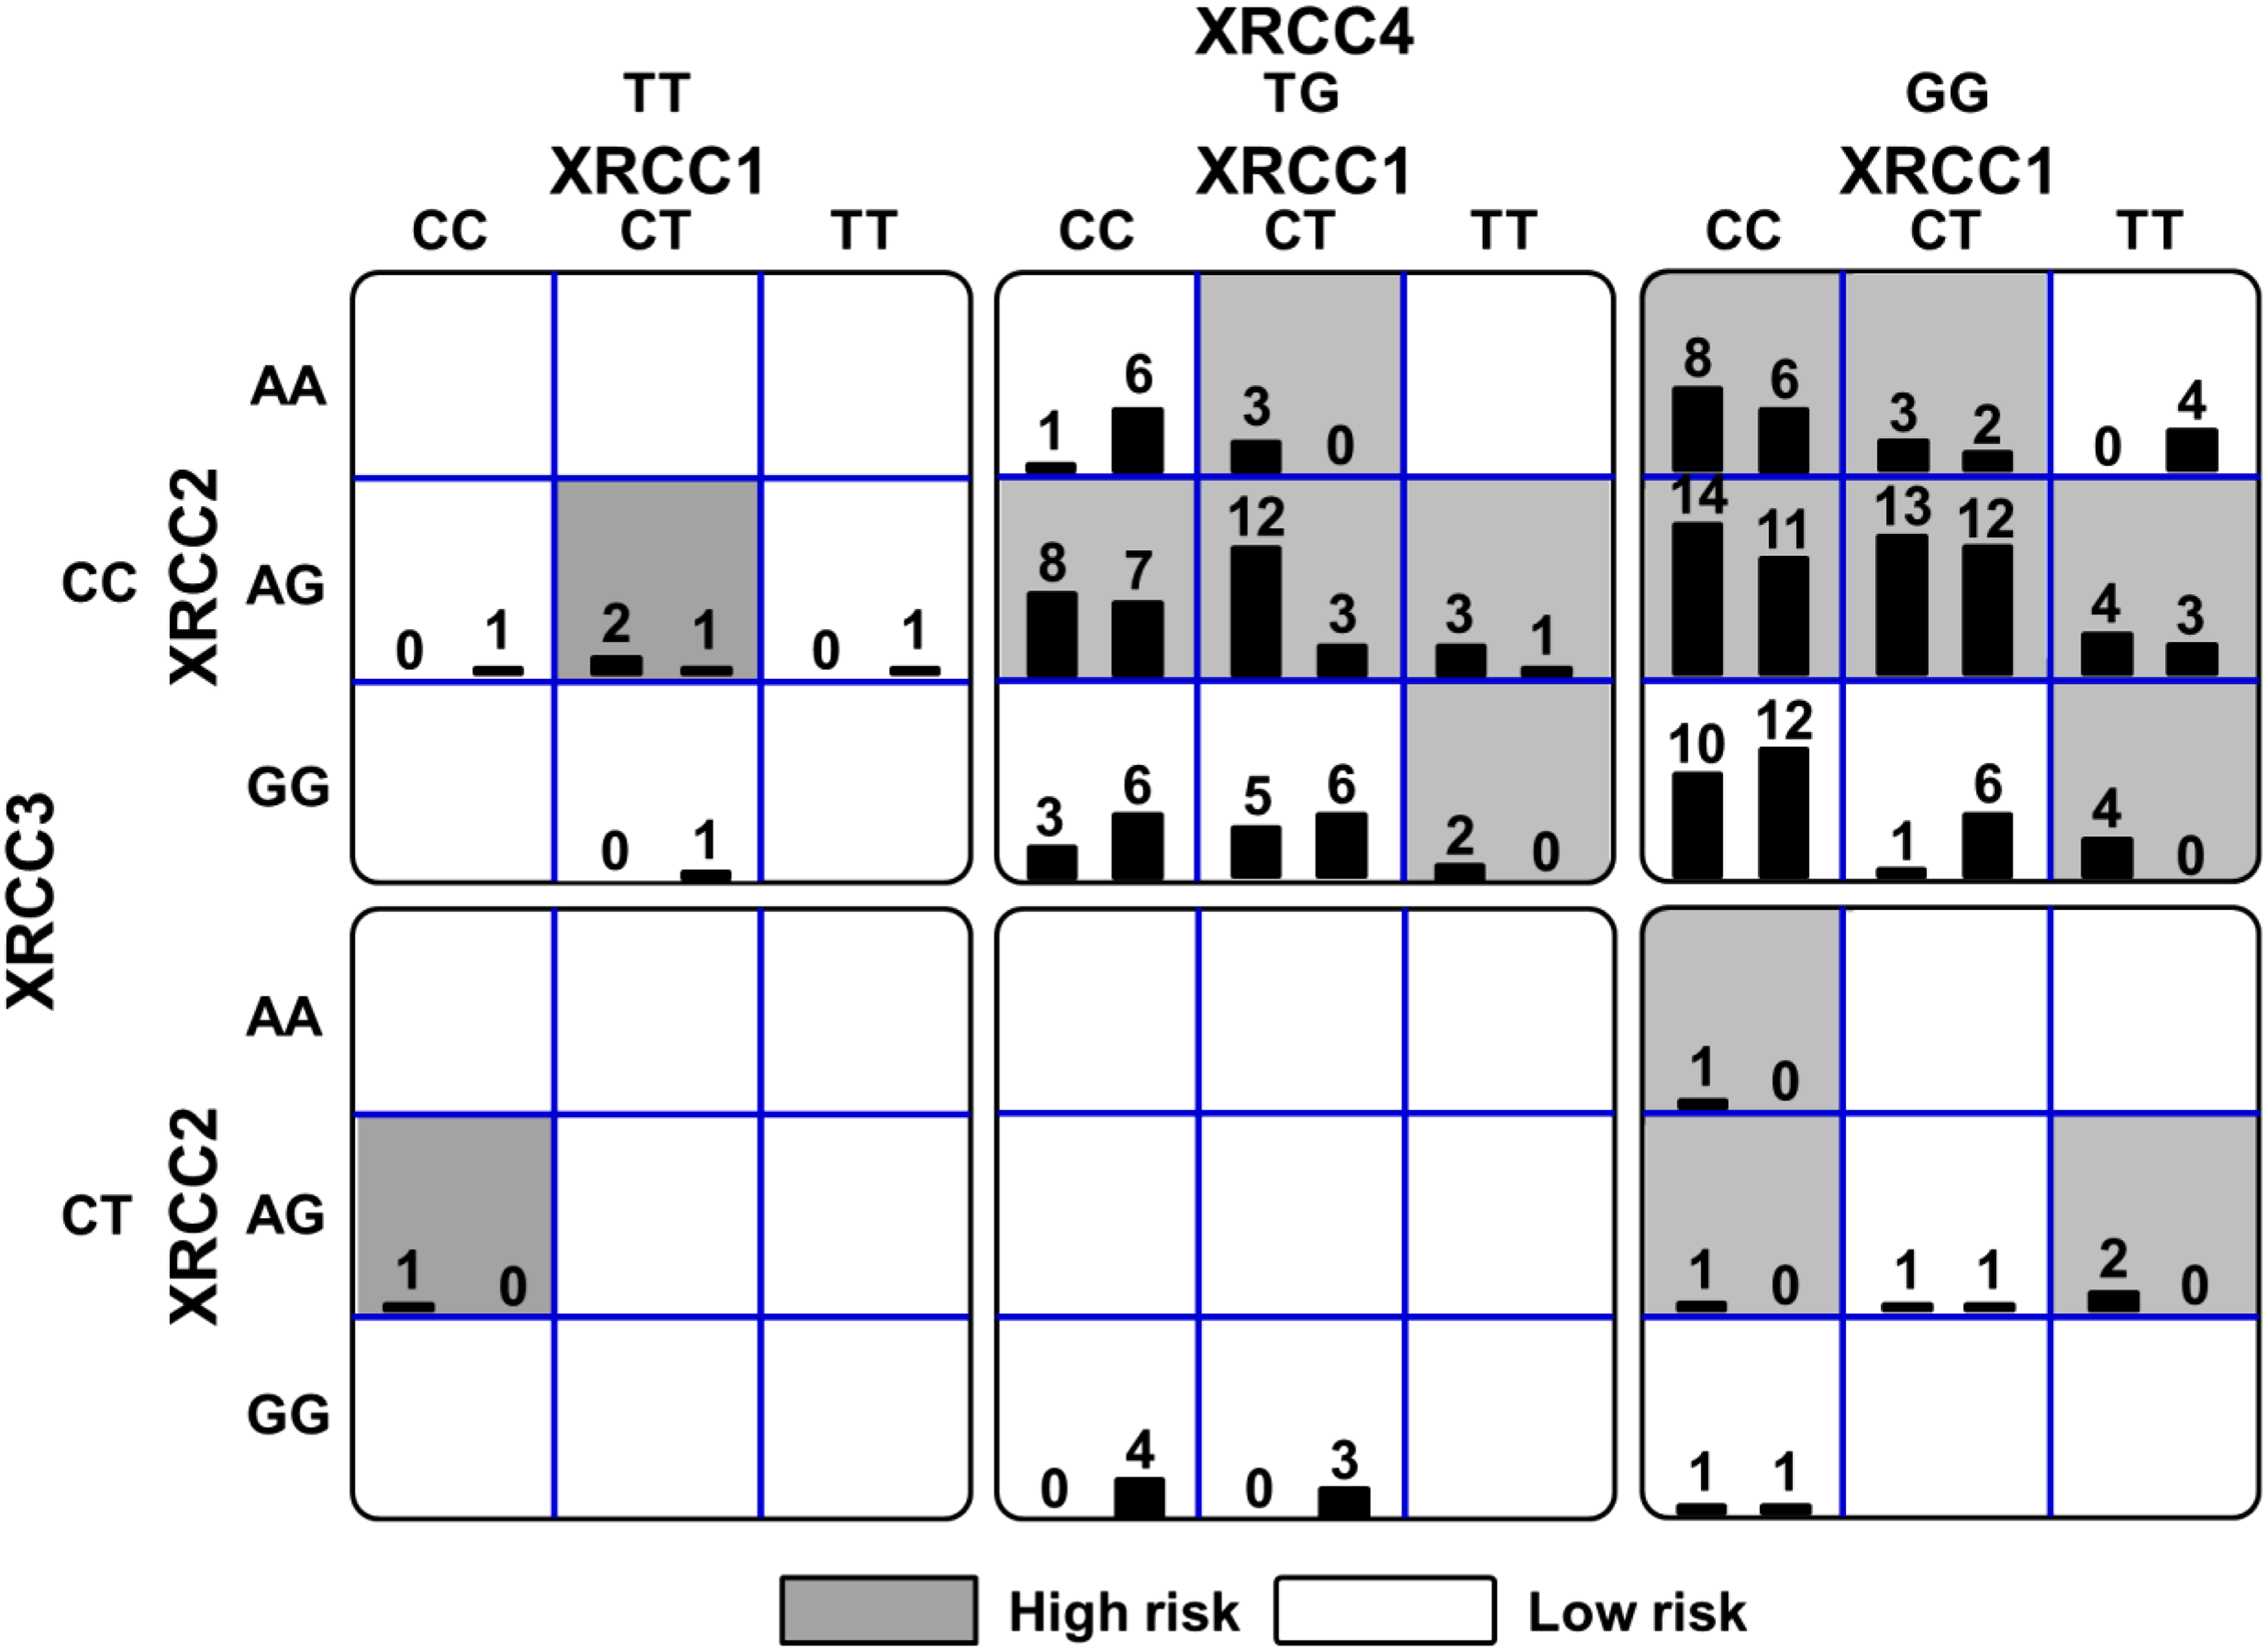
Summary of XRCC1, XRCC2, XRCC3, and XRCC4 genotype combinations associated with high and low risks for oral cancer from MDR-ER with the lowest prediction error. For each genotype combination (cell), the left bar of the histogram shows the case number, while the right bar shows the control number. The high risk cells are represented as being darker. As an evidence for epistasis, each genotype is associated with the other, and the risk is calculated according to this epistasis.
All two-factors G×G interactions were identified by the unbalanced function based on MDR method with significant testing accuracy but not best CVC. OR, odds ratio.
CVC, cross-validation consistency; *2Bootstrap 95% CI was the adjusted 95% CI by bootstrapping 1000 samples.
Table 4 also shows that OR values in the 1–5 factor models were increased from 2.009 to 4.543 and the bootstrapping in 1000 samples adjusted to 95% CI of OR (95% bootstrap CI) values were adjusted from 1.07 to 8.98. P values of 1–4 factors models decrease from 0.028 to 7.11E-06. These OR values indicated that the oral cancer risk is significantly raised by the joint effect of multiple genotypes. The power analysis in 1–4 factors, ranging from 0.689 to 0.999, showed that occurrence probability in 2–4 factors models were higher than 0.9. These three power values of models indicated that we can reject the null hypothesis that this OR value equals 1 with probability over 0.9.
Analyses of gene–environment interaction
Oral carcinogenesis may be the outcome for the interaction of multiple genes that fails to respond the damage induced by several environmental factors, such as gender, age, smoking, BQ chewing, and alcohol drinking. Therefore, the effects of G×E interaction in oral cancer risk was evaluated in terms of four SNPs in DNA repair genes like XRCCs 1–4 and five environmental factors using MDR-ER analysis in this study.
Supplementary Figures S1 to S4, respectively, illustrated the best models of 2–5 factors (Table 5) in the association with high and low risks of oral cancer. Table 5 shows that BQ chewing [i.e., BQ (Y)], was the best single-factor for oral cancer association with a high accuracy (error rate=0.18) and a good CVC (5/5). The best two-factor model was the combination of alcohol drinking and BQ chewing, with a testing error rate of 0.18 and a CVC of 4/5. The three-factor model contained two genetic factors XRCC1 rs1799782 and XRCC2 rs2040639 to an environmental factor BQ chewing (error rate=0.18; CVC=4/5). These two models had the highly accurate and high CVC. Four-factor models included XRCC1 rs1799782, XRCC2 rs2040639, age, and BQ chewing. XRCC1 rs1799782, XRCC2 rs2040639, and BQ chewing were the most common three factors across all factors listed in the best models, however, the addition of age slightly decreased the testing accuracy of the best model of four factors (error rate=0.20; CVC=3/5). All of the five-factor models included XRCC1 rs1799782, XRCC2 rs2040639, age, alcohol drinking, and BQ chewing. Compared to the best model of four factors, the addition of alcohol drinking slightly decreased the testing accuracy of the best model of five factors (error rate=0.21; CVC=3/5).
Detailed information of its MDR-ER chart are supplemented in Figures S1–S4 in respective to the best models of two–five factors; *2CVC, cross-validation consistency; *3 Testing err., average of testing error rate; *4N, No; *5Y, Yes.
Discussion
In this study, we demonstrated a systematic analysis for complex interactions between genetic and risk factors in oral cancer. We used a multifaceted analytical method that combines regular statistical methods with MDR-ER to identify an associated relationship between DNA repair polymorphisms and oral cancer risk. Accordingly, the potential effects of DNA repair genes may be explored by G×G or G×E interactions (i.e., the association between genotypes of SNPs of XRCCs 1-4 genes and between genotype combinations with smoking, BQ chewing, alcohol drinking status in this study).
The traditional statistical analyses were reported to analyze the modeling of multifactor interactions inadequately (Moore and Williams, 2002). For example, Andrew et al. (2006) used logistic regression to evaluate the three-way interactions, but the model was unable to converge results from the small number of individuals in some cells. Alternatively, the risk effects associated with multifactors were analyzed by a MDR approach (Collins et al., 2013; Greene et al., 2010; Lee et al., 2014; Oh et al., 2013), which enhances the statistical power to explore the possible G×G and G×E interactions (Moore, 2004). However, MDR was inadequate for analyzing the imbalanced data set due to all cells towards either higher or lower groups. Therefore, we utilized the MDR-ER to assess and interpret possible G×G and G×E interactions; this approach improved the MDR disadvantage on the imbalanced data set (Yang et al., 2013).
We identified the two-factor combinations in terms of G×G and G×E interactions. MDR-ER analysis selected XRCC1 rs1799782 and XRCC2 rs2040639 as the best two biomarkers of oral cancer risk in G×G interaction (Table 3), while alcohol drinking and BQ chewing were the best two biomarkers of oral cancer risk in gene–environment interaction (Table 5). Moreover, BQ chewing was the best model of single factors among all individual genetic and environmental factors. These results suggested that environmental factors alone may have a dominant effect on oral cancer susceptibility compared to that of genetic factors alone under the best 1–2 factor models.
Results of independent analyses of XRCC3 were associated with either XRCC1 or XRCC2 in oral cancer risk (Benhamou et al., 2004; Dos Reis et al., 2013). XRCC1 rs1799782 (Ramachandran et al., 2006; Yen et al., 2008) and XRCC2 rs2040639 (Yen et al., 2008) were reported to be individually associated with oral cancer. However, the combined effect of XRCC1 rs1799782 and XRCC2 rs2040639, as well as their interaction with environmental factors, had not been reported. Recently, G×E interactions between several genes with smoking and with BQ chewing have been reported (Chiu et al., 2008; Sugimura et al., 2006). Similar to our best models of 3–5 factors, the interaction effects between XRCC1 rs1799782 and XRCC2 rs2040639 might be dramatically increased by the environmental factors such as age, alcohol drinking, and BQ chewing but not for smoking [i.e., the OR values are increased from 31.0 to 82.9 (Table 5)].
Furthermore, the combined effect of SNPs with environmental factors (tobacco products and alcohol) were also reported in other genes (IL12RB2, Rad 52, XRCC2, P53, CCND3, and ABCA1) (Cederblad et al., 2013). The combined effects of XRCC1 rs1799782 and XRCC2 rs2040639 was dominantly associated with oral cancer compared to one environmental factor such as age under the best models of 3–5 factors. Additionally, higher oral cancer risk was found when environmental factors were present only in heterozygotic patients for XRCC2 rs2040649 5′UTR polymorphism but not in homozygotes for the major or minor allele (Table 2). This may be partly explained by the law of “incomplete dominance”, which meant that the dominant, recessive, and intermediate phenotypes may appear in this case.
The results show XRCC2 polymorphism and BQ chewing as the best single genetic and environmental factors associated to oral cancer. However, no gene–environment interaction was found between them, unless the combination of XRCC2+XRCC1 and not only the XRCC2 polymorphism was considered in the model. It can be explained that the 2–5 factors G×E interactions by MDR-ER included the G×G, G×E, and E×E interaction. For two factors, drinking (Y) or BQ (Y) is high risk and drinking (N) or BQ (N) is low risk, which belong to the E×E interaction. Other two factors such G×G and G×E as were not the best models were not shown.
MDR uses the machine learning technique to find the nonlinear model associated with disease, thus biologically meaningful results can be detected without a big population. For example, the associations between renin-angiotensin system-related gene polymorphisms and atrial fibrillation risk were reported for 97 cases and 97 controls (Asselbergs et al., 2006). The early onset coronary artery disease using 90 cases and 90 controls were analyzed by MDR (Agirbasli et al., 2011). Furthermore, the performance of MDR and penalized logistic regression (PLR) was compared for detecting G×G interaction that were associated with acute rejection in kidney transplant patients, based on randomly selected 120 Caucasian patients by different two-way and three-way interaction models (He et al., 2009). Moreover, they used the receiver operating characteristic analysis and suggested that MDR outperforms PLR in detecting G×G interaction on the small samples in the real dataset.
The computational time remains an important limitation in MDR as well as MDR-ER due to the astronomical number of higher order combinations. Consequently, with the huge time consumed, it is difficult to implement the multiple test in the identification of more complex interactions between genes.
In conclusion, our results indicated that the MDR-ER methodology was effective in identifying the G×G and G×E interactions in an oral cancer association study. We found that XRCC1 rs1799782 and XRCC2 rs2040639 of DNA repair genes was significantly associated with oral cancer susceptibility and this risk may be enhanced with exposure to certain environmental factors. Furthermore, our findings highlight the impacts of MDR-ER based G×G and G×E interaction for oral cancer susceptibility, providing a potential algorithm to apply to other complex disease predictions. Finally, we suggest that the observations presented here warrant further research in larger study samples to examine their relevance for routine clinical care in oncology.
Footnotes
Acknowledgments
This work was partly supported by funds of the MOST 103-2221-E-151-029-MY3, MOST 103-2320-B-037-008, the Kaohsiung Medical University “Aim for the Top Universities Grant, Grant No. KMU-TP103A33”, the 103CM-KMU-09, the KMU-TP103A33, the National Sun Yat-sen University-KMU Joint Research Project (#NSYSU-KMU 103-p014 and #NSYSU-KMU 101-p036), and the Health and welfare surcharge of tobacco products, the Ministry of Health and Welfare, Taiwan, Republic of China (MOHW104-TDU-B-212-124-003 and MOHW103-TDU-212-114007). We also thank Dr. Hans-Uwe Dahms for his help with English editing.
Author Disclosure Statement
The authors declare that there are no conflicting financial interests.
References
Supplementary Material
Please find the following supplemental material available below.
For Open Access articles published under a Creative Commons License, all supplemental material carries the same license as the article it is associated with.
For non-Open Access articles published, all supplemental material carries a non-exclusive license, and permission requests for re-use of supplemental material or any part of supplemental material shall be sent directly to the copyright owner as specified in the copyright notice associated with the article.
