
Abstract
Abstract
We present here an innovative hypothesis and report preliminary evidence that the sound of NMR signals could provide an alternative to the current representation of the individual metabolic fingerprint and supply equally significant information. The NMR spectra of the urine samples provided by four healthy donors were converted into audio signals that were analyzed in two audio experiments by listeners with both musical and non-musical training. The listeners were first asked to cluster the audio signals of two donors on the basis of perceived similarity and then to classify unknown samples after having listened to a set of reference signals. In the clustering experiment, the probability of obtaining the same results by pure chance was 7.04% and 0.05% for non-musicians and musicians, respectively. In the classification experiment, musicians scored 84% accuracy which compared favorably with the 100% accuracy attained by sophisticated pattern recognition methods. The results were further validated and confirmed by analyzing the NMR metabolic profiles belonging to two other different donors. These findings support our hypothesis that the uniqueness of the metabolic phenotype is preserved even when reproduced as audio signal and warrants further consideration and testing in larger study samples.
Introduction
T
The concept of individual metabolic phenotype has attracted a great interest, as it may pave the way towards personalized therapy and nutrition (McNiven et al., 2011; van der Greef et al., 2006; Zeisel, 2007) and enhanced pharmacometabonomics (Nicholson et al., 2011b). Furthermore, individual metabolic phenotyping can contribute to a better understanding of drug efficacy and toxicity (Kaddurah-Daouk et al., 2008; Wishart, 2008; Xu et al., 2009), aging (Kristal et al., 2007; Menni et al., 2013), and to earlier diagnosis and prognosis (Aimetti et al., 2012; Bernini et al., 2011b; Cacciatore et al., 2013; Ellis et al., 2007; Jiménez et al., 2013; Maccaferri et al., 2012).
Although metabolic profiling via NMR has been successfully deployed to describe and characterize a large variety of (pathophysiological) conditions such as cancer (Abate-Shen et al., 2009; Oakman et al., 2011a; 2011b; Sreekumar et al., 2009), celiac disease (Bernini et al., 2010; Bertini et al., 2008; Calabrò et al., 2014), diabetes (Dumas et al., 2007; Vallejo et al., 2008; Wang et al., 2011), and Alzheimer and cardiovascular diseases (Holmes et al., 2008a; Orešič et al., 2011; Sato et al., 2012; Yap et al., 2010), it still remains an elusive entity. High resolution NMR spectra can be subjected to dimension reducing procedures (binning) (Anderson et al., 2008; 2011), but still the metabolic fingerprint remains a multivariate or even megavariate entity. Its individuality is given by the interplay between different concentration levels and by covariance patterns of different molecules. Disentangling and extracting the constituent building blocks of the metabolic fingerprint from high-dimensional data requires the application of multivariate statistical tools and/or machine learning algorithms (Cacciatore et al., 2014; Jansen et al., 2005; Saccenti et al., 2013; Trygg et al., 2007; Weckwerth et al., 2005), the latter often requiring a large number of samples in order to build and train predictive models (Stockwell et al., 2002).
Frequencies composing the Free Induction Decay (FID) (i.e., the NMR spectrum before Fourier transform) are typically within the human range of hearing, between about 20–20000 Hz, thus it is possible to listen to them. This suggests the intriguing hypothesis that the sound given by the FID could be considered as an alternative representation of the information contained in the NMR spectrum, possibly able to reduce the complexity of the metabolic fingerprint.
The concept of auditory presentation of NMR signals is not new. Indeed, it has been shown for decades that acoustic information may efficiently reveal experimental mis-settings in an NMR experiment (http://www.chemie.uni-erlangen.de/oc/bauer/music.html) (Bauer, 1996). However, since the late 1970's, when NMR spectroscopy emerged as a basic methodology for the structural analysis of even complex molecules at the atomic level, analogue-to-digital conversion and computer-driven fast Fourier transformation (Ernst et al., 1987) banished the audio detection of NMR signal into oblivion. Indeed, the acoustic analysis of an NMR signal causes a loss of information at the atomic or molecular level; the obvious consequence is that audio detection is useless when one is interested in a detailed understanding of the structure or in a quantitative analysis of the systems investigated.
A complex mixture of small molecules, such as a urine sample, represents a case in which auditory analysis of NMR signals could be informative because all the information concurring to the individual metabolic phenotype characterization is contained in the audio-detected NMR signal, and therefore, the hypothesis that acoustic detection provides insight into the metabolic fingerprint deserves consideration. The FID of a mono-dimensional (1D) NMR experiment is a convolution of thousands of audio frequencies, typically lasting about 2–4 seconds, due to long spin–spin relaxation time (T2) of 1H spins from small metabolites. From an acoustic perspective, this is analogous to the sound emitted by a bell. On the other hand, for many NMR applications, such as the study of large biomolecules and solid-state experiments, the acquisition time is typically of the order of 0.1 sec, and therefore the audio signal would not last enough to allow any direct acoustic analysis.
The pitch of a bell, as well as the perception of a strike tone, arises from the convolution of hundreds of vibrational modes, which can be evenly constituted by both harmonic and anharmonic components (Schneider et al., 2009). As a consequence, each bell is different from any other, with a proper univocal acoustic fingerprint that depends on the size, the shape, and the material used for the construction (Fletcher et al., 1998; Özakça et al., 2004; Perrin et al., 1995). The analysis and human perception of complex tone signals, such as those produced by a bell or by a urine sample subjected to an NMR experiment, is a psychoacoustic process that it is still a matter of study (Green, 2005; Terhardt et al., 1982; Zatorre et al., 2002). However, as a matter of fact, complex tone signals are, in principle, univocal. People with normal hearing can perceptually segregate a target harmonic complex tone (HCT) from other sounds, such as when following one melodic line in a symphony (Deutsch, 1979) or talking with a person at a cocktail party (Darwin et al., 2003). A factor that contributes to this ability is the unitary pitch evoked by the components in an HCT (Wang et al., 2013); the components are usually fused and heard as a single sound with one pitch.
Here we provide evidence that this behavior holds also for FIDs of urine samples, where thousands of frequencies are convoluted and heard as a single sound with a unique pitch. An auditory test performed by normal hearing volunteers on the NMR signals of urine samples from healthy donors permits the recognition of individual donors.
Material and Methods
Ethics approval statement
The present study analyzed data from previous material (Assfalg et al., 2008; Bernini et al., 2009; Saccenti et al., 2014). As deliberated by the Ethical Committee of the Area Vasta Toscana–Tuscany Health Centre (Prot. 5409/2014), no further ethics authorization was required to analyze the data collected during the original studies. Each volunteer gave written informed consent for treatment of the personal data. Data were anonymized and anonymously analyzed.
Sample collection and preparation
The donors were four healthy males, randomly selected from a cohort of 31 young adults; samples were collected during previously reported studies in which up to 40 urine samples were collected on consecutive days (Assfalg et al., 2008; Bernini et al., 2009; Saccenti et al., 2014). In the first set of experiments two donors were considered: four urine samples for each donor, taken from the first data collection, were used in the clustering test. For the classification test, eight urine samples from each donor were used: four samples were taken from the first data collection and four samples were taken from the samples collected 2 years later. A further validation experiment has been performed with two other donors, selected from the same cohort of previously investigated donors. Eight urine samples from each donor were used, all belonging to the same data collection.
Urine samples were shaken before use and 630 μL were centrifuged at 14,000 RCF for 5 min. 540 μL of the supernatant were added to 60 μL of potassium phosphate buffer (1.5 M K2HPO4 in 100% 2H2O, pH 7.4). 540 μL of the mixture were put into 4.25 mm NMR tubes (Assfalg et al., 2008; Bernini et al., 2009; 2011a).
NMR spectroscopy
All 1H NMR spectra were acquired using a Bruker 600 MHz spectrometer operating at 600.13 MHz proton Larmor frequency and equipped with a 5 mm CPTCI1H-13C/31P-2H cryoprobe including a z-axis gradient coil, an automatic tuning-matching, and an automatic sample changer. Before measurement, samples were kept inside the NMR probehead for 3–5 min, for temperature equilibration at 300.0 K. For each urine sample, a 1D NMR spectrum was acquired using a 1D NOESY sequence with water suppression (Kessler et al., 1986). Experiments were performed using 64 scans, 98304 data points, a spectral width of 18028 Hz, and a recycle delay of 4 sec.
Free Induction Decay conversion
FID files were converted into a WAVE file, the standard high-resolution format for digital audio, using the library seewave (Sueur et al., 2008) present in R software (version 2.14.1). The R code for the conversion is provided in the Supplementary Information (supplementary material is available online at www.liebertonline.com/omi). The code, named “MusicNMR,” has been deposited to the R software library.
Audio detection experiments
Volunteer recruitment
Fifty-five healthy volunteers of both genders with normal hearing, 13–56 years of age, were enrolled to listen to the FIDs. They were divided into a group composed of volunteers without any specific experience with music or sound analysis, and a group composed of professional musicians or subjects working in the music business as producers, sound engineers, or music analysts. We use the shorthand non-musicians and musicians to respectively signify the two groups. Musical skills and professional experiences of musicians are detailed in Supplementary Table ST1. The volunteers were instructed to perform the test in a quiet environment and to make use of high quality monitors or headphones. Volunteers were not informed about the physical origin of the audio signals. They were instructed to discriminate or classify audio signals arising from different “bells.”
Statistical methods
Data pre-processing
Prior to statistical analysis of the Fourier-transformed NMR spectra, the spectral data regions corresponding to residual water (4.50–5.00 ppm) and urea (5.50–6.00 ppm) were removed from the subsequent analysis. Each 1D spectrum in the range between 0.20 and 10.00 ppm was segmented into 0.02-ppm chemical shift bins, and the corresponding spectral areas were integrated using AMIX™ software (version 3.8.4; Bruker BioSpin) giving a total of 450 variables. The data were then normalized such that the total integral of the remainder of each spectrum was a constant. Then, data were mean-centered and unit-variance scaled.
Statistical analysis
Principal Component Analysis (PCA) was performed using the standard algorithm as implemented in the prcomp function in the R library stats. Clustering analysis was performed with the k-means algorithm (Jain, 2010) using the function kmeans in R library stats. The Adjusted Random Index (ARI) (Hubert et al., 1985) was used to compare the results of the clustering and the similarity between two classifications. The probability that clustering solutions were given by purely random guess was modeled by a multinomial distribution.
Orthogonal signal correction partial least square discriminant analysis (OSC-PLS-DA) (Trygg et al., 2002) was performed as previously described (Wehrens, 2011). The OSC-PLS-DA model was constructed using NMR spectral data as the X-matrix and class information as the Y-matrix. One orthogonal component was used to remove variation unrelated to class. An OSC-PLS model was built on the training set (eight NMR spectra) and applied on the validation set (eight NMR spectra). The score of the orthogonal latent component was used to classify the NMR spectra of the validation set using zero as a threshold. k-Nearest Neighbor (kNN) classification (Cover et al., 1967) was performed using the knn function in the R library class. A predictive model was built on the training set and the validation set was classified by making use of k=3 neighbors. Diagonal discriminant analysis (DDA) (Dudoit et al., 2002) was performed using the diagDA function in the R library sfsmisc. A predictive model was built on the training set and the validation set was classified. Statistical significance was assessed using the non-parametric Wilcoxon test. A p-value <0.05 was considered significant to assess difference between groups. Fisher's exact test (Fisher, 1922) was used to assess the significance of the data. Calculations were performed in the R software environment (version 2.14.1) (Ihaka et al., 1996).
Results
Clustering test
Volunteers were asked to listen to eight audio signals, resulting from the audio conversion of the FIDs of eight urine samples belonging to the two donors D1 and D2, and to cluster them into two numerically homogeneous groups on the basis of perceived similarities. The idea was to investigate the ability of different subjects to segregate, within each pitch signal, acoustic elements that allow one to perform a signal classification. Within this frame, we proposed the test to 20 volunteers, equally divided in two groups, musicians and non-musicians, as described in the previous section. Example of FIDs used for the tests are shown in Figure 1, together with their corresponding NMR spectra.
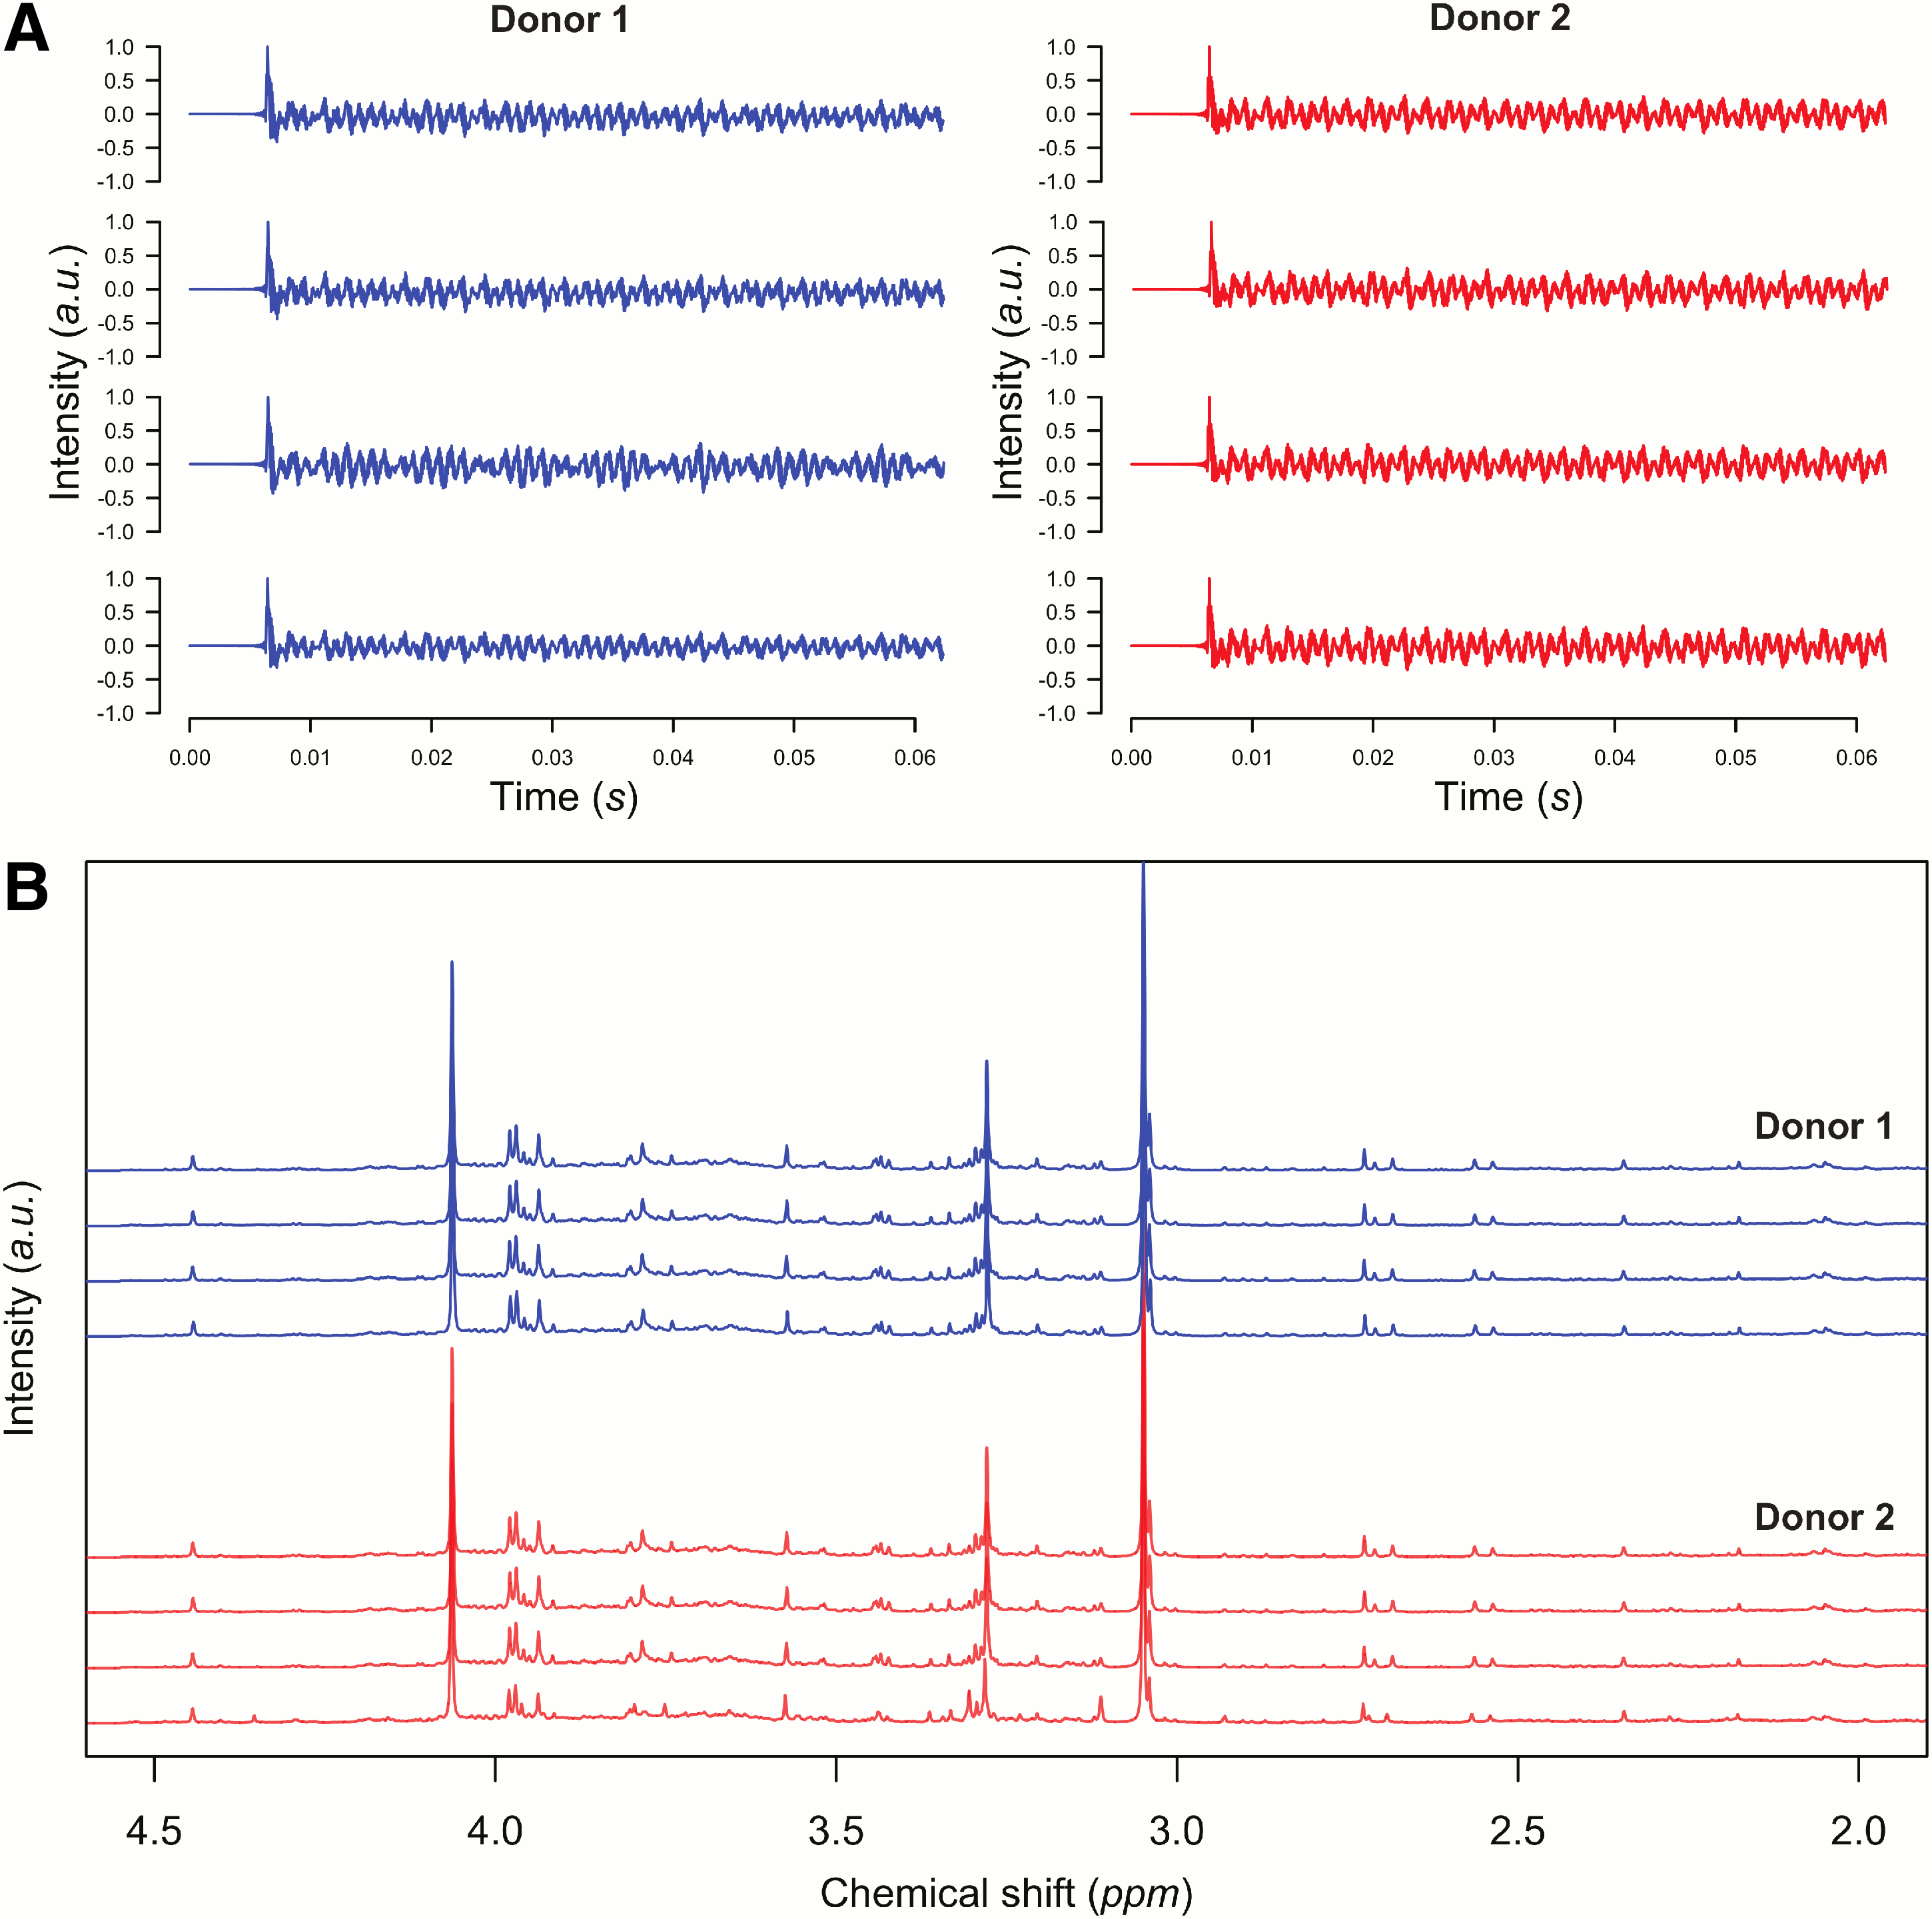
FIDs
Results have been scored using the Adjusted Random Index (ARI) (Hubert et al., 1985). ARI values range from −1 to 1: perfect agreement is scored 1, while 0 corresponds to a random partition and negative values indicate less agreement than expected by chance. The average ARI for the non-musicians was 0.125, while it was 0.329 for the musicians. To assess the significance of these results, the ARI score of the two groups were compared with a null distribution obtained by calculating the distribution of ARI scores obtained by sampling random partitions for N=10 subjects modeled with a multinomial distribution. The null distribution is given in Figure 2: as expected, the maximum probability occurs for an ARI score equal to 0, corresponding to a partition obtained purely by random guess. The probability to obtain by pure chance a result similar or better than that obtained by non-musicians is 7% and it is almost two orders of magnitude smaller, 0.05%, for the group of musicians (see Fig. 2).
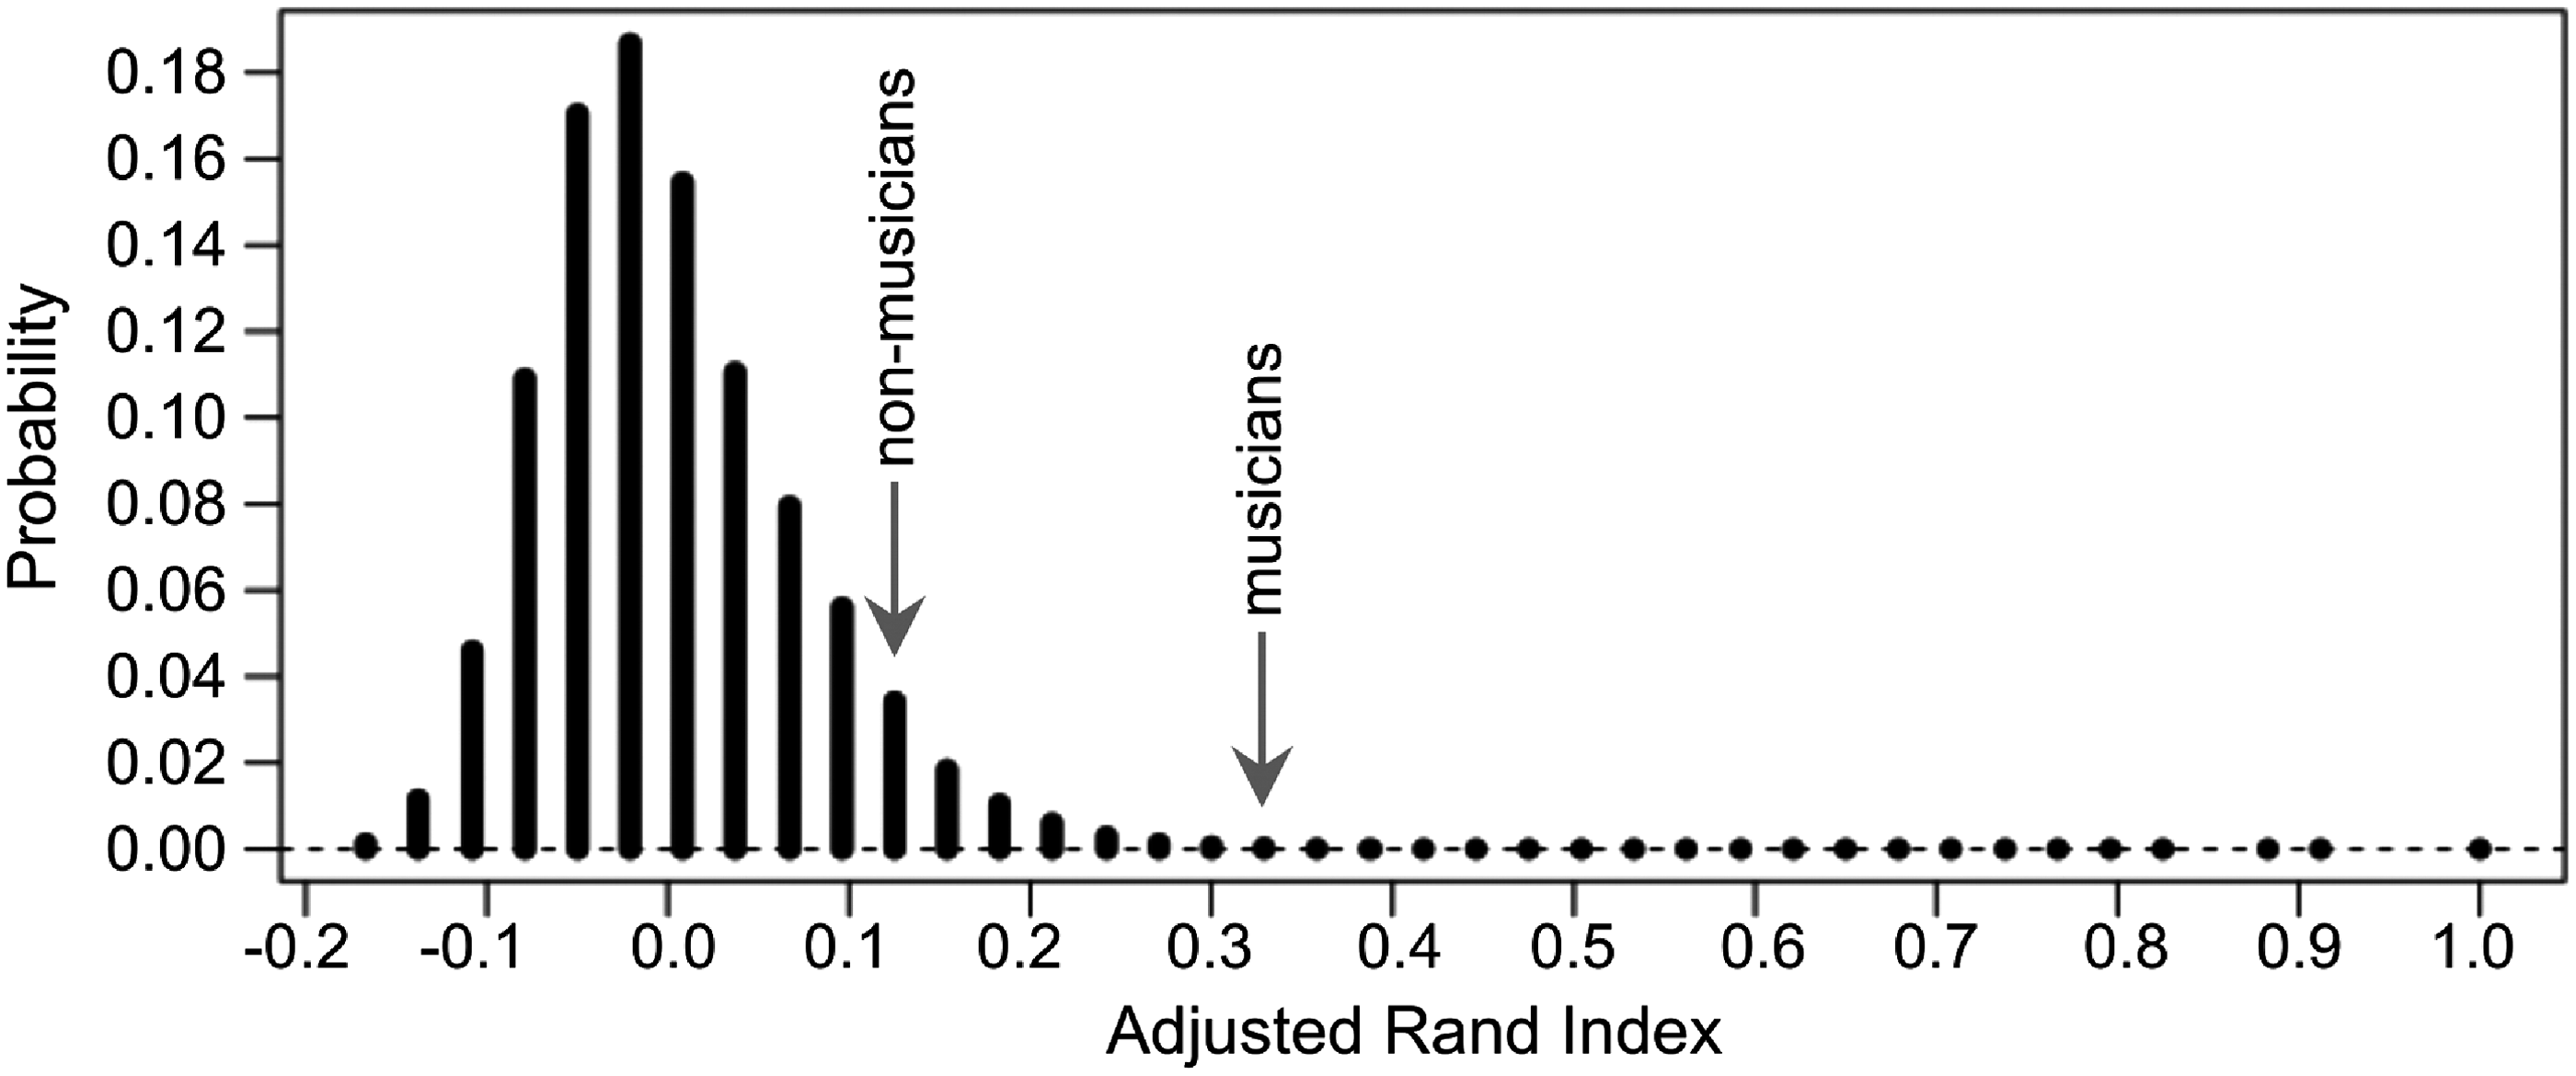
Probability distribution of random partition as a function of the ARI value. Distribution has been calculated for N=10 volunteers. Results obtained by non-musician volunteers and musicians are indicated.
To compare the efficiency of the audio recognition process with standard chemometrics analysis, the corresponding eight NMR spectra were analyzed, after Fourier transformation and pre-processing, using the clustering algorithm k-means, which is one of the most widely used and best performing clustering algorithms (Cacciatore et al., 2014; MacQueen, 1967). The clustering obtained by k-means algorithm achieved an ARI score of 0.16, which is larger than the score for non-musicians, but interestingly, much smaller than those obtained by musicians. The similarity of the NMR profiles can also be analyzed by means of a PCA score plot. As shown in Figure 3, without any a priori information the unambiguous separation between the two donors is not straightforward in the PCA score plot.

PCA score plot of the spectra of urine samples of the clustering test. Symbols refer to the different donors.
Classification test
The clustering test shows the ability of human hearing to discriminate between the FID's of different donors. Two donors were used in the first set of experiments and two other donors were used for validation, as detailed in the Material and Methods Section. To strengthen our hypothesis, we applied acoustic detection to understand whether the information on subject-specificity, which allows discrimination between two healthy donors, is maintained with time.
A larger cohort of 29 non-musicians and 14 musicians was asked to listen to eight audio signals arising from the FID's of the urine spectra of the two donors (four spectra per donor) D1 and D2. The experiment was performed about 10 months after the clustering test and only 20% of the volunteers performing the classification test were involved also in the clustering test. The volunteers were instructed to consider these eight audio tracks as a training set, providing them with reference acoustic signals to discriminate donors D1 and D2. Subsequently, they were asked to listen to eight audio signals, given to them as unknown, arising from urine samples collected from the same donors D1 and D2 two years later, and to classify them as belonging to donor D1 or D2, on the basis of perceived similarities with the audio signals of the training set. In this case, no information was provided to the listeners on the number of audio signals belonging to each donor. The overall results are summarized in Figure 4, while individual performances are given in Supplementary Tables S2 and S3. The average accuracy attained by the complete cohort was 0.76±0.23 (average specificity 0.77±0.25, average sensitivity 0.75±0.22), strongly supporting the idea that the uniqueness of the metabolic phenotype is preserved even when reproduced as audio signals and therefore metabolic fingerprinting can be achieved also by audio-detection of the FID.

Results of the classification test obtained by the two groups of non-musicians and musicians listeners. Details about the individual skills of the subjects of the “Musicians” group are presented in Supplementary Material.
When classification results are analyzed separately for musicians and non-musicians, the musicians scored an average accuracy 0.84±0.15 (average specificity 0.84±0.22, average sensitivity 0.84±0.13), while non-musicians scored an average accuracy 0.72±0.25 (average specificity 0.71±0.25, average sensitivity 0.73±0.28). A one-tailed Wilcoxon test assessed a statistically significant difference between the averaged accuracy of musicians and non-musicians with a p-value of 0.045.The overall accuracy of the two groups, considering that each subject was presented with eight tests was also considered. In total, musicians answered correctly to 84% of the tests against the 72% of non-musicians. This difference is statistically significant with a p-value of 0.0097 according a one-tailed Fisher's exact test.
A statistical analysis was also performed where the same eight NMR urine spectra of each donor were used to train a pattern recognition algorithm. When different methods (i.e., OSC-PLS-DA, kNN, and DDA) were presented with spectra belonging to different subjects, they were able to assign the spectra to the correct donor with 100% accuracy, thus proving that each subject possesses a unique metabolic phenotype that makes him/her distinguishable from other subjects. The scores of the OCS-PLS-DA model are shown in Figure 5.

Score plot obtained from the OSC-PLS-DA model built on the training set used for the classification test. Open markers (□, ◯) refer to the NMR spectra of the training set. Solid markers (●, ■) refer to the spectra used in the validation set. Symbols signify the two donors D1 and D2.
As a further validation test, we performed a second classification test using urine samples from two different donors, again selected from the same cohort used in a previous study (Assfalg et al., 2008). An average accuracy of 70.4%, with a p–value<10−4 of obtaining the same results simply by random guess, was obtained when analyzing results obtained by twenty-five listeners (both musician and non-musician volunteers were considered), thus confirming that classification via acoustic detection can be performed considering any randomly selected pair of donors among the cohort.
Discussion
Our working hypothesis is that human hearing is able to perceive (dis)-similarities of the metabolic urine phenotypes of two healthy subjects on the basis of their sound. The number of listeners we involved in this study, the number of donors we considered, the type of tests we performed, are relatively small (four donors in total: two in the first set of experiments and two used for validation); studies on a larger scale are required as a proof of concept. Nevertheless, the experiments previously described strongly support this view. If our hypothesis is correct, one can expect that the ability to correctly classify the audio signals will improve for listeners with a trained ear and professional skills in sound analysis. Indeed, the clustering experiment gives an average ARI score for musicians of 0.329; the probability to obtain by random guess a similar, or better, result is 0.05 (i.e., about two orders of magnitude smaller than those obtained by non-musicians).
The classification tests provide different yet complementary information with respect to the clustering. The classification experiment is a supervised pattern recognition test, in which a training set of audio signals is provided to the listeners to “learn” what the two donors sound like. It is substantially different from the clustering experiment, which is an unsupervised pattern recognition test where no reference was given to the listeners who were asked to group the audio signals on the basis of some inherent similarity. The audio classification test mimicked indeed what is typically done in metabolomics studies when using supervised statistical analysis (Assfalg et al., 2008; Bernini et al., 2009; Saccenti et al., 2014).
In the classification test, the “best” group of performers gives an accuracy for the acoustic analysis of 82%, which is far from the 100% accuracy provided by a pattern recognition algorithm (see Fig. 5), but consistent with observations from metabolomics-based biomedical studies [see, for instance (Bertini et al., 2008)].
Nonetheless, at the present state of the art, it is undoubtable that a conventional pattern recognition analysis via the analysis of the NMR spectra have faster and better performances than an acoustic analysis; however the classification test also fully supports the hypothesis that acoustic detection of NMR experiment can be used for discriminating between individual metabolic phenotypes, suggesting that it can be also used in a case/control setting as typical in clinical studies.
The acoustic analysis pointed out a number of interesting aspects involving both music and NMR spectroscopy. For example, answers reported in Supplementary Tables S2 and S3 indicate that the classification results were more spread within non-musicians (standard error=0.28) than in musicians (standard error=0.13). This may be due to different potential musical skills in non-musically trained subjects. One can infer that professional musicians have a better-trained ear and speculate that people with a good musical ear have better chances of becoming professional musicians. Nonetheless, some of the non-musicians attained an accuracy of 100% (one of the subjects, for instance, was a music lover without any specific musical training, but with reportedly perfect pitch). On the other side, one of the non-musicians attained an accuracy of 0% and was indeed considered a clinical case of tone deafness.
It is remarkable that some of the listeners were able to deconvolute the FID of the NMR spectrum by indicating several tones present in the spectra. For instance, they reported that they could hear in some FIDs a sharp F#: this can be associated to the peak of trimethyl-N-oxide (TMAO), a very common urine metabolite resonating at a frequency of 752 Hz, sounding indeed like a sharp F#5 whose nominal frequency is 740 Hz. In addition the presence of a flat A# and of a flat C was also reported: those can be associated with the resonances of creatinine at 454 Hz and 1066 Hz corresponding respectively to a flat A#4 and to a sharp C6, whose nominal frequencies are 466 Hz and 1046 Hz, (see Fig. 6 for an illustration).
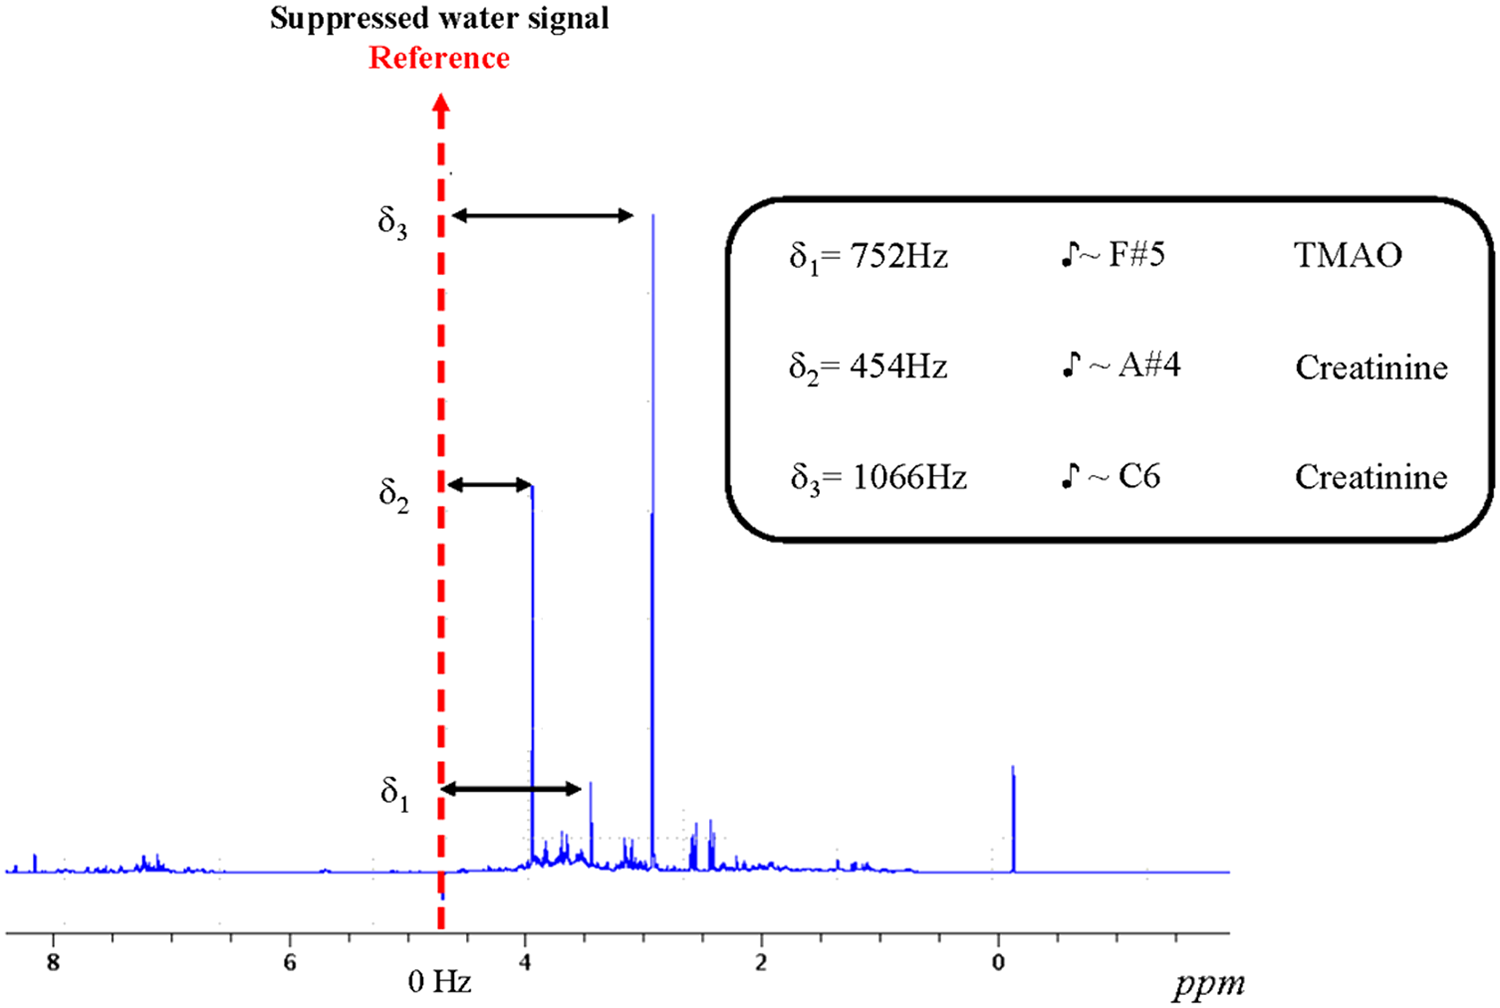
Metabolites associated with the fundamental tone perceived in FID of the NMR spectra.
TMAO and creatinine are only two of the supposedly thousands of low molecular weight molecules present in the urine whose patterns of abundance define the subject-specific individual phenotype, creating the bell sound characteristic for each donor. The Human Urine Metabolome database (www.urinemetabolome.ca) (Bouatra et al., 2013) reports the identification of 445 urine metabolites, 209 of which identified using NMR. However, the acoustic fingerprint of the NMR spectra does not arise from the recognition of a single frequency or chord, but rather from the convolution of hundreds of resonances occurring in urine. Even in a case such as the one depicted in Figure 6, where there are three signals with dominant intensities, the auditive recognition process takes into account most of the metabolites present in the sample. The biological origin of the individual metabolic phenotype is still under scrutiny: we have recently demonstrated its presence in non-human primates (Saccenti et al., 2014) and provided evidence that it is shaped by complex interplay of intrinsic factors, and to a lesser extent, of extrinsic factors (Saccenti et al., 2014).
Conclusions
The acuity of human hearing may successfully compete with sophisticated algorithms for time-frequency analysis, computer data treatment, and statistical analysis. Although we did not attempt an in-depth exploitation of such algorithms, as this is beyond the scope of this article, our results show that human hearing is able to perform, on such tasks, comparably with advanced statistical algorithms. We are not advocating for the use of the human ear in place of machine learning algorithms to tackle complex classification problems. However, we provide preliminary evidence here that the individual metabolic phenotype can potentially be identified via acoustic detection of the NMR signals.
Although surprising, these results should not be unexpected. Human analysis of acoustic signals might be superior to the performance of mathematical methods for time-frequency analysis such as Fourier Transformation (Gardner et al., 2006; Oppenheim et al., 2013). Such human “hyperacuity” is particularly relevant in professional musicians but has been observed also in non-musicians. Our experiments provide the same qualitative conclusions: excellent accuracy in auditory analyzes is more pronounced in people with trained ears but is observed also for non-trained subjects, suggesting that they are intrinsically determined by mechanisms where the human brain elaborates the acoustic signals. If the answers by volunteers were randomly generated or driven by external factors, we would expect a similar score from musicians and non-musicians. In both tests, musicians obtained scores higher than those obtained by non-musicians, strongly supporting the idea that urine samples from different donors can be recognized by the sound of their FIDs.
We have also shown that the results of the acoustic analysis operated by a human brain when listening to a harmonic complex tone signal can be compared with both supervised and unsupervised statistical analysis. The fact that acoustic analysis is not affordable on a very large set of data, such as those typically handled in a large scale metabolomics study, does not diminish our finding that human hyperacuity may outperform with respect to computer driven statistical analysis. Given the rapid advancements of applications in the field of electronic senses and the sophistication reached by audio analysis techniques, one can hypothesize larger and more in-depth application of audio-detection of NMR experiments, especially concerning applications to biosciences. So far, data treatment is based on the analysis of the NMR spectrum, which is the frequency response of the NMR signal, but our data suggest the idea that time domain signal could also be used for statistical analysis approaches.
Finally, a comment is due on our choice to perform this study by comparing two healthy subjects. Many metabolomics studies are available that address the possibility to perform early diagnosis for specific pathologies (Asiago et al., 2010; Broadhurst et al., 2006; Fanos et al., 2014; Slupsky et al., 2010; Tiziani et al., 2009). However, a crucial aspect for such studies is the establishment of a proper definition for the individual metabolic phenotype (metabotype), which could then be used for early detection of deviations from the healthy state. Once the efficiency of the acoustic detection has been analyzed and discussed with respect to statistical approaches and in the frame of previously published evidence for the existence of an individual metabolic phenotype, one might well consider the possible application of acoustic detection to other problems investigated by metabolomics studies. In principle, we expect that this approach could be potentially equally efficient in monitoring pathologies, where one can expect the perturbation induced by a pathophysiological condition to be larger than human inter-individual variability (Holmes et al., 2008b) and could be tested using other sets of data taken from available metabolomics data bases, for instance those available at MetaboLights (www.ebi.ac.uk/metabolights/) (Haug et al., 2013) or at Metaboanalyst (http://www.metaboanalyst.ca/MetaboAnalyst/) (Xia et al., 2012).
Our hypothesis that individual metabolic fingerprinting can be achieved also by acoustic detection of the free induction decay signal warrants further consideration and testing in larger study samples.
Footnotes
Acknowledgments
Leonardo Tenori is gratefully acknowledged for his comments and support. We are grateful to Claudio Luchinat and FiorGen Foundation (Sesto Fiorentino, Italy) for the permission to use part of the MetRef NMR dataset. Stefano Cacciatore was supported by a fellowship from the “Fondazione Italiana per la Ricerca sul Cancro.”
Author Disclosure Statement
The authors declare that there are no conflicting financial interests.
Abbreviations Used
References
Supplementary Material
Please find the following supplemental material available below.
For Open Access articles published under a Creative Commons License, all supplemental material carries the same license as the article it is associated with.
For non-Open Access articles published, all supplemental material carries a non-exclusive license, and permission requests for re-use of supplemental material or any part of supplemental material shall be sent directly to the copyright owner as specified in the copyright notice associated with the article.