




Abstract
Abstract
Esophageal cancer is a major global health burden with a strong host–environment interaction component and epigenomics underpinnings that remain to be elucidated further. Certain populations such as the Northeast Indians suffer at a disproportionately higher rate from this devastating disease. Promoter methylation is correlated with transcriptional silencing of various genes in esophageal cancer. Very few studies on genome-wide methylation for esophageal cancer exist and yet, no one has carried out an integromics analysis of methylation and gene expression. In the present study, genome-wide methylation was measured in samples collected from the Northeast Indian population by Infinium 450k array, and integration of the methylation data was performed. To prepare a network of genes displaying enriched pathways, together with the list of genes exhibiting promoter hypermethylation or hypomethylation with inversely correlated expression, we performed an integrome analysis. We identified 23 Integrome network enriched genes with relevance to tumor progression and associated with the processes involved in metastasis such as cell adhesion, integrin signaling, cytoskeleton, and extracellular matrix organizations. These included four genes (PTK2, RND1, RND3, and UBL3) with promoter hypermethylation and downregulation, and 19 genes (SEMG2, CD97, CTNND2, CADM3, OMD, NEFM, FBN2, CTNNB1, DLX6, UGT2B4, CCDC80, PZP, SERPINA4, TNFSF13B, NPC1, COL1A1, TAC3, BMP8A, and IL22RA2) with promoter hypomethylation and upregulation. A Methylation Efficiency Index was further calculated for these genes; the top five gene with the highest index were COL1A1, TAC3, SERPINA4, TNFSF13B, and IL22RA2. In conclusion, we recommend that the circulatory proteins IL22RA2, TNFSF13B, SERPINA4, and TAC3 in serum of patients and disease-free healthy controls can be examined in the future as putative noninvasive biomarkers.
Introduction
C
Epigenetic silencing of the tumor suppressor genes is one of the focal events in the esophageal squamous cell carcinoma (ESCC) initiation and progression episode (Li et al., 2013). Promoter methylation correlates well with transcriptional silencing in esophageal cancer (Fang et al., 2005; Herman and Baylin, 2003; Schulmann et al., 2005). The spasmodic nature of the promoter methylation alterations renders them apt for cancer chemoprevention. Few studies have been carried out pertaining to genome wide methylation (GWM) of ESCC with exclusive mention of integrome analysis of methylation and gene expression. Therefore, it might be useful to find epigenetic markers of esophageal cancer in the Northeast population. Several genes are reported to be hypermethylated in different studies in ESCC, including CDKN2AB, CLND3, MLH1, CDH1, CDKN2A, RPRM, MGMT, RASSF1, RARβ, FHIT, CLND3, APC, RBP1, C2orf40, EPB41L3, GPX3, and COL14A1 (Li et al., 2014).
A limited number of genes have been targeted in these studies with the application of a methylation specific polymerase chain reaction (MSP), thus not interrogating genome-wide methylation alterations. Recently, it was reported from the Northeast population that betel quid and tobacco chewing habit synergistically with p16 methylation increase the risk for esophageal cancer (Das et al., 2015). The same researchers earlier addressed that tobacco chewing and smoking collegially with MGMT methylation intensify the liability for ESCC in the same population (Das et al., 2014). The above studies implicate candidate gene approaches for promoter methylation involving blood samples of patients and controls and also exploit MSP to check methylation status. However, a more informative account of epigenenomics in ESCC can be deduced with genome-wide methylation (GWM) investigation involving paired tumor and normal esophageal tissues and its comparison with microarray gene expression.
Methylation is one of the decisive mechanisms by which host–environment interactions and attendant interactome changes are mediated in regard to complex traits (Chiang et al., 2014; Fridley et al., 2014; Podder and Latha, 2014). Lima et al. (2011) was the first to study the methylation changes in ESCC in a large set of genes by Illumina GoldenGate assay. The authors analyzed 1505 CpGs, revealing that differentially methylated CpG sites were significantly enriched in genes related to the IL-10 anti-inflammatory signaling pathway and the cell communication pathway. The study also scrutinized TFF1 gene as a marker of ESCC (Lima et al., 2011).
Nevertheless, the recently developed Infinium 450k array (Illumina) technology is used successfully by investigators worldwide to study GWM in various cancers (Chong et al., 2014; Karlsson et al., 2014; Lindqvist et al., 2014; Milutin et al., 2014). The array technology provides reliable DNA methylation data for epigenomic studies as it exhibits high correlation with whole-genome bisulfite sequencing (Bibikova et al., 2011). Using Infinium 450K array, Li et al. (2014) reported GWM profiling of ESCC and normal adjacent tissue in Chinese cancer patients and esophageal mucosa from healthy individuals. Comparison of methylation data with gene expression data from the GEO database was also done, thus concluding 168 genes having differentially methylated CpG sites in their promoter region and an inverse gene expression pattern.
Consequent validation in large sets of samples advocate that methylation frequency of EPB41L3, GPX3, and COL14A1 genes is higher in tumor. The differentially methylated genes in plasma is proposed to be used as biomarkers for early diagnosis of ESCC as their methylation was found only in plasma of patients, and not in normal individuals (Li et al., 2014). Probably this is the only report of GWM analysis in ESCC by using Infinium 450K array.
Cancer involves a complex web of in vivo pathways, thus understanding of function of a particular protein is not enough (Ohashi and Miyamoto-Sato, 2014; Vidal et al., 2011). Therefore, an individual approach is proposed that is essential for understanding the personality of a cancer and requires the collection of data by multi-omics examination (Ohashi and Miyamoto-Sato, 2014). The multi-omics approach studies genome-wide changes at the level of genetic variations, transcription, methylation, and protein-specific information. The interactome includes network data based on direct interactions between molecules. As a final point, an integrated approach named “Integrome analysis” that includes both interactome and multi-omics data is proposed by investigators (Baker, 2013; Ohashi and Miyamoto-Sato, 2014).
Integrome analysis is a network map of the interactome together with multi-omics data, which allows the analysis of differences between tumor and normal tissue, the effects of treatment, and important factors such as biomarkers (Dimitrakopoulou et al., 2014; Ohashi and Miyamoto-Sato, 2014). Fundamentally, in Integrome analysis, information from multi-omics data of different dimensions of molecular biology is gathered, along with any other relevant data to deduce biological meaningful conclusions (Baker, 2013).
Several differentially expressed genes in ESCC are also reported by our group in microarray-based studies (Chattopadhyay et al., 2007; 2009). Genome-wide chromosomal alterations in ESCC have also been investigated by our group in the same population (Chattopadhyay et al., 2010). Further analysis of differentially methylated promoter CpGs showing an inverse gene expression pattern is worthwhile to find epigenetic marker of ESCC. The current study clustered GWM in ESCC with previously published data of microarray gene expression by our group in the same Northeast population. Finally, an Integrome network analysis was executed to prepare a network of genes displaying enriched pathways together with list of genes exhibiting promoter hypermethylation or hypomethylation with inversely correlated expression. The two data sets were eligible for comparison as both were generated from ESCC patients from the same Northeast population and having betal quid chewing and tobacco smoking habits.
Materials and Methods
Sample collection
The study has been approved by the institutional ethics committee at BBCI, Guwahati, India. Endoscopic biopsies of tumor and normal tissue were collected from newly diagnosed esophageal cancer patients at BBCI. A written consent was taken before sample collection. Patient inclusion and exclusion criteria are summarized in Supplementary Information (supplementary material is available online at liebertpub.com/omi).
Out of total 58 ESCC patients, only 6 showed well differentiated, 4 poorly differentiated, and 48 moderately differentiated grades of tumor. The investigation proceeded further with moderately differentiated squamous cell carcinoma (Grade 2) as its patients number transcended the number of patients with other grades of tumor. Basic demographic, habits, dietary factors, and clinical characteristics of 6 patients selected for GWM is given in Supplementary Table ST1. A schematic representation of methods, workflow, and significant outcomes of the study is illustrated in Figure 1.
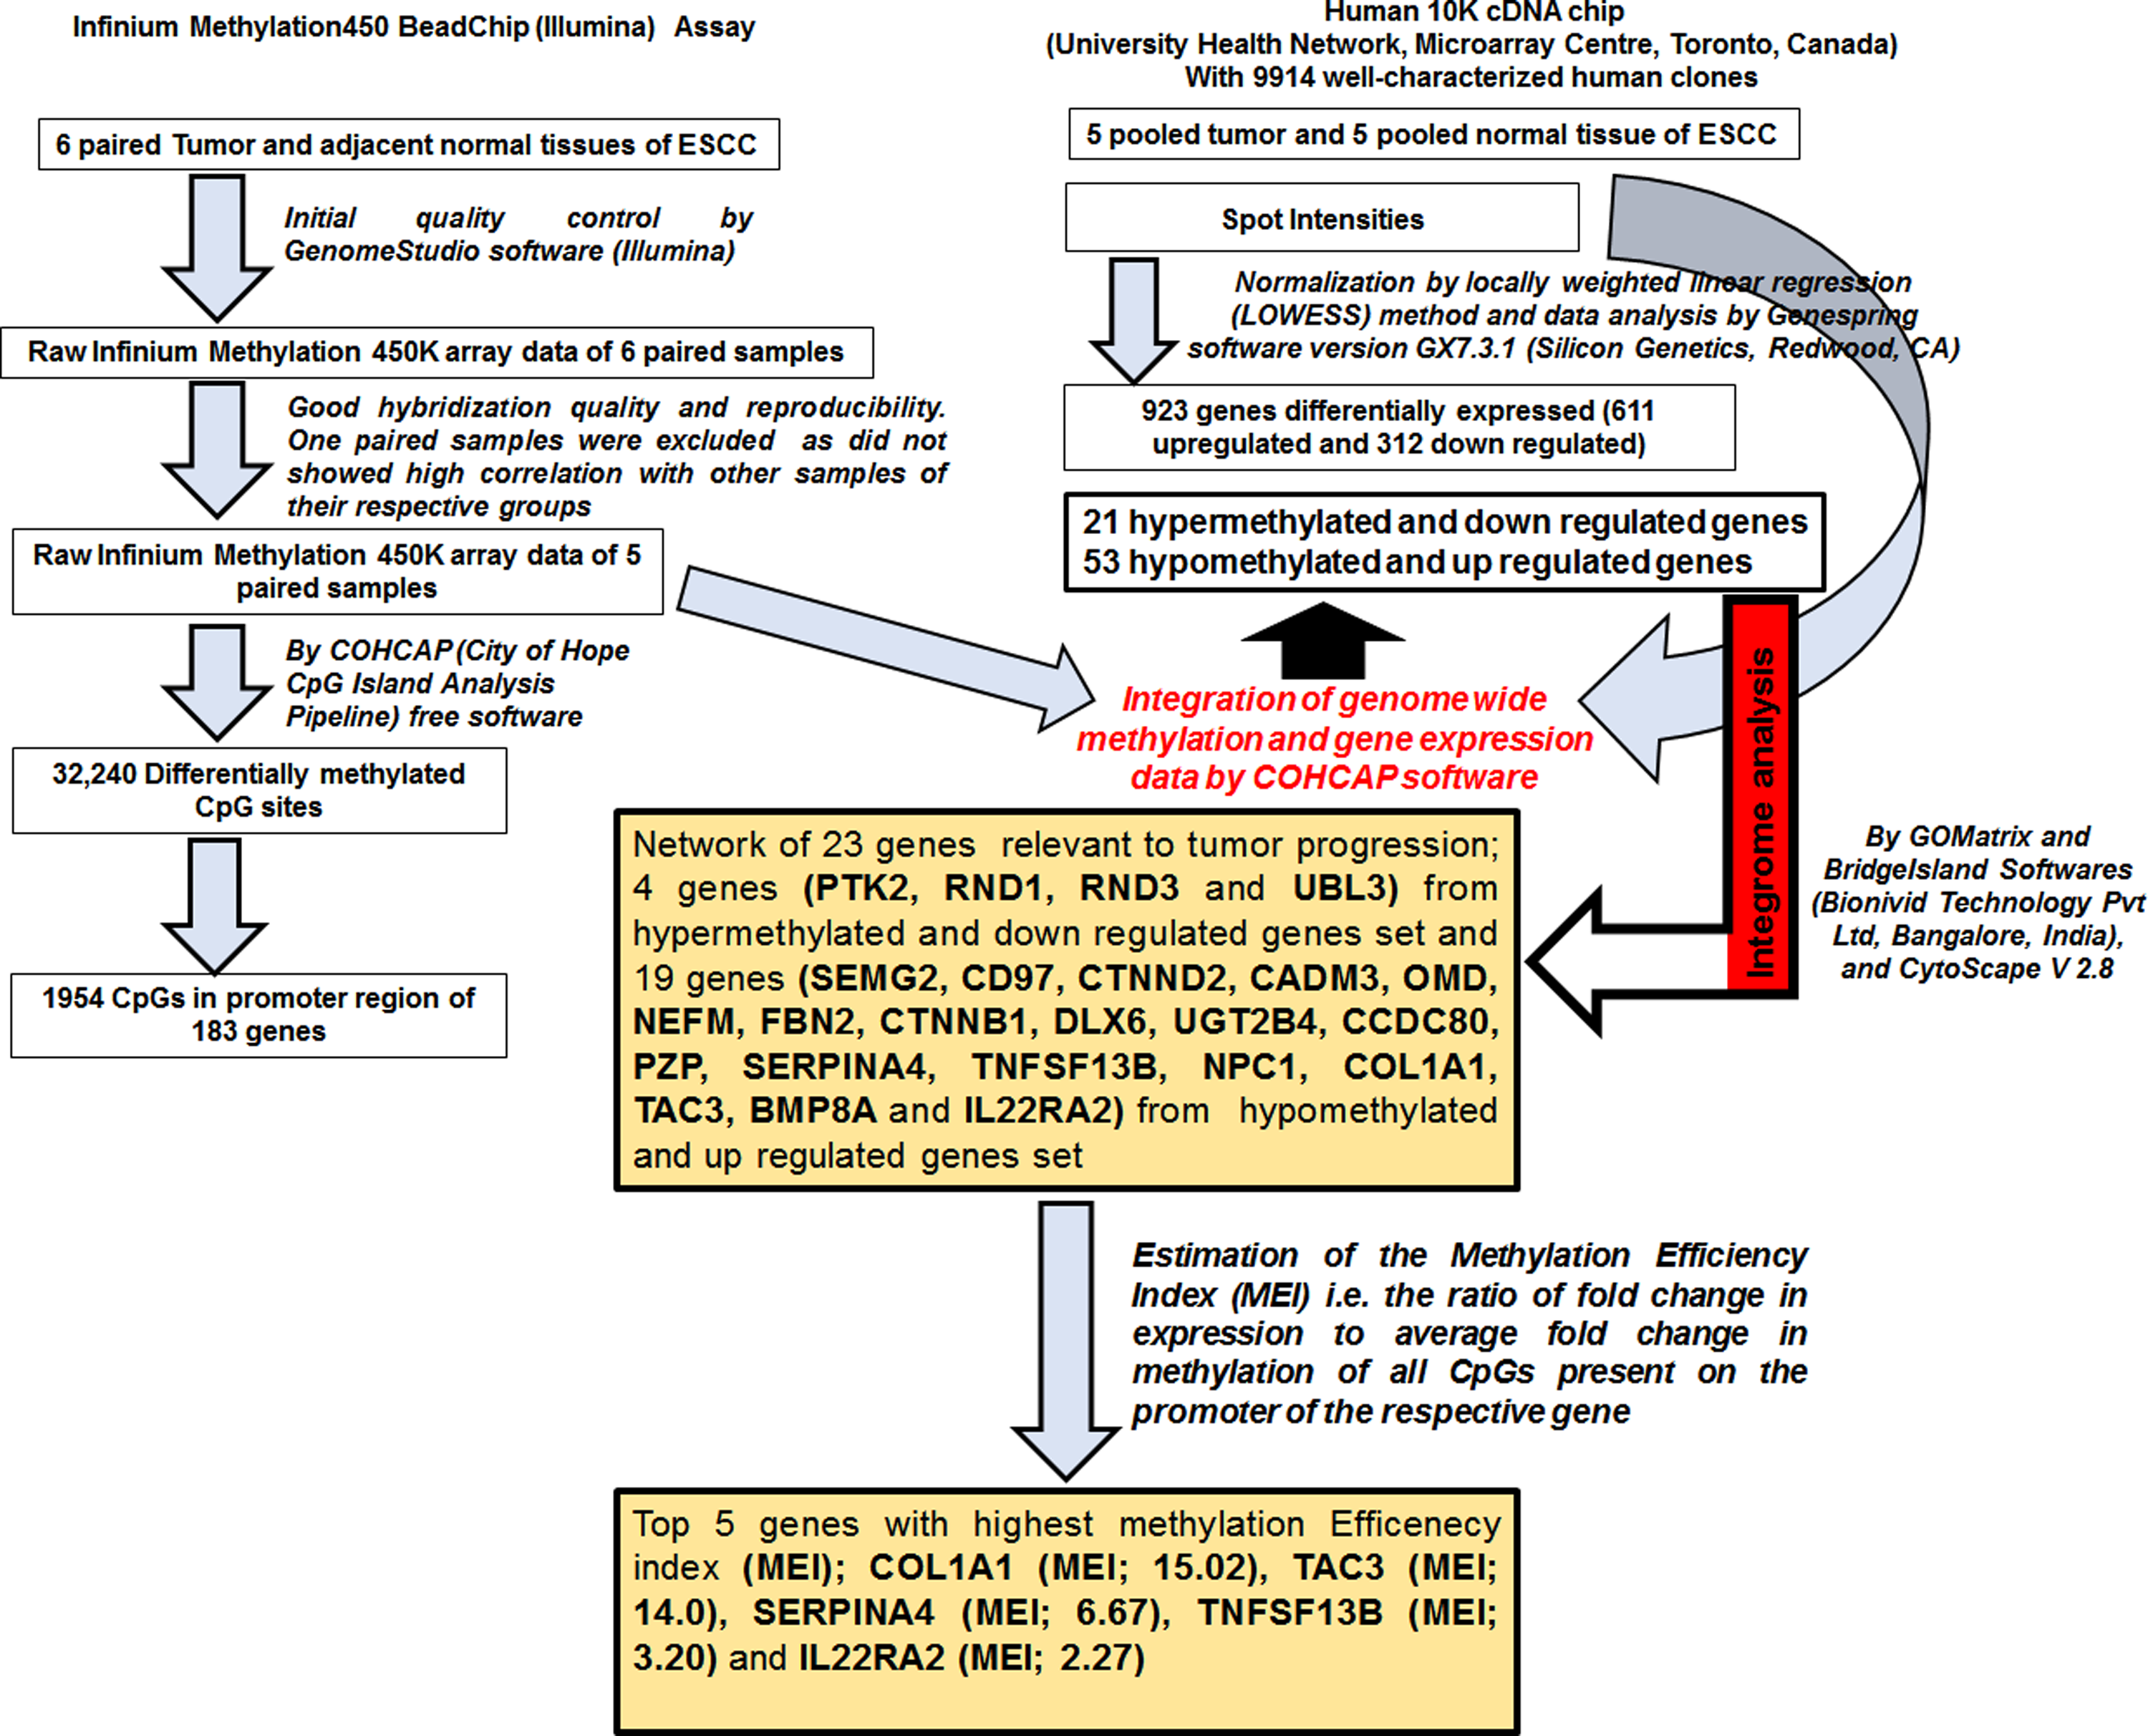
Schematic representation of workflow and significant outcomes of the study.
GWM Assay
The genomic DNA was isolated by Qiagen QIamp DNA Mini kit. Infinium 450k array (Illumina) was used for GWM profiling. GWM was carried out in six paired tumor and normal samples of age, sex (all male), ethnicity, and grade of tumor (all moderately differentiated ESCC, grade 2) matched patients having betal quid chewing and tobacco smoking habits. Methylation values were recorded as beta value for each CpG locus in each sample via Illumina GenomeStudio software (Supplementary Information).
Previous microarray gene expression data
Previously published microarray gene expression data of ESCC from the same Northeast population was taken for Integrome analysis (Chattopadhyay et al., 2007). In the previous study, corresponding normal and tumor tissue samples of 16 ESCC patients having betal quid chewing and tobacco smoking habits were used.
GWM data processing and normalization
To avoid negative values after background adjustment, any negative values were reset to 0. Illumina recommends adding a constant offset α (by default, α = 100) to the denominator to regularize Beta value when both methylated and unmethylated probe intensities are low (Supplementary Information).
Quality control analysis
There were no missing values indicating uniform hybridization. Lowest methylation detection value of 0 from the median and highest methylation detection value of 1 from the median indicated good sensitivity in measurement (Supplementary Table ST2).
Principal Component Analysis (PCA)
Principal components are orthogonal vectors that define a space of lower dimension that accounts for the maximum variation in the original space. The original space has higher dimensions and is made up of the profiles. It is therefore possible to classify samples, as well as genes, in scatter plots based on the principal components, and the scatter plots will reflect most of the information in the original data set of higher dimension. PCA analysis exhibited tumor sample No. 23 to be an outlier, therefore tumor sample No. 23 and normal sample No. 23 were excluded from the downstream analysis (Fig. 2).
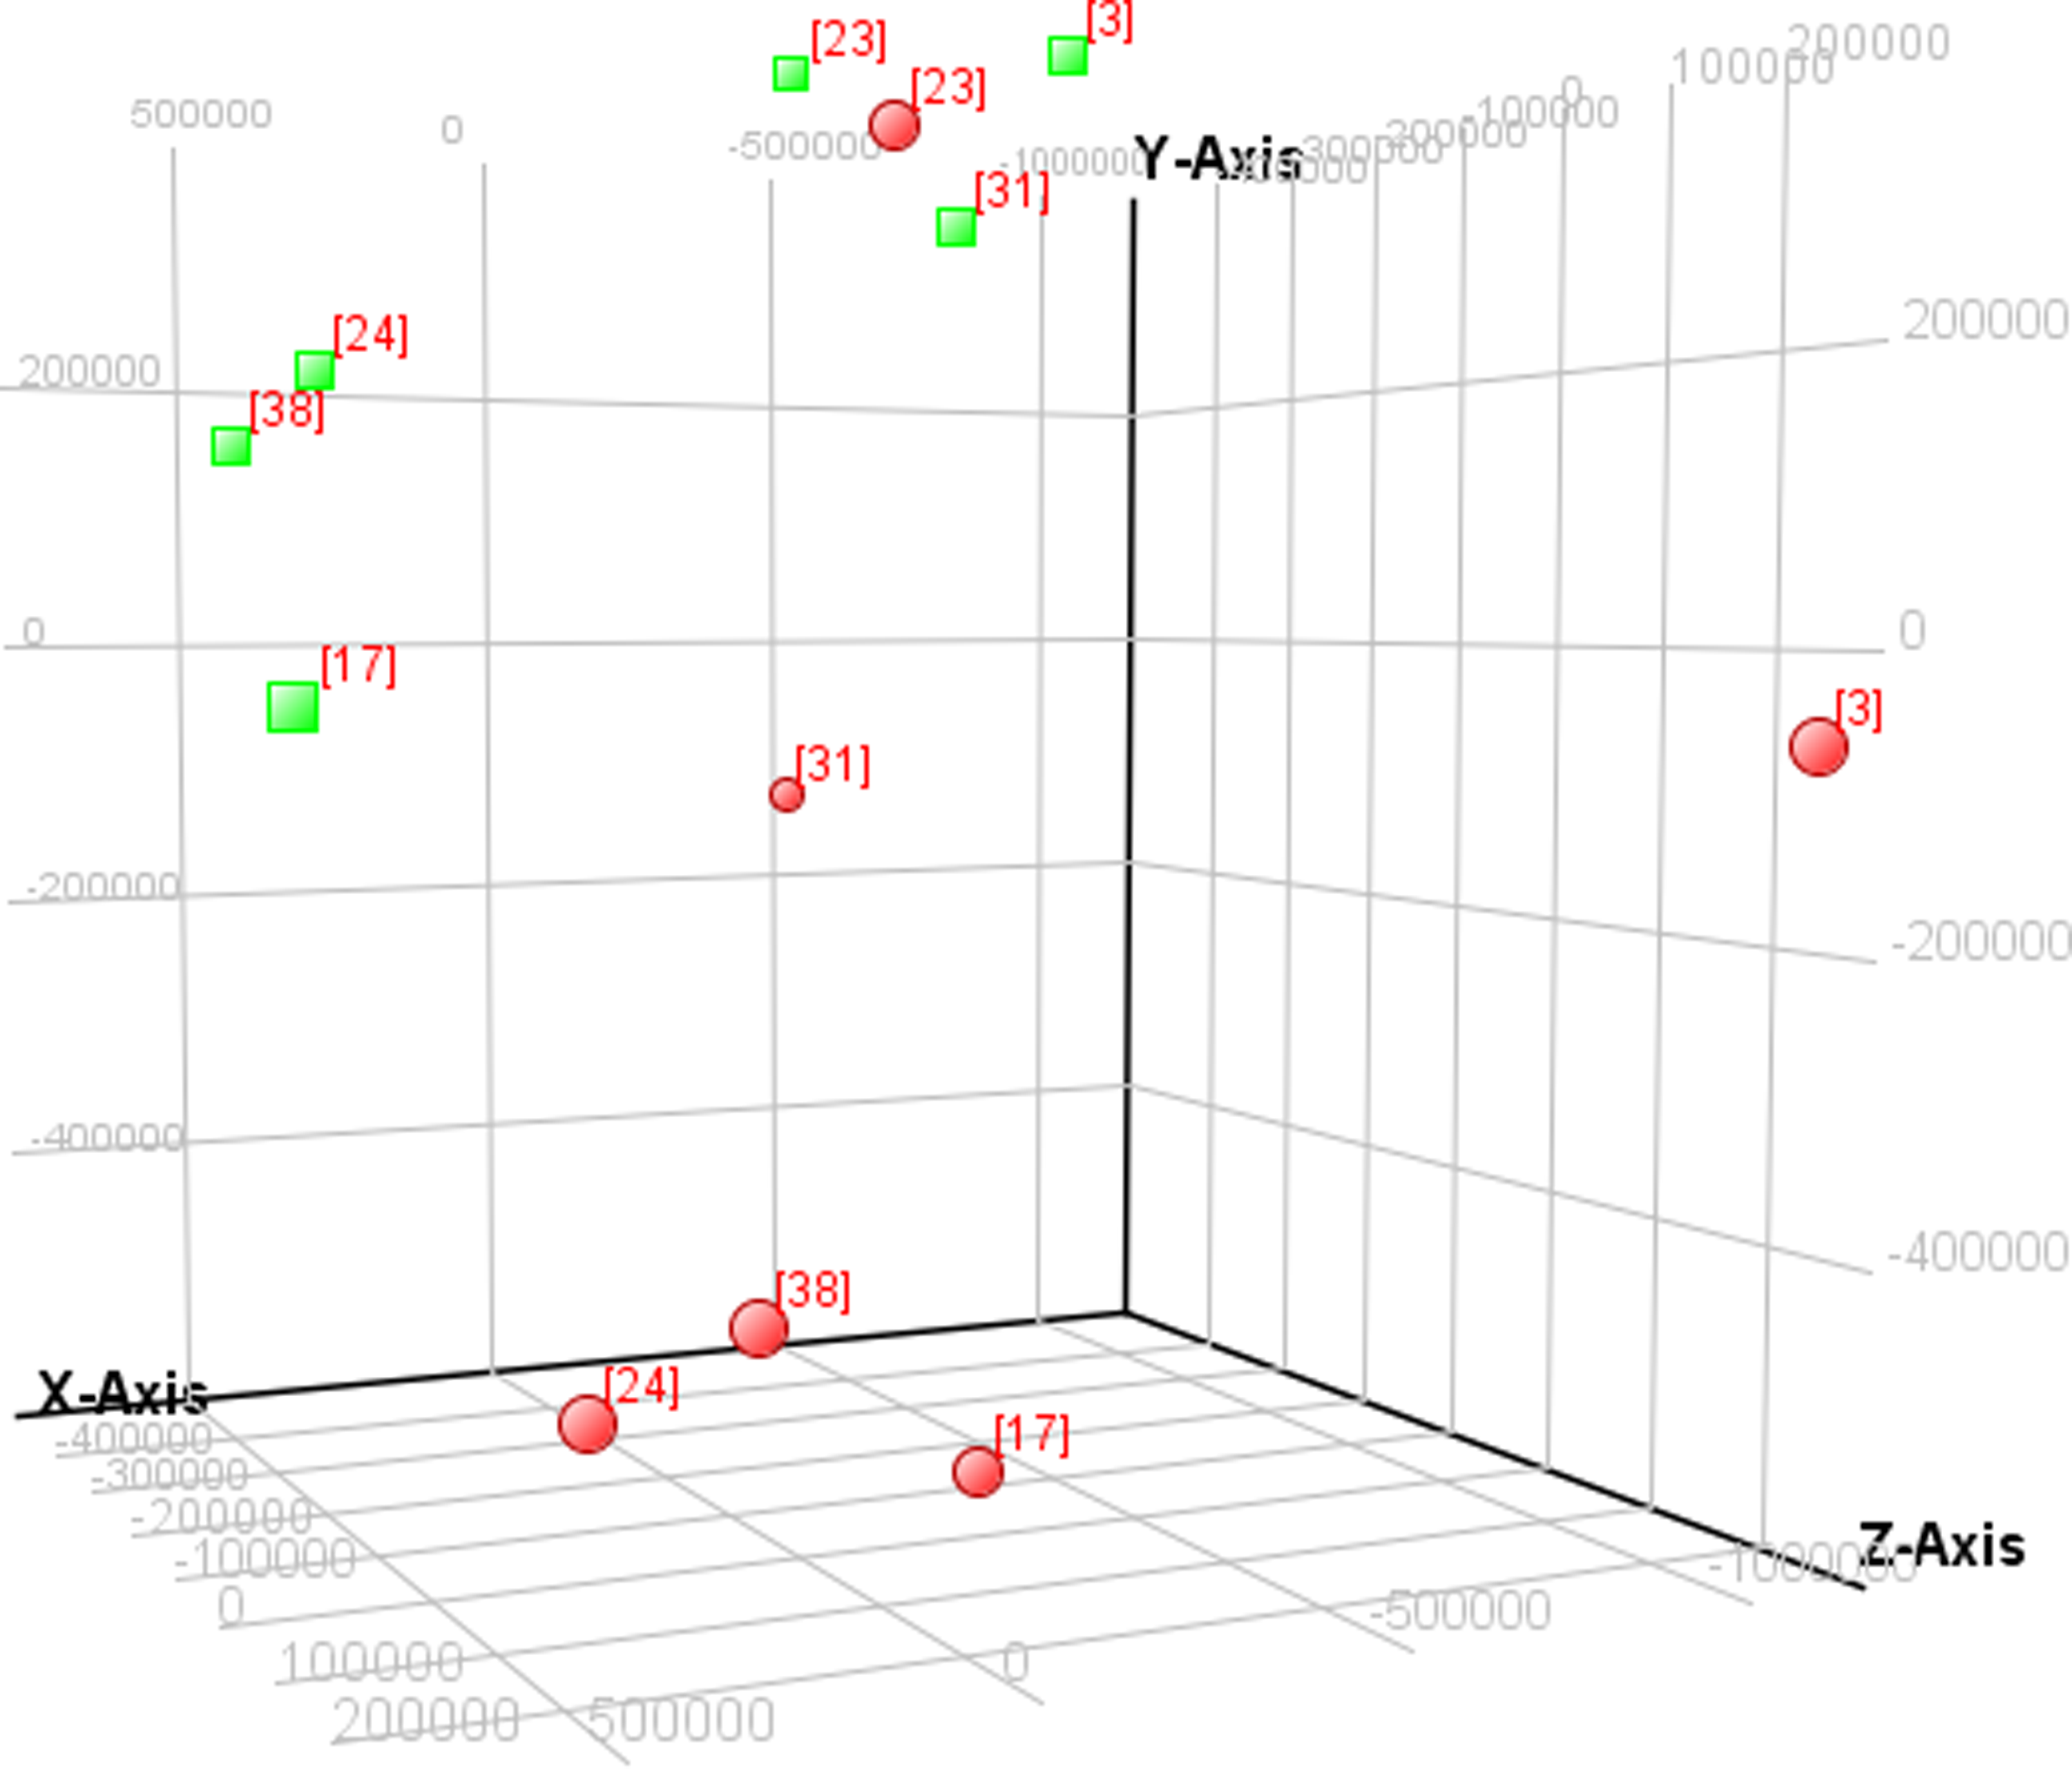
Principal components analysis of six paired tumor and normal tissue samples. Red round dots represent tumor and green square dots represent normal samples.
Correlation matrix
An eminent correlation appeared in all tumor samples and normal samples data except tumor sample No. 23. Tumor sample No. 23 and its corresponding normal were thus excluded from the paired sample analysis further (Fig. 3 and Supplementary Information).
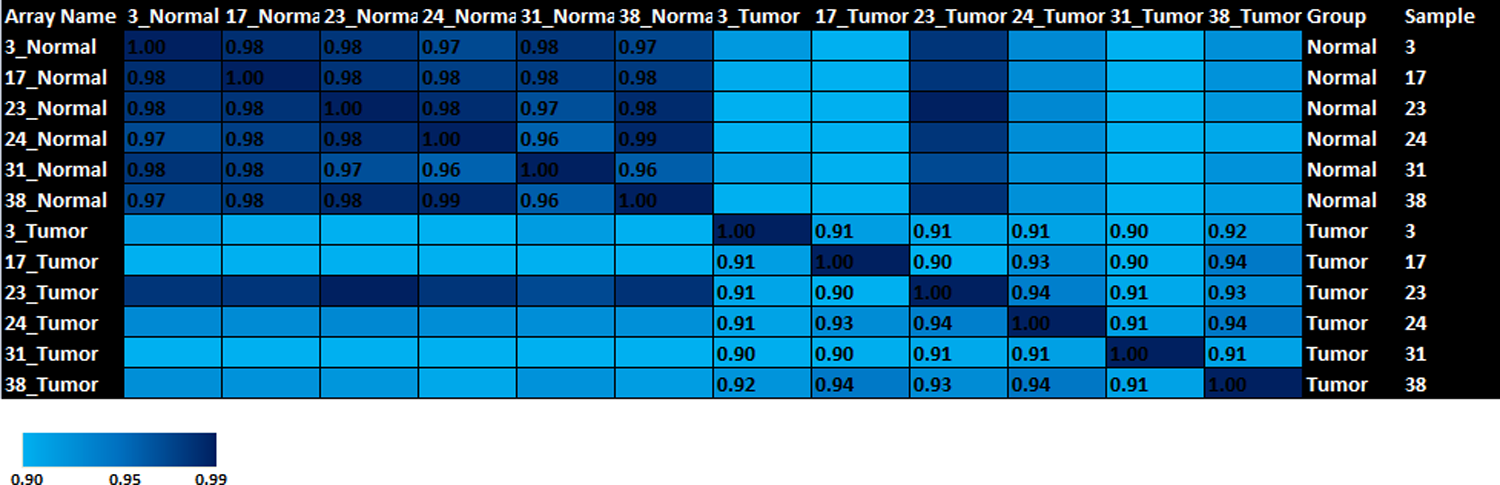
Heat-map showing correlation matrix constructed by calculating correlation co-efficient of every sample with the other samples.
Differential methylation
COHCAP (City of Hope CpG Island Analysis Pipeline) software was availed to discover overall differential methylation in accordance with different genomic locations (i.e., promoter, 5'UTR, first exon, gene body, and 3' UTR). COHCAP software is an algorithm to analyze single-nucleotide resolution methylation data produced by Infinium 450k array (Warden et al., 2013). Usage of this algorithm identified CpG islands showing a consistent pattern of methylation among CpG sites. The software is freely available at https://sourceforge.net/projects/cohcap/.
To estimate the differential methylation at each CpG site, delta-β was calculated as difference of average β values for each CpG site between tumor and normal groups. Further, statistically significant delta-β was measured by two-way ANOVA for paired sample analysis. The two workflows are recommended by Warden et al. (2013) for integrative genomic analysis by COHCAP algorithm; Average by CpG site and Average within CpG island. Average within CpG island is the default method, which has been used for the present investigation.
Integration of GWM with microarray gene expression
We have previously published microarray expression data of ESCC (Chattopadhyay et al., 2007). The two data sets were compared to find hypermethylated and downregulated as well as hypomethylated and upregulated genes by using COHCAP. Later is currently the only DNA methylation package that provides integration with gene expression data to identify a subset of CpG islands that are most likely to regulate downstream gene expression (Warden et al., 2013). CpG sites showing differential methylation were selected, and the average β values were calculated for significant CpG sites within a CpG island. Subsequently, integration was performed by observing for a significant negative correlation between beta values and gene expression levels (Warden et al., 2013).
Integrome analysis
Integrome analysis was also done to prepare a network of genes displaying enriched pathways together with list of genes for each case (i.e., hypermethylation with downregulation and hypomethylation with upregulation). Listings of over-represented biological categories identified in differentially expressed and differentially methylated gene sets were used for Integrome analysis. GOMatrix software (Bionivid Technology Pvt Ltd, Bangalore, India) was used to identify commonly over-represented biological categories between patient groups at both gene expression level and methylation level. Commonly enriched biological categories, along with their statistical significance, and differentially expressed and methylated genes were considered for downstream Integrome network analysis.
Biological analysis network modeling of Integrome
Commonly enriched biological categories along with the differentially expressed and methylated genes were used as input for BridgeIsland Software (Bionivid Technology Pvt Ltd, Bangalore, India) for identifying key edges that connect genes:mRNA:biological categories. Statistical scores from differential expression and biological analysis were used as attributes to visualize the network. Output of BridgeIsland software was used as input to CytoScape V 2.8. Circular layout under yFiles algorithm was employed to anticipate the network that encompasses biological categories, differentially expressed and methylated genes that were significantly enriched. Further to this core network, all the genes were colored, based on their fold change and methylation level in one tumor group in comparison to normal to understand disease stage specific epi-regulome.
Protein–protein interaction analysis
Finally, to analyze interactions among selected genes at the protein level, we used STRING 9.1 online (http://string-db.org/) free software. It is basically a database of known and predicted protein interactions (Supplementary Information).
Methylation Efficiency Index (MEI) estimation
The magnitude of promoter methylation does not necessarily reflect the altered transcription level. Therefore, calculation of efficiency of promoter methylation in terms of their effect on gene expression will be a valuable index for epigenetic regulation of a respective gene. We have calculated MEI as the ratio of fold change in expression and average fold change in methylation of studied promoter CpGs of the respective gene. For this, only statistically significant differentially methylated promoter CpGs of a respective gene were taken. Higher value of MEI designates how effectively that methylation directs its effect on gene expression.
Results
Differential methylation
Based on the PCA result, one paired sample was expelled and the remaining five paired samples were used for the data analysis. Clustering of the differentially methylated data clearly categorized all the samples in two distinct groups (Supplementary Fig. S1). We calculated the differentially methylated CpGs between tumor and normal tissue samples. Median methylation measure (beta value from 0.38 to 0.70) was found more often in tumor tissues compared to normal (Supplementary Fig. S2). Out of total CpGs analyzed, only 0.66% (32240) were found differentially methylated, which included 16135 hypermethylated CpGs and 16105 hypomethylated CpGs.
Various genomic region-wise analysis of differentially methylated CpGs showed almost equal distribution of hypermethylated and hypomethylated CpGs in different regions [i.e., 1st Exon, TSS200, Body, 3′UTR except 5′UTR and TSS1500 (Fig. 4)]. The frequency of differentially methylated CpGs in regions corresponding to mRNA, miRNA, noncoding regions, noncoding RNA, and small nuclear RNA is summarized in Supplementary Figure S3. The differential methylation status in all chromosomes is visualized in Supplementary Figures S4 and S5.

Proportion of hyper- and hypomethylated CpG sites and their distribution in different genomic locations. 3′UTR and 5′UTR are untranslated regions of genes. TSS1500 and TSS200 are upstream region of transcription start sites of genes.
Gene enrichment analysis
Statistically significant (p ≤ 0.05, FDR ≤ 0.3) differentially methylated CpGs of a total of 183 genes (Gene Set 1) were selected for the gene enrichment analysis using GOElite software. Highly significant (p ≤ 0.001) enriched biological processes [i.e., transcription, DNA-dependent (GO: 0006351), positive regulation of transcription from RNA polymerase II promoter (GO: 0045944), negative regulation of transcription from RNA polymerase II promoter (GO: 0000122), cell fate determination (GO: 0001709), and angiogenesis (GO: 0001525)] were associated with these genes.
The most cogent biological processes, molecular function, and associated pathways were screened based on the available relevant literature. Conclusively, highly relevant 64 genes (Gene Set 2) were selected and surprisingly it was found that most of the CpGs sites associated with these genes showed hypermethylation in tumor in comparison to CpGs sites corresponding to Gene set 1 (Fig. 5). A gene network was also constructed to envisage the interconnected genes corresponding to their associated biological processes by using Networkmaker software from Bionivid Technology Pvt Ltd, Bangalore, India (Fig. 6).

Unsupervised hierarchical clustering of differentially methylated total 183 genes.
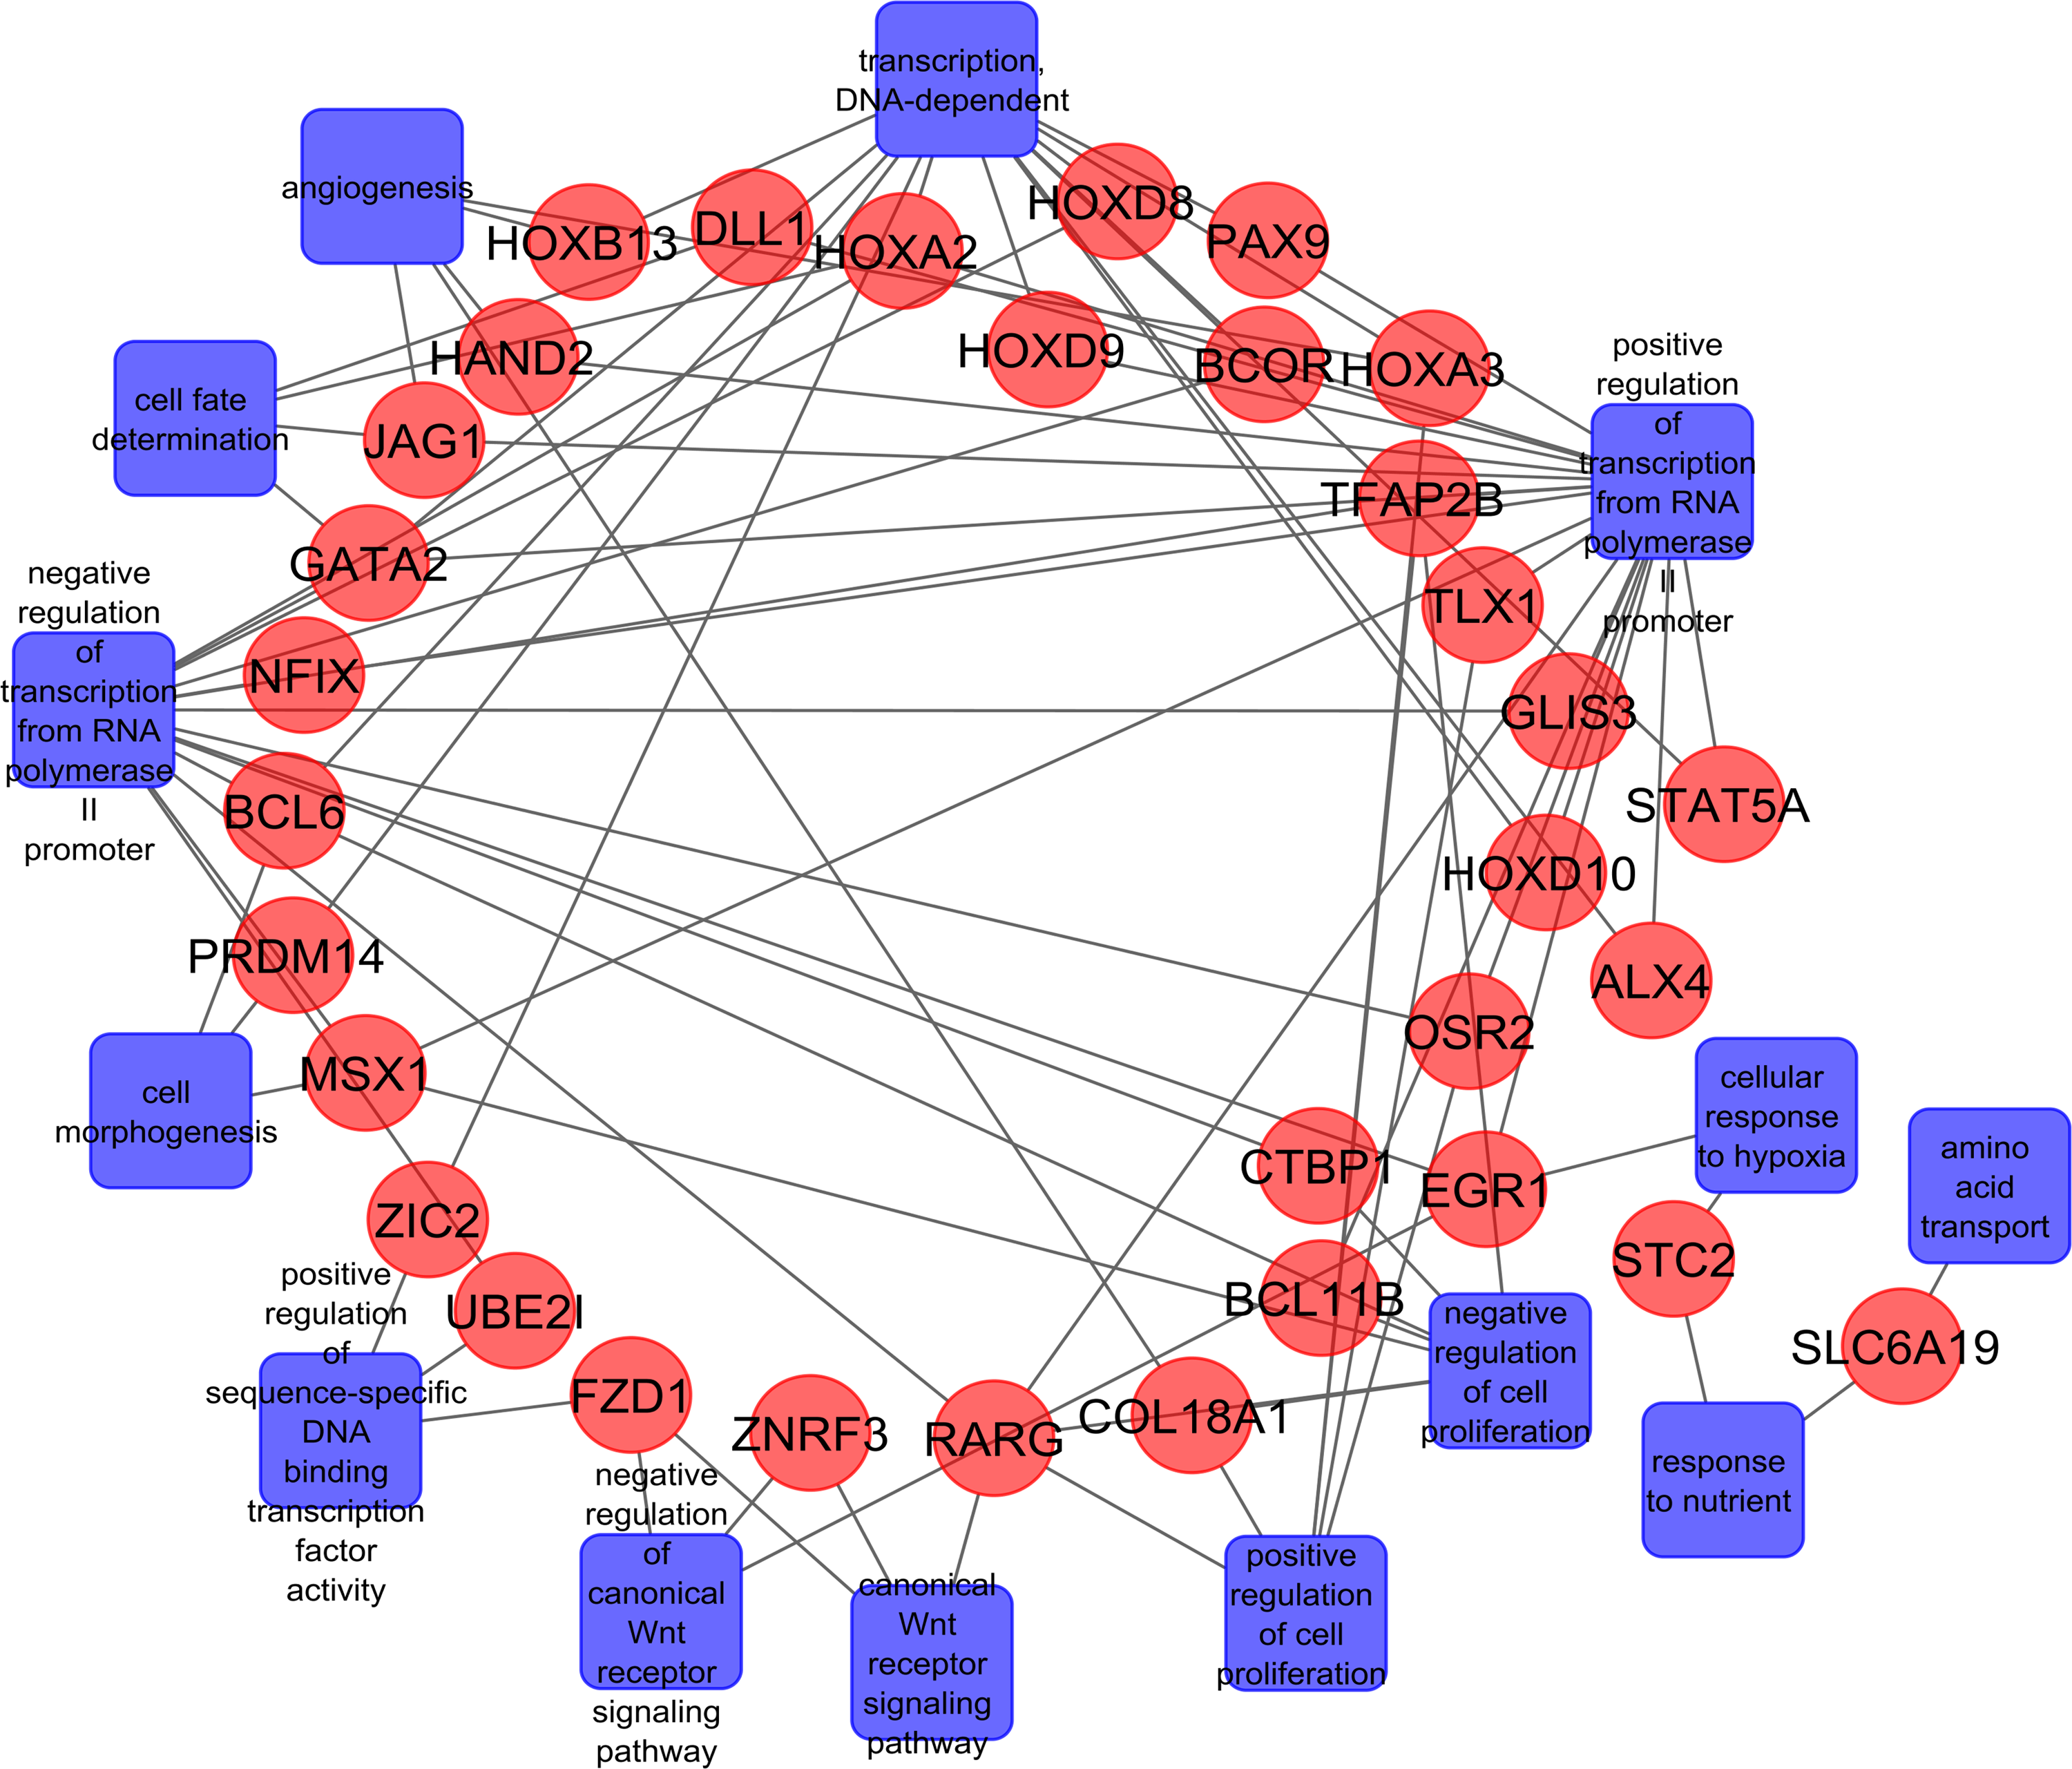
Gene Enrichment Analysis of biological processes and associated genes that were differentially methylated. This visualizes interconnected genes corresponding to their associated biological processes.
Comparison of GWM with microarray gene expression
Microarray gene expression data of patients with moderately differentiated Grade 2 tumor were considered for comparison with GWM data. The two data sets were compared by using COHCAP software. The results showed 21 hypermethylated and downregulated genes (Gene set 3). Fifty-three hypomethylated and upregulated genes (Gene set 4) were also found (Supplementary Information and Supplementary Fig. S6).
Integrome analysis
Integrome analysis revealed a network of genes displaying enriched pathways, together with list of genes for each case (i.e., hypermethylation with downregulated expression and hypomethylation with upregulated expression). The analysis resolved 23 genes from a total of 74 genes (Gene set 3 + Gene set 4) that correlated well the methylation status with gene expression status (Fig. 7). Network encompasses biological categories, differentially expressed genes, and methylated genes that were significantly enriched.
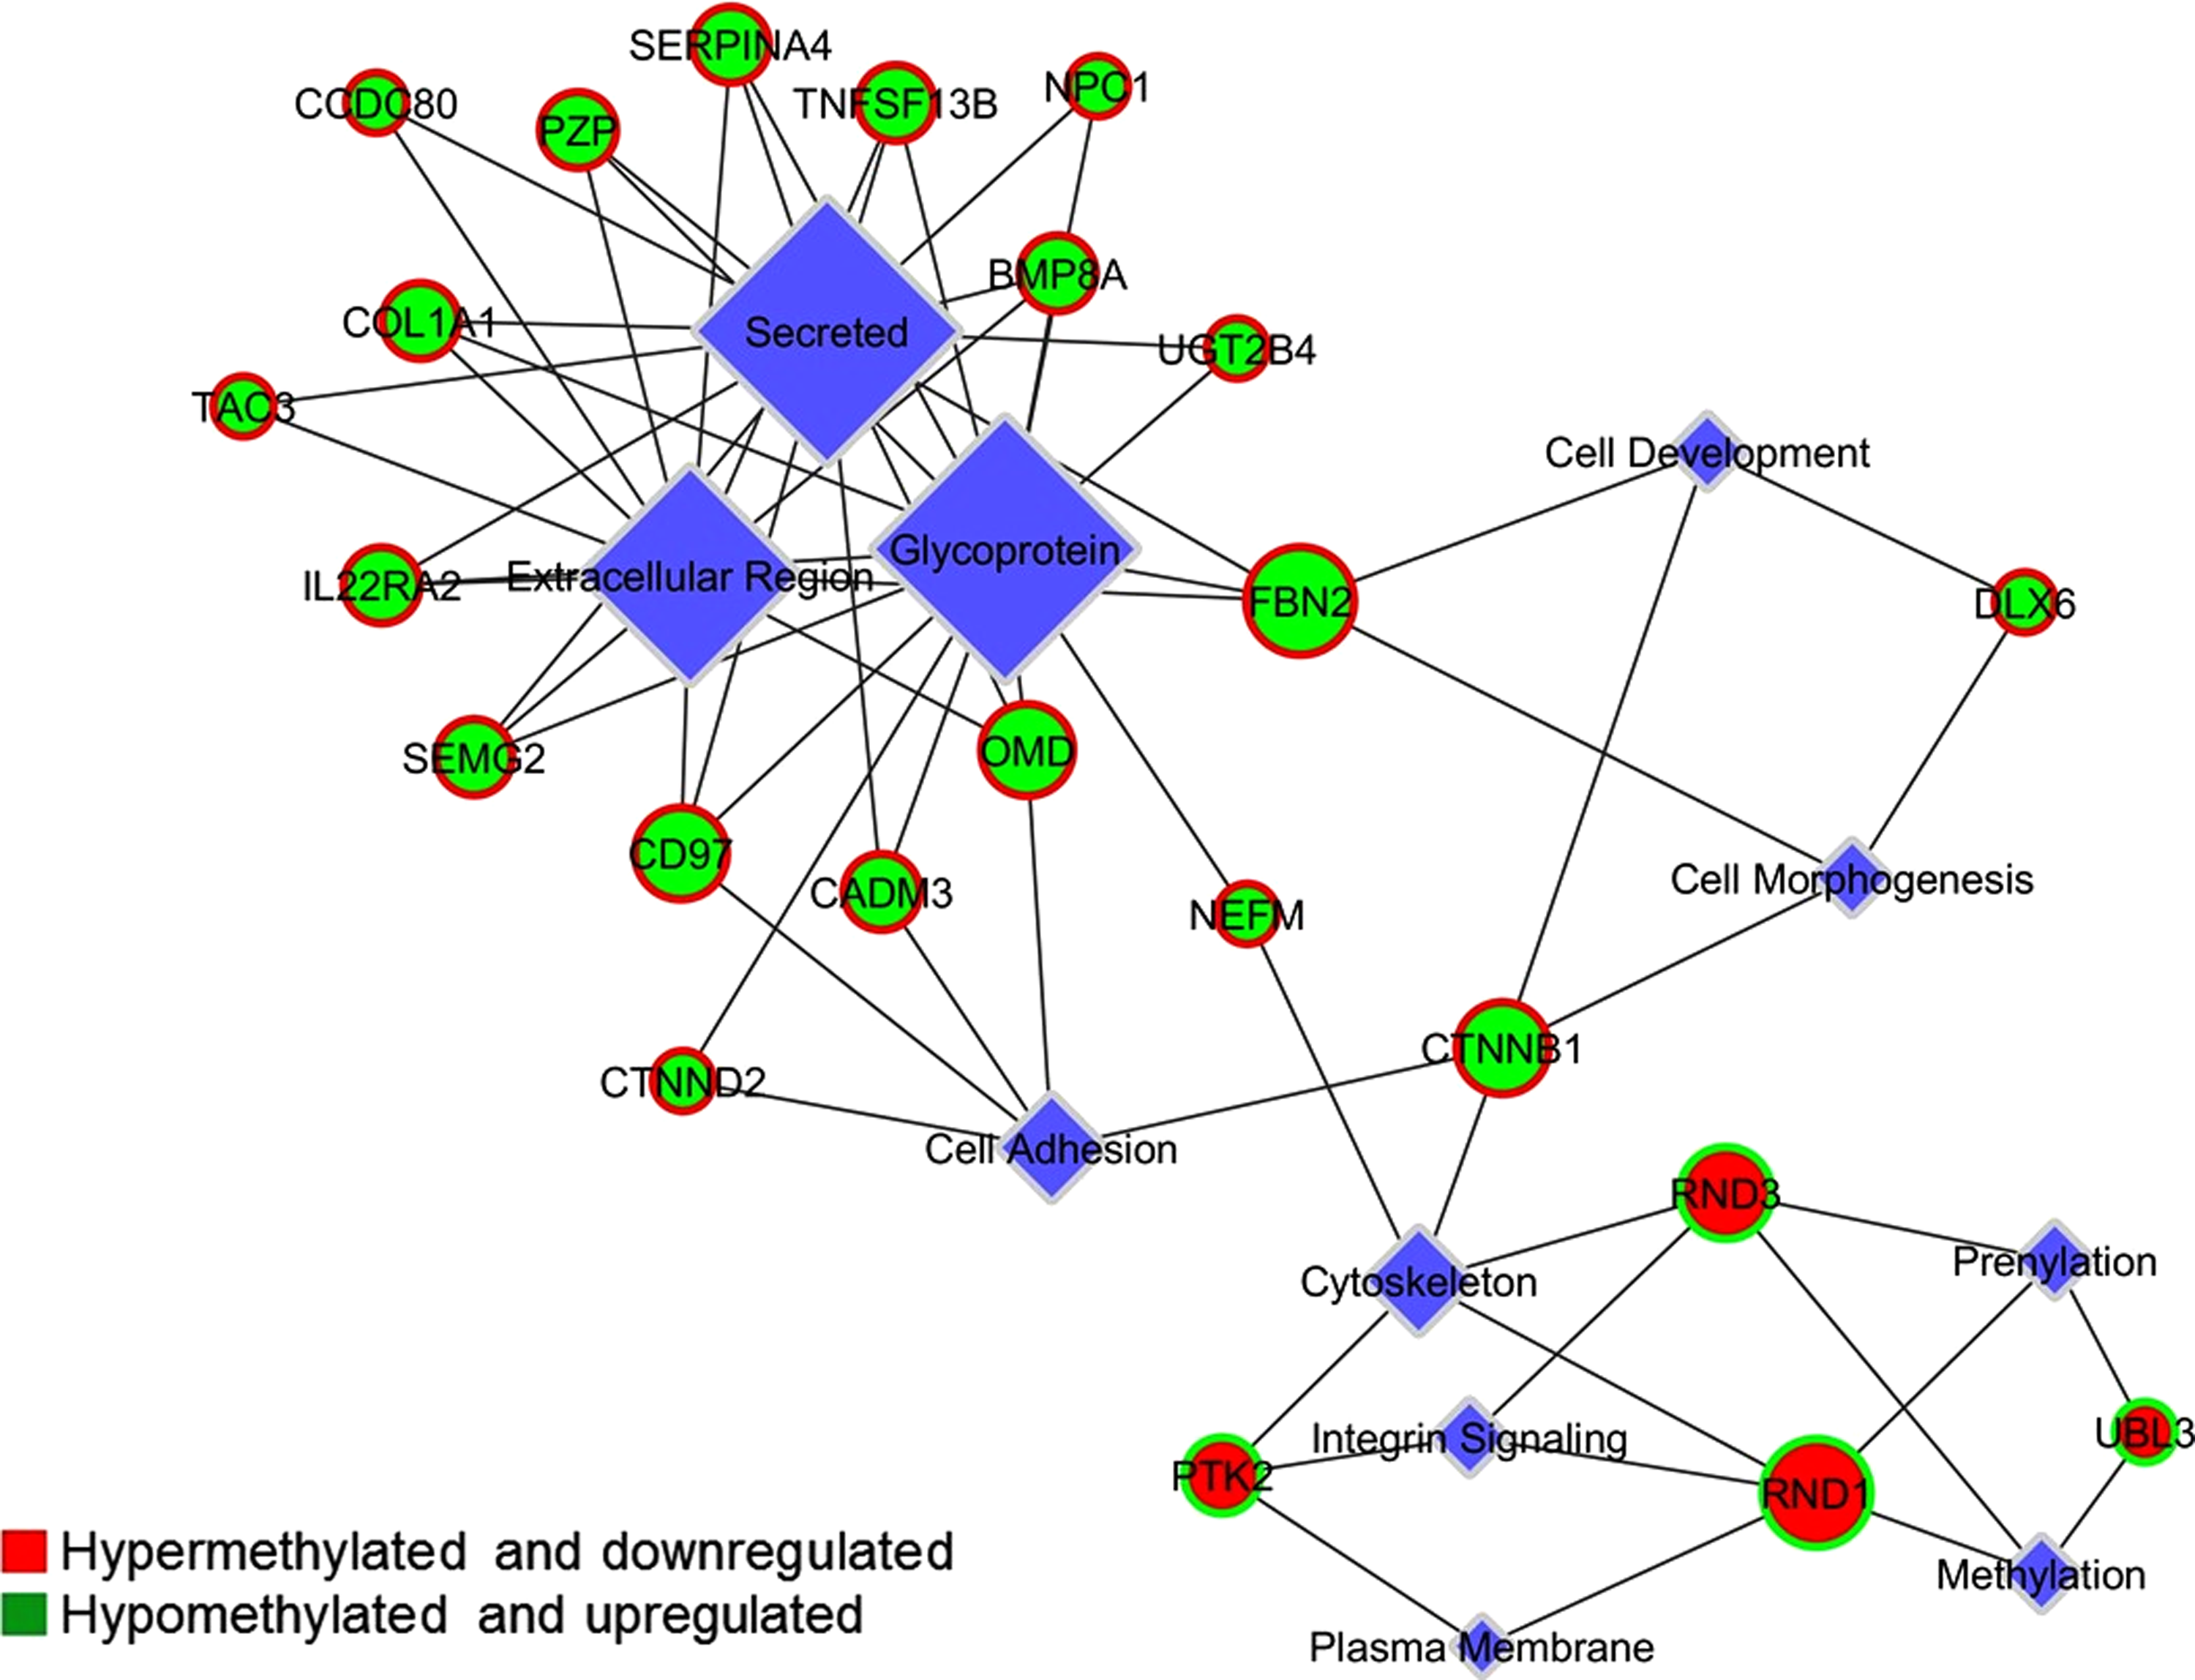
Integrome network analysis. It resolved 23 genes from a total of 74 genes (Gene set 3 + Gene set 4) that correlated methylation status with gene expression status. Network encompasses biological categories, differentially expressed and methylated genes that were significantly enriched. Green circles and red circles representing upregulated genes with hypomethylation and downregulated genes with hypermethylation, respectively.
All the 23 genes appeared to be relevant to tumor progression as they were found associated with the processes involved in tumor progression such as cell adhesion, integrin signaling, cytoskeleton organization, and extracellular matrix organizations. These included 4 genes PTK2, RND1, RND3, and UBL3 (Gene set 5) with promoter hypermethylation and downregulation, and 19 genes SEMG2, CD97, CTNND2, CADM3, OMD, NEFM, FBN2, CTNNB1, DLX6, UGT2B4, CCDC80, PZP, SERPINA4, TNFSF13B, NPC1, COL1A1, TAC3, BMP8A, and IL22RA2 (Gene set 6) with promoter hypomethylation and upregulation.
Protein–protein interaction analysis
For interactions among 23 genes at protein level we have used STRING 9.1 (http://string-db.org/). The generated network did not find any significant protein–protein interaction (Supplementary Information).
Methylation Efficiency Index (MEI)
Higher fold change in methylation does not necessarily reflects its effect on gene expression in terms of fold change, although sometimes lesser change in the extent of methylation contribute to biologically significant change in gene expression. Therefore, we have calculated the MEI score for all 23 genes found in Integrome analysis. The top five genes with highest MEI score were COL1A1 (MEI; 15.02), TAC3 (MEI; 14.0), SERPINA4 (MEI; 6.67), TNFSF13B (MEI; 3.20), and IL22RA2 (MEI; 2.27) (Fig. 8).
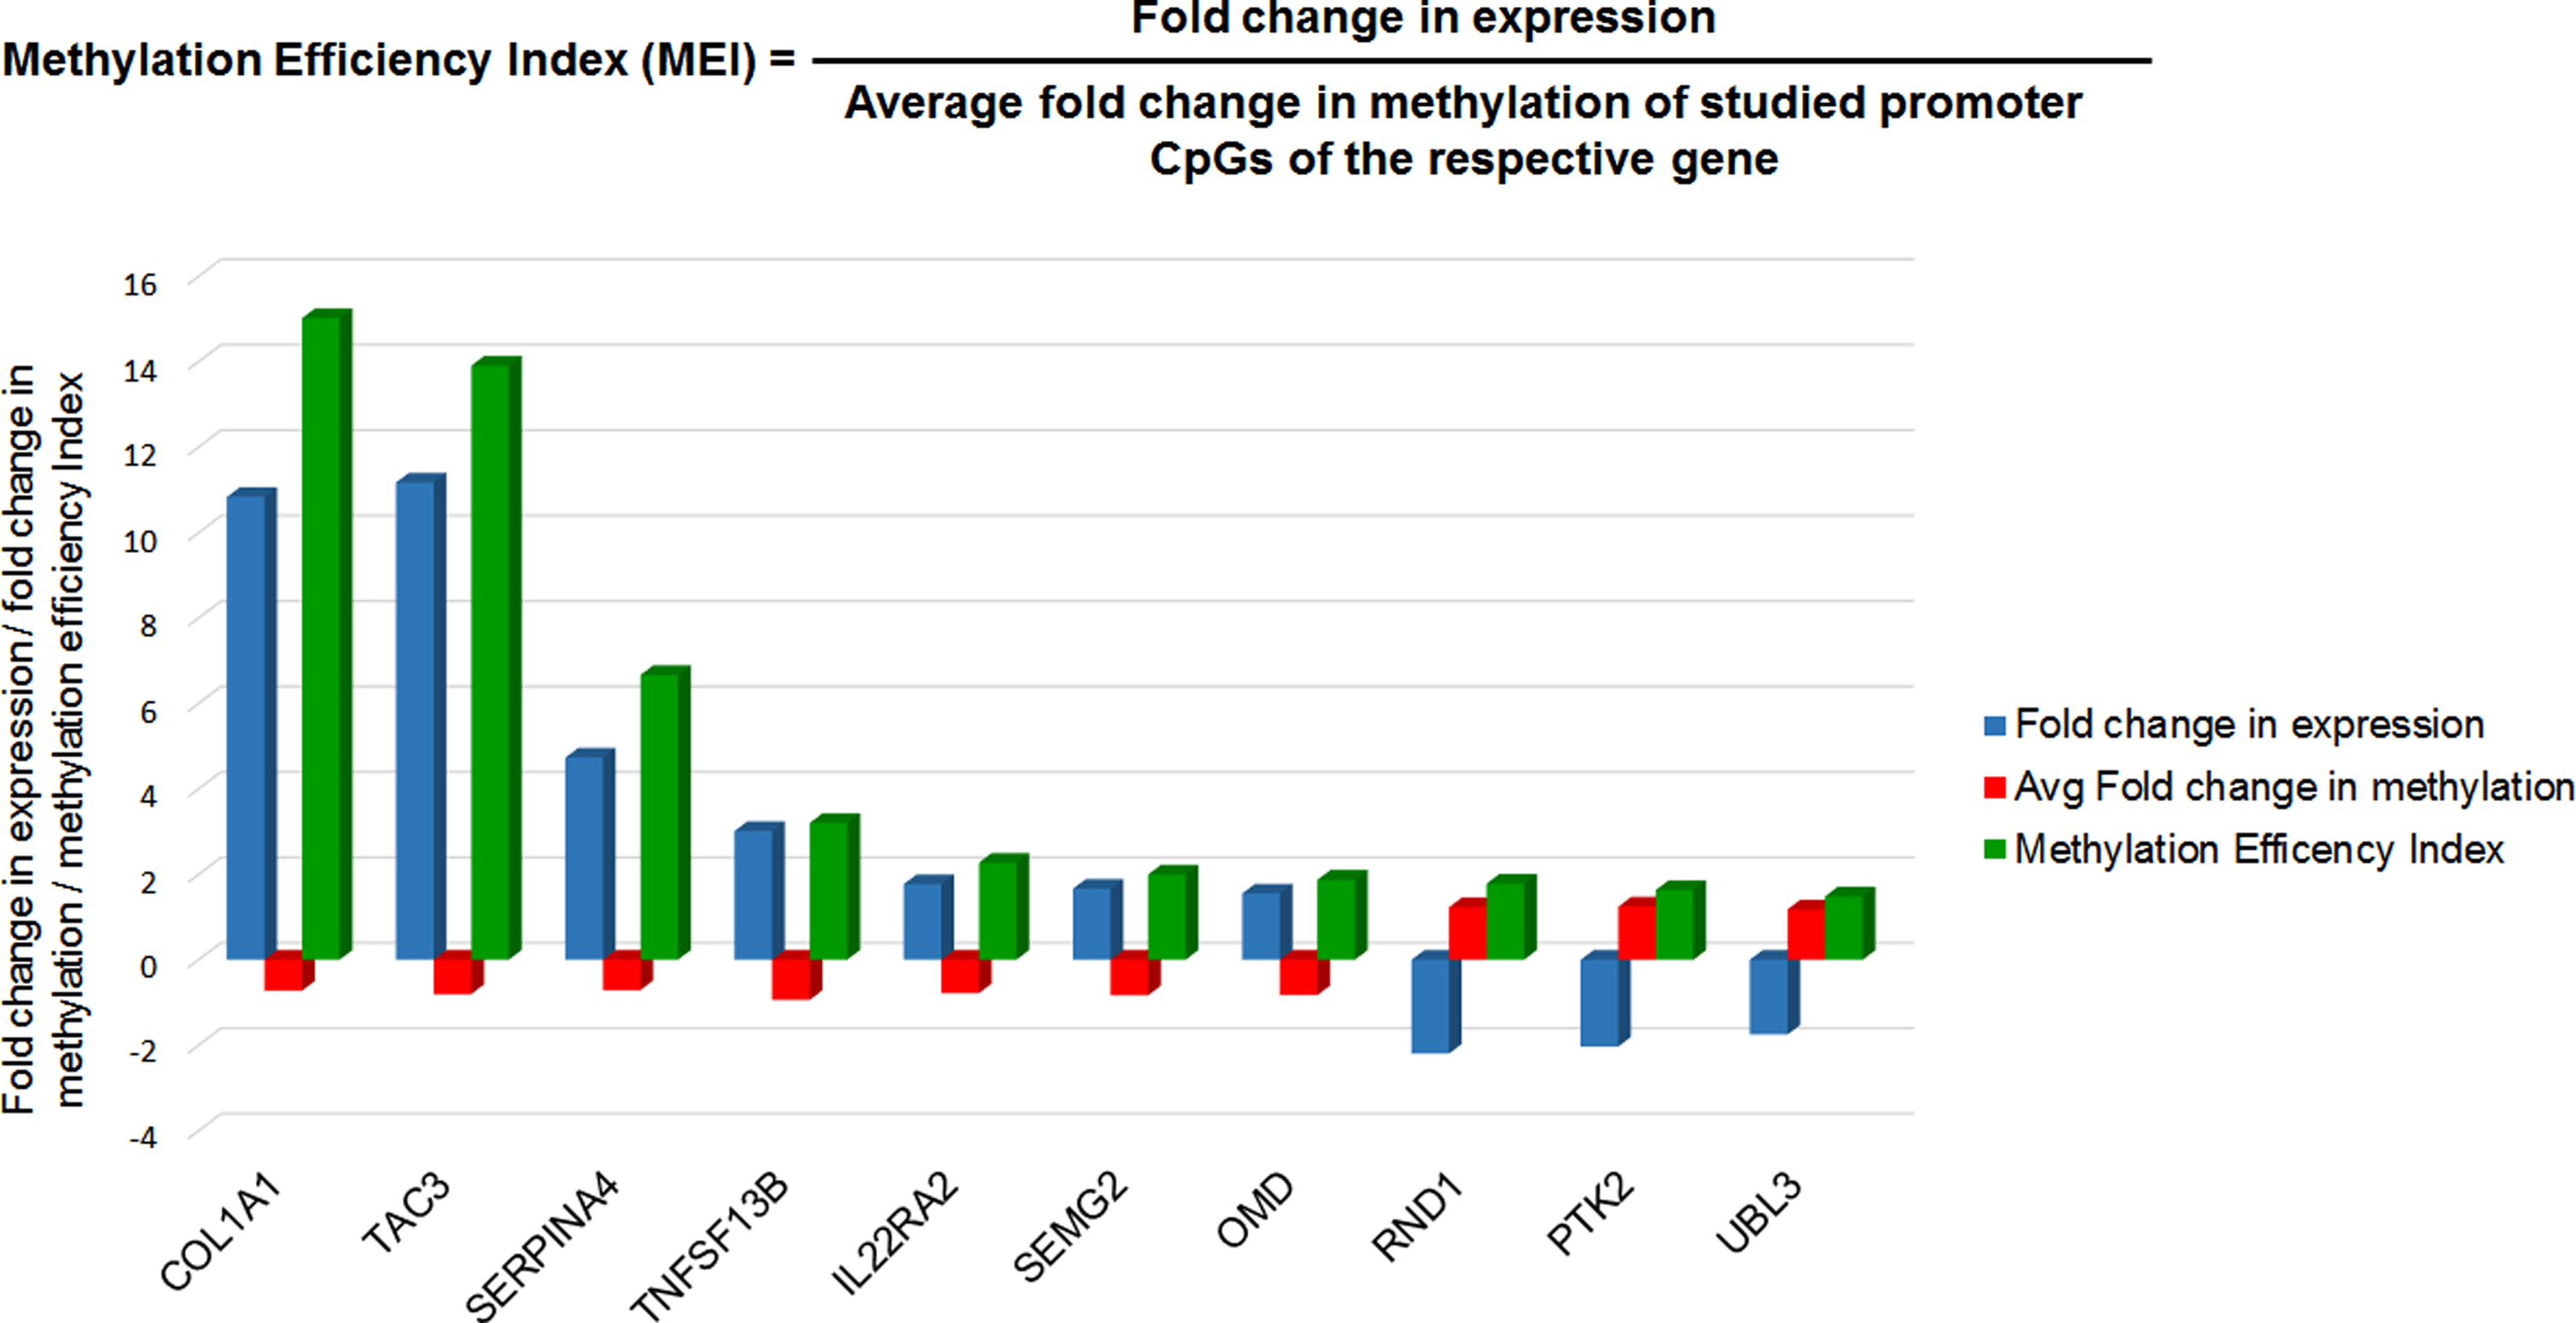
Top 10 genes with highest methylation efficiency index (MEI). Fold change in expression (up or down), average fold change in methylation (hypermethylation or hypomethylation), and MEI are represented by blue, red, and green color bar, respectively.
Discussion
Previously Li et al. (2014) has compared the results of Infinium 450k methylation and microarray gene expression data analyzed by BRB-Array Tools for ESCC in Chinese population. In the present investigation we have analyzed the 450k Infinium and microarray expression data of ESCC by a newly developed and more dedicated COHCAP algorithm. The COHCAP algorithm analyzes single-nucleotide resolution DNA methylation data produced by Infinium 450k array and is currently the only DNA methylation package that provides integration with gene expression data (Warden et al., 2013). The algorithm can generate lists of differentially methylated CpG islands with ∼50% concordance with gene expression from heterogeneous tissue sample data (Warden et al., 2013).
Followed by the data integration by COHCAP, we did the Integrome analysis to understand ESCC specific epi-regulome. Li et al. have identified 168 genes having differentially methylated CpG sites in their promoter region and an inverse gene expression pattern. Investigators further calculated the ESCC to control ratio of DNA methylation and gene expression rate for each gene, and picked up 3 genes with most significant difference between tumor and normal (i.e., EPB41L3, GPX3, and COL14A1).
However, in the current study, 74 genes were discovered that have differentially methylated CpGs in their promoter and inversely correlated gene expression. Subsequently, top 5 genes with highest methylation efficiency index scores were selected, viz., COL1A1, TAC3, SERPINA4, TNFSF13B, and IL22RA2 (Fig. 8). Among the top genes between Chinese population and current Northeast Indian population studies, the two genes (COL14A1 and COL1A1) showed parity in function. The genes code for collagen forming proteins, which are reported to be involved in extracellular matrix remodeling. Thus, population specific similarity and dissimilarity exist in the two ethnic population for esophageal carcinogenesis.
Among the top five epigenetically regulated genes, COL1A1 was cataloged with maximum MEI. COL1A1 encodes a protein called Collagen, type I, α1 which is a major component of type I collagen. Alterations in the synthesis of type I collagen are associated with normal growth and tissue repair processes (Ibanez et al., 2006). A microarray study done in ESCC in Taiwan disclosed molecular signatures, which were also used as templates to explicate their corresponding protein–protein interaction networks. The authors propounded the formation of a highly interactive network with hubs of upregulated genes BGN, COL1A1, COL1A2, and MMP9 and affirmed their association with tumor metastasis (Wong et al., 2009). In the present investigation, we have also found hypomethylation of COL1A1 with increased expression, along with other genes relevant to tumor progression as elucidated by gene enrichment analysis.
However, a recent report suggests hypermethylation of EPB41L3, GPX3, and COL14A1 genes to be associated with tumor progression in ESCC patients from China (Li et al., 2014). The investigators have also correlated hypermethylation of these genes with decreased gene expression, and methylation of these genes in plasma are suggested to be used as biomarkers for early diagnosis of ESCC (Li et al., 2014). Upregulation of COL1A1 and COL1A2 in Taiwanese population (Wong et al., 2009), hypermethylation and downregulation of COL14A1 in Chinese population (Li et al., 2014) and hyomethylation and upregulation of COL1A1 in Northeast Indian population found in present study, clearly suggest the deregulation of these extracellular matrix proteins in ESCC, regardless of ethnicity of the population.
The above cited report seems to be conflicting, nevertheless commending deregulation of collagen forming proteins in ESCC. Consequently, a comprehensive investigation of expression, genetic alterations, and epigenetic status of all genes that code for collagen forming proteins is warranted to elucidate their definite role in ESCC.
TAC3 (tachykinin 3 or neurokinin B) gene encodes a member of the tachykinin family of secreted neuropeptides (Pennefather et al., 2004). Huber et al. (1993) revealed that tachykinins contract the circular muscle of human esophageal body by activation of NK2 receptors without involvement of neural mechanisms. However, it was later contradicted by Krysiak and Preiksaitis that tachykinins acting on NK(2) receptors could partially account for nerve-mediated contractions in the human esophagus (Krysiak and Preiksaitis, 2001). Another related gene TAC1 (tachykinin-1) has been mapped to a genomic locus that customarily undergoes loss of heterozygosity in human cancers, including esophageal adenocarcinoma (Koppert et al., 2005; Walch et al., 2000).
Hypermethylation of TAC1 is commonly reported in both squamous and adenocarcinoma of esophagous, and is counseled as a tissue biomarker of a poor prognosis in ESCC (Jin et al., 2007). However, in the present investigation TAC3 promoter is found hypomethylated and correlated to enhanced gene expression. As number of studies related to tachykinins in esophageal cancer is very limited, this could be further explored as a new candidate gene.
SERPINA4 (kallistatin) is a unique serine proteinase inhibitor (serpin) and heparin-binding protein (Ahn et al., 2014). The gene transfer of SERPINA4 is also found to suppress angiogenesis and metastasis in a mouse model of hepatocellular carcinoma, mouse model of gastric cancer, and impairs tumor growth and enhances the survival of the Lewis lung carcinoma mice (Jiang et al., 2009; Shiau et al., 2010; Tse et al., 2008; Zhu et al., 2007). A proteomics study of small cell lung carcinoma has revealed mild increase of SERPINA4 protein levels and a more prominent increase of the fucosylated SERPINA4 form (Ahn et al., 2014). A recent report suggests that βII-spectrin (SPTBN1) suppresses progression of hepatocellular carcinoma and wnt signaling via regulation of wnt inhibitor kallistatin (Zhi et al., 2015).
In another study, the anti-angiogenesis effect of kallistatin in vivo was assessed by chicken chorioallantoic membrane neovascularization, and it was found that kallistatin significantly inhibits TNF-α-induced nuclear factor-κB activation (Huang et al., 2014). Additionally, it has been found that kallistatin decreased the expression of VEGF and other angiogenesis-related genes in human umbilical vein endothelial cells (Huang et al., 2014). Kallistatin has also been reported to suppress Wnt3a-mediated phosphorylation of LRP6 and glycogen synthase kinase-3β, and the elevation of cytosolic β-catenin levels in breast cancer cells (Zhang et al., 2013).
Furthermore, kallistatin antagonized Wnt3a-induced expression of c-Myc, cyclin D1, and vascular endothelial growth factor and prevents breast tumor growth and mobility (Zhang et al., 2013). Hypomethylation and upregulation of SERPINA4 gene in ESCC found in present study might be a defense mechanism for suppression of the tumor growth and metastasis. The current investigation is the first report of the role of SERPINA4 in ESCC, and it needs further validation in a large cohort of samples.
TNFSF13B gene encodes a 285 amino acid residue cytokine that belongs to the tumor necrosis factor (TNF) ligand superfamily and is also known as BAFF; TALL1; THANK; and BLYS. It is neutrophil derived cytokine, and exists both as type II membrane and a soluble molecule and is involved in tumor promotion (Tecchio et al., 2013). The protein regulates B cell physiology, including differentiation, proliferation, and immunoglobulin production, by interacting with its specific receptor, known as BAFF-R, but also with BCMA and TACI (Kalled et al., 2005; Tecchio et al., 2013).
Probably, we are the first to report the role of BAFF in ESCC. An elevated mRNA and protein expression of both BAFF and another neutrophil-derived cytokine APRIL have been detected in peripheral blood neutrophils from patients affected by oral cavity squamous cell carcinoma (OSCC) than in neutrophils from healthy subjects (Jablonska et al., 2011; 2012). Implication of the expression of tumor-promoting cytokines APRIL and BAFF along with anti-tumor cytokine TRAIL might be useful in the development of new strategies for supportive immunotherapy of OSCC disease and possibly for other types of neoplasm as well (Jablonska et al., 2011; 2012).
The transition from normal to neoplastic glands in prostate cancer is reported to be marked by a sharp decline of epithelial IL-7 and BAFF/BLyS production (Di Carlo et al., 2009). Also in human prostate IL-7 and BAFF regulate the local mucosal immune system by sustaining T-cell and B-cell survival via bcl-2 upregulation. In addition to the previously published known mechanisms that influence lymphocyte survival in prostate, colon, and hepatocellular carcinoma (Di Carlo et al., 2009; O'Connell et al., 1996; Strand et al., 1996), the authors implied that the sharp decline in the production of these two key lymphotropic molecules is a clear affirmation of a new pathway, enabling a tumor to escape from immunosurveillance. As suggested by the above reports, the role of BAFF along with other cytokines APRIL and TRAIL could be further scrutinized for immunotherapy.
IL22RA2 (interleukin 22 receptor, alpha 2) gene encodes a member of the class II cytokine receptor family and functions as a natural antagonist of IL-10-related T cell-derived inducible factor/IL-22. The soluble IL-22 receptor is also known as the IL-22 binding protein (IL-22BP) (Dumoutier et al., 2001; Huber et al., 2012). First, Dumoutier and colleagues screened the genomic DNA databases and described a gene encoding a protein of 231 amino acids, which showed 33 amino acid identity with the extracellular domains of the IL-22 receptor but lacked the transmembrane and cytoplasmic domains (Dumoutier et al., 2001). Expression of this gene was found maximum in breast, lungs, and colon.
Supplementary to this they prepared the recombinant protein, which binds with IL-22, and inhibits the activity of this cytokine in hepatocytes and intestinal epithelial cells (Dumoutier et al., 2001). IL-22BP is also reported to be imperative in controlling tumorogenesis and epithelial cell proliferation in the colon (Huber et al., 2012).
A heightened ratio of IL-22/IL-22BP revealed in the study because intestinal tissue damage causes an IL-18-dependent downregulation of IL-22BP. Further, authors proposed that this enhancement exerts protective properties during the peak of intestinal damage, but promoted tumor development if uncontrolled during the recovery phase (Huber et al., 2012).
A report from the literature states that ligand-receptor distribution of IL-22-IL-22R permits immune cells to regulate responses of epithelial cells, endothelial cells, fibroblasts, and other tissue-resident stromal cells (Sonnenberg et al., 2010). The pathway was found critically important at barrier surfaces where epithelial cells play an active role in the initiation, regulation, and resolution of immune responses (Sonnenberg et al., 2010). This ligand–receptor distribution might get disordered by the higher expression of IL-22BP, as found in our study. Ancillary upregulation of another cytokine BAFF found in the present study, reinforces the notion that immunosurveillance regulation mediated by IL-22 and BAFF needs to be explored for better immunotherapy.
Conclusions
The promoter methylation at immunorgulatory genes (IL22RA2 and TNFSF13B), extracellular matrix remodeling genes (COL1A1 and SERPINA4), and gene (TAC3) encoding neuropeptide involved in contraction of the circular muscle of human esophagous is found altered. Since four genes (TAC3, SERPINA4, TNFSF13B, and IL22RA2) out of five genes with highest MEI encodes circulatory proteins, their methylation and expression status in serum or plasma could be further explored for noninvasive biomarker for early detection as well as for chemotherapeutic efficacy assessment. The study supports the usefulness of integration of multi-omics data for understanding of the biology of complex disorders such as cancer. Although the study denotes circulatory proteins (TAC3, SERPINA4, TNFSF13B, and IL22RA2) to be useful for noninvasive markers of ESCC, a limited number of sample size and use of different set of samples for methylation and expression are the probable shortcomings. Proper validation of these markers in a separate large cohort of samples needs to be executed to overcome intersubject heterogeneity.
Footnotes
Acknowledgments
The authors sincerely thank Department of Biotechnology, Ministry of Science and Technology, New Delhi, India for providing financial support.
Author Disclosure Statement
The authors declare that no competing financial interests exist.
References
Supplementary Material
Please find the following supplemental material available below.
For Open Access articles published under a Creative Commons License, all supplemental material carries the same license as the article it is associated with.
For non-Open Access articles published, all supplemental material carries a non-exclusive license, and permission requests for re-use of supplemental material or any part of supplemental material shall be sent directly to the copyright owner as specified in the copyright notice associated with the article.
